


Features
- 5 Unique slides
- Fully editable and easy to edit in Microsoft Powerpoint, Keynote and Google Slides
- 16:9 widescreen layout
- Clean and professional designs
- Export to JPG, PDF or send by email


Do you have any questions?
Recommend


7 slides
Business Law Infographic
Demystify the intricate world of business law with our Business Law Infographic. Set against a crisp white backdrop, accented with authoritative purple, trustworthy blue, and attention-grabbing yellow, our template encapsulates the gravity and nuance of legalities in the corporate sphere. Furnished with clear-cut infographics, symbolic icons, and pertinent image placeholders, it decodes legal jargon into an easily comprehensible visual format. Precisely crafted for Powerpoint, Keynote, or Google Slides. An indispensable guide for business owners, legal consultants, corporate trainers, or any entity navigating the maze of business legislation.


6 slides
Business Growth and Progress Metrics Presentation
Showcase milestones, trends, and business wins with this sleek bar chart and line graph combo. Designed to illustrate upward momentum, each slide highlights progress using a trophy peak icon, 5 key steps, and editable labels. Ideal for quarterly reviews, growth tracking, and strategic updates. Fully compatible with PowerPoint, Keynote, and Google Slides.


4 slides
Corporate Networking Flow Presentation
Simplify complex communication systems with this dynamic and easy-to-follow presentation design. Perfect for visualizing workflow connections, team collaboration, or IT infrastructure, it brings clarity to multi-level processes with a clean and structured layout. Fully editable and compatible with PowerPoint, Keynote, and Google Slides for professional results.


5 slides
Scientific Research Data Presentation
Bring your research to life with a clean, dynamic layout designed to simplify complex findings and highlight key scientific insights. This presentation offers a structured flow for showcasing data, experiments, or results in a clear and engaging way. Fully compatible with PowerPoint, Keynote, and Google Slides.


8 slides
Startups Pitch Deck Presentation
Bring your idea to life with a bold, energetic layout designed to showcase vision, traction, and future potential. This presentation helps you communicate your business model, strategy, and key insights with clarity and confidence. Clean visuals and structured sections keep your message strong and compelling. Fully compatible with PowerPoint, Keynote, and Google Slides.


3 slides
Financial Planning and Budget Forecast Presentation
Present your financial goals with clarity using the Financial Planning and Budget Forecast Presentation. This modern, minimalist layout helps you break down percentage allocations, forecast future spending, and visualize budget insights with eye-catching graphics. Perfect for finance teams, startups, and consultants. Fully customizable in PowerPoint, Google Slides, Keynote, and Canva.


6 slides
OKR Goal-Setting Framework Presentation
Achieve clarity and focus with the OKR Goal-Setting Framework. This structured layout helps visualize objectives and key results using hexagonal elements for a clear strategic overview. Perfect for business planning, performance tracking, and team alignment. Fully editable and compatible with PowerPoint, Keynote, and Google Slides for effortless customization.


7 slides
Development Team Infographic
The showcased slides are meticulously designed for development teams, aiming to present key project details, timelines, and development processes effectively. The templates utilize a mixture of sleek designs and intuitive layouts that help visualize the complexities of software development and project management. The selection includes various infographic styles that cater to different informational needs such as workflow diagrams, progress timelines, and team structures.These templates are essential for development teams to communicate their strategies, milestones, and team roles clearly. They allow for the integration of technical data in a user-friendly manner, which can be crucial during stakeholder presentations or team meetings. With options ranging from minimalistic to data-rich layouts, these slides support detailed reporting and strategic planning, ensuring that every member of the team and stakeholders are on the same page regarding the project’s progression and objectives. The use of modern graphics and customizable elements also ensures that these presentations can be adapted to match the branding and aesthetic of different companies.

21 slides
Arcadian Photography Portfolio Template Presentation
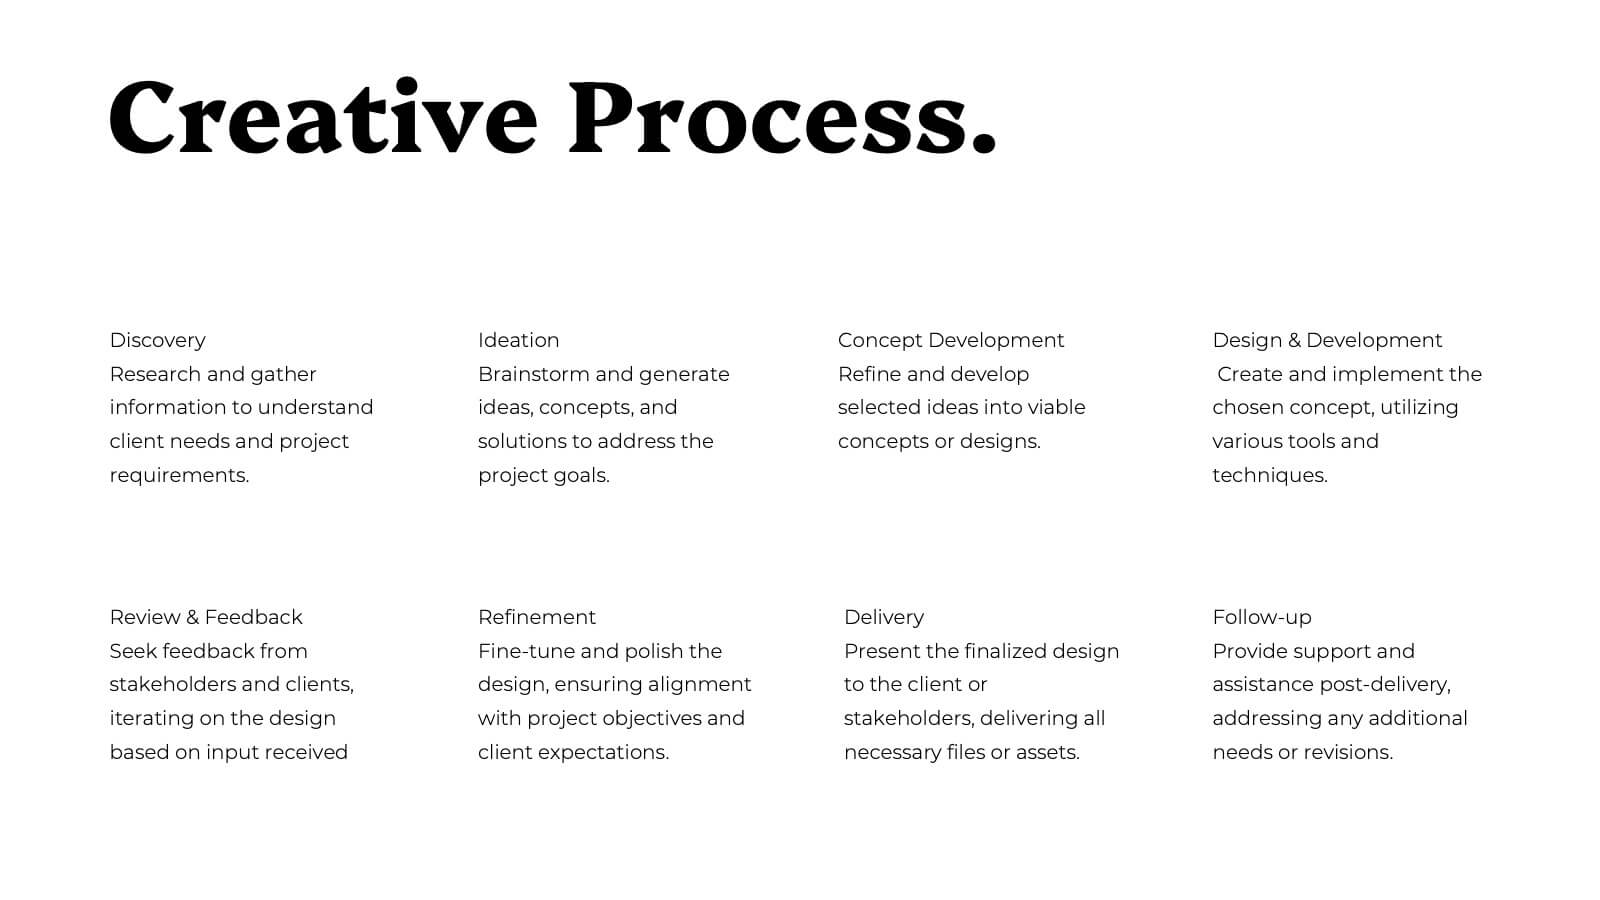
Showcase your best work with this sleek and stylish photography portfolio presentation template! It’s perfect for presenting your featured projects, creative process, and client testimonials in a visually stunning way. This template is fully customizable and offers a professional touch to your portfolio, making it ideal for both personal and client presentations. Compatible with PowerPoint, Keynote, and Google Slides.


7 slides
Decision Tree Diagram Infographics
A Decision Tree Diagram is a visual representation of a decision-making process that uses a tree-like structure to map out various possible outcomes and their associated probabilities. This template can be used in fields such as business, economics, and data science to model complex decision-making scenarios. This infographic starts with a single node, representing the initial decision that needs to be taken. From this node, paths extend to other nodes representing possible outcomes that could occur as a result of the initial decision. The final nodes of the diagram represent the end results.


5 slides
Home Investment and Property Value Presentation
Visualize key real estate insights with this skyline-themed slide, ideal for showcasing home investment data and market value trends. Designed for realtors, analysts, or housing consultants, it features a cityscape layout for clear comparison. Fully editable in PowerPoint, Keynote, and Google Slides for effortless customization and polished presentations.


7 slides
Cloud Infographic Presentation Template
This Cloud infographic, is a versatile and professional template designed for corporate presentations. This is perfect for businesses and organizations in the technology and IT field, as well as any company looking to showcase their data and information in a visually appealing way. This template features a corporate style with a blue theme, which gives it a professional look and feel. The slides are filled with icons, and other visual elements that will help you communicate your message in an effective way. This template has everything you need to create an engaging and informative presentation.


20 slides
Sylph Design Portfolio Presentation
Dive into a creative journey with this visually striking design portfolio presentation template! Ideal for showcasing design processes, mood boards, and final outcomes, it’s perfect for impressing clients or stakeholders. Highlight your design skills and methodology with this modern, sleek format. Compatible with PowerPoint, Keynote, and Google Slides for seamless integration into your workflow.


8 slides
Credit Card Benefits and Features Presentation
The "Credit Card Benefits and Features" presentation template effectively outlines the various advantages and key features of credit cards. This template uses vibrant icons and a clear layout to differentiate each benefit, making it easier for audiences to understand the unique selling points of each card. The color-coded elements guide viewers through essential data points such as cash back, rewards programs, security features, and interest rates, making it ideal for financial seminars, customer education, or internal training. Each section is customizable, allowing for detailed descriptions and the addition of specific benefits tailored to different credit card offers.


22 slides
Amberwood Advertising Agency Proposal Presentation
This Agency Presentation Template provides a professional layout to showcase your company's mission, services, and success stories. It covers key areas such as market analysis, strategy development, campaign execution, and future outlook. Ideal for creative agencies, it is fully customizable and compatible with PowerPoint, Keynote, and Google Slides.


7 slides
Solutions to Problems Infographic
These slides are designed to outline and explore solutions to identified problems in a clear and effective manner. Each slide uses a clean layout with a consistent color theme that enhances readability and focus. They effectively combine text and graphical elements to showcase problem-solving strategies, making the slides ideal for business presentations or strategic meetings. The inclusion of icons and diagrams aids in visualizing the problem-solving process, and the structured design ensures that the information is presented in a logical sequence. This approach not only aids in communicating the solutions effectively but also engages the audience by making complex information easier to understand. These templates can be adapted for various industries and scenarios, where clear communication of problem-solving steps is crucial. They are especially useful for team discussions, stakeholder presentations, and strategic planning sessions.


4 slides
Visual Relationships in Venn Format Presentation
Highlight similarities and differences between two or more ideas using this clean, two-circle Venn diagram layout. Ideal for comparing concepts, teams, or strategies. Customize icons, text, and color themes effortlessly. Compatible with PowerPoint, Keynote, and Google Slides—perfect for business meetings, educational content, and marketing comparisons.