


Features
- 5 Unique slides
- Fully editable and easy to edit in Microsoft Powerpoint, Keynote and Google Slides
- 16:9 widescreen layout
- Clean and professional designs
- Export to JPG, PDF or send by email


Do you have any questions?
Recommend


5 slides
Social Myths & Facts Infographics
A Social Myth might be a certain belief, while a Social Fact would be the correct answer with data. This engaging and informative Infographics template is designed to help you dispel common misconceptions and provide accurate information on various social topics. With this template you can cover stereotypes, challenge myths, or present facts to promote understanding and awareness. The template features a modern design with vibrant colors and captivating visuals, making it visually appealing and easy to navigate. It includes a variety of design elements such as icons, illustrations and timelines that can all be customized.


12 slides
Business Strategy with 7S Model Presentation
Streamline your strategic discussions with our Business Strategy with 7S Model presentation template, crafted for professionals who demand precision and clarity. Each slide methodically details the seven interrelated elements—Structure, Strategy, Systems, Skills, Staff, Style, and Shared Values—ensuring a comprehensive analysis of your organization's alignment. This versatile template enhances your presentations in PowerPoint, Keynote, and Google Slides, providing a visually engaging way to explore complex business strategies and foster insightful conversations.


6 slides
Business Milestone Timeline Presentation
Showcase key achievements and future goals with the Business Milestone Timeline Presentation. This visually engaging template allows you to highlight crucial company events, project phases, or strategic plans in a clear, structured format. Ideal for corporate reporting, business growth tracking, and investor presentations. Fully customizable and compatible with PowerPoint, Keynote, and Google Slides.


4 slides
Fishbone Diagram for Root Cause Analysis
Dive into the source of any problem—literally. This fishbone diagram template offers a smart and visual way to map out causes leading to a business issue, helping teams brainstorm solutions effectively. Ideal for workshops, meetings, and audits. Easily editable in PowerPoint, Keynote, and Google Slides.


3 slides
Company Mission Overview Presentation
Bring your message to life with a bright, modern slide that highlights purpose, direction, and organizational goals in a clean, engaging layout. This presentation helps you communicate mission-driven insights with clarity and visual impact, making it ideal for internal teams or stakeholders. Fully compatible with PowerPoint, Keynote, and Google Slides.


7 slides
Pyramid Scheme Infographic Presentation
A Pyramid Infographic is a great way to organize, highlight, and illustrate your ideas and content. This design uses visual hierarchy and colors to convey key information in an attractive way. The Pyramid incorporates colorful diagrams to allows your text to stand out while it is set against a white background. This is a simple, engaging design that can be easily edited. This is great for analyzing data and it is the perfect choice to impress the audience. It will surely help you convey your message in a much better way. It's a great way to communicate the key points of your Infographic.


10 slides
Business Risk Management Framework Presentation
Elevate your risk analysis with the "Business Risk Management Framework" template, offering a dynamic and customizable approach to effectively present and evaluate risk data. It features various risk gauges and icons for visual representation, ensuring key insights are easily understandable. This template facilitates comprehensive risk analysis presentations and is compatible with PowerPoint, Keynote, and Google Slides.


7 slides
Venn Diagram Infographic Presentation Template
A Venn diagram is a type of chart that uses circles to show the similarities and differences between two or more sets of items. The circles overlap in the areas where the items have something in common, and the non-overlapping areas show the items that are unique to each set. This template is perfect for showing how different things are alike and different. This template includes lots of diagrams with circles that you can customize to show all the similarities between your different information. You can also add pictures and charts to make it look more appealing with your personal data.


6 slides
Managing Transition in Business Presentation
Make your next strategy session visually unforgettable with this clean, step-by-step layout. Designed to help explain transitional phases in business, this infographic template simplifies complex change processes into digestible segments. Ideal for professionals presenting transformation strategies. Fully editable and compatible with PowerPoint, Keynote, and Google Slides for easy use.


7 slides
Asia Map Infographic Presentation Template
Asia is the largest, most populous, and most culturally diverse continent. Asia constitutes of nearly one-third of Earth's landmass and is lying entirely north of the equator. The continent is home to a variety of cultures, ethnic groups, and religions. This Asian map template includes the different labeled countries, and graphs with statistics. This can be used to show your audience the geographical layout of Asia, or as an example of what a modern, professional presentation should look like. This template is a great resource for students, teachers and people who want to learn more about Asia.


6 slides
Business Framework Strategy Presentation
Dive into strategic planning with our Business Framework Strategy presentation template. This design brilliantly visualizes the essentials of business frameworks, guiding users through critical insights with a visually appealing, color-coded process. Ideal for strategists and planners, it offers a streamlined way to present complex information effectively. Compatible with PowerPoint, Keynote, and Google Slides, this template is a versatile tool for delivering impactful business strategies.


8 slides
Target Audience Segmentation Strategy Presentation
Refine your marketing approach with the Target Audience Segmentation Strategy presentation. This professionally designed slide helps you identify, analyze, and visualize key audience segments to enhance your outreach. Perfect for marketers, business strategists, and data analysts, this editable template ensures a clear, data-driven approach to customer targeting. Compatible with PowerPoint, Keynote, and Google Slides.


6 slides
Real Estate Investment Strategy Presentation
Illustrate your property plans with this Real Estate Investment Strategy Presentation. Designed as a stylized house diagram, this slide organizes six key areas of investment into clearly segmented zones with icons and colors for each layer. Ideal for property development, real estate pitches, or investor overviews. Compatible with PowerPoint, Canva, Keynote, and Google Slides.


23 slides
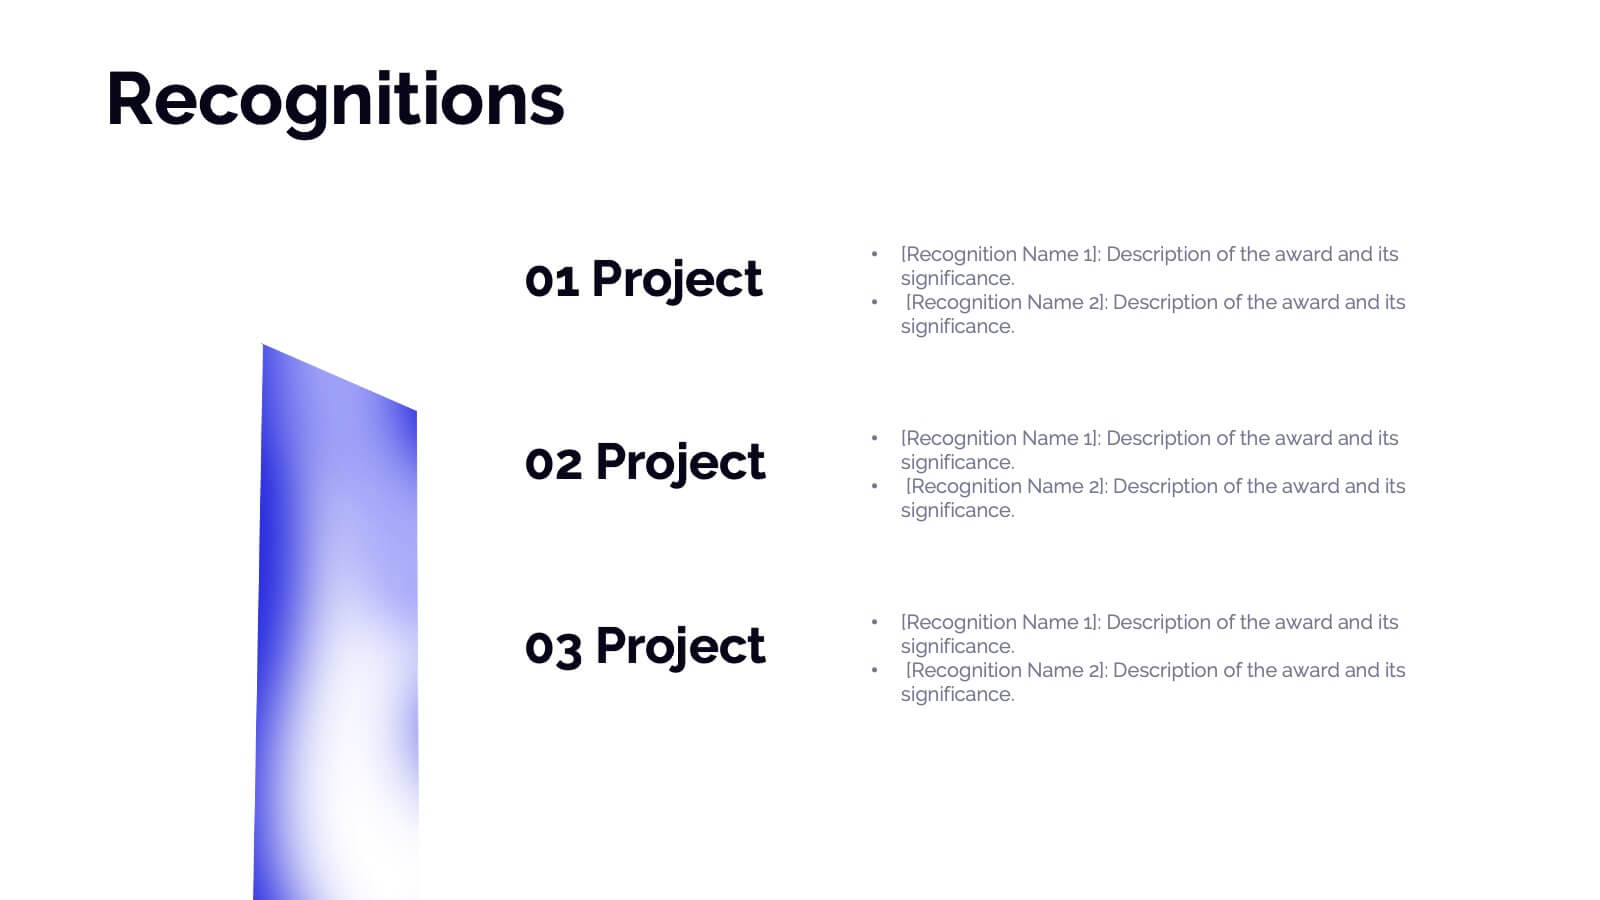
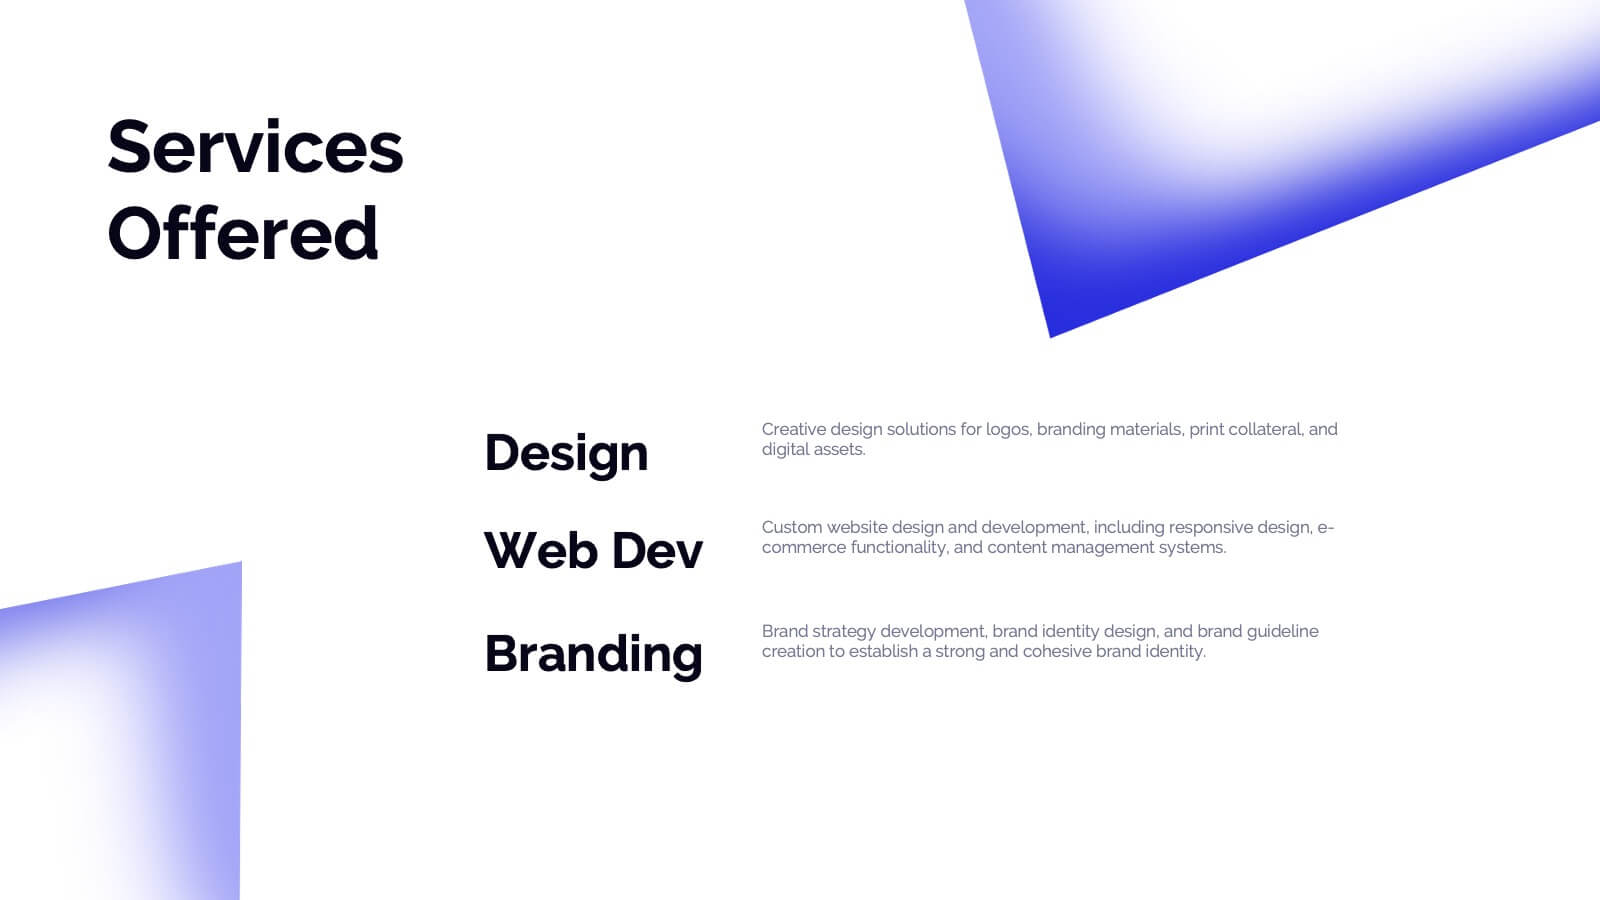
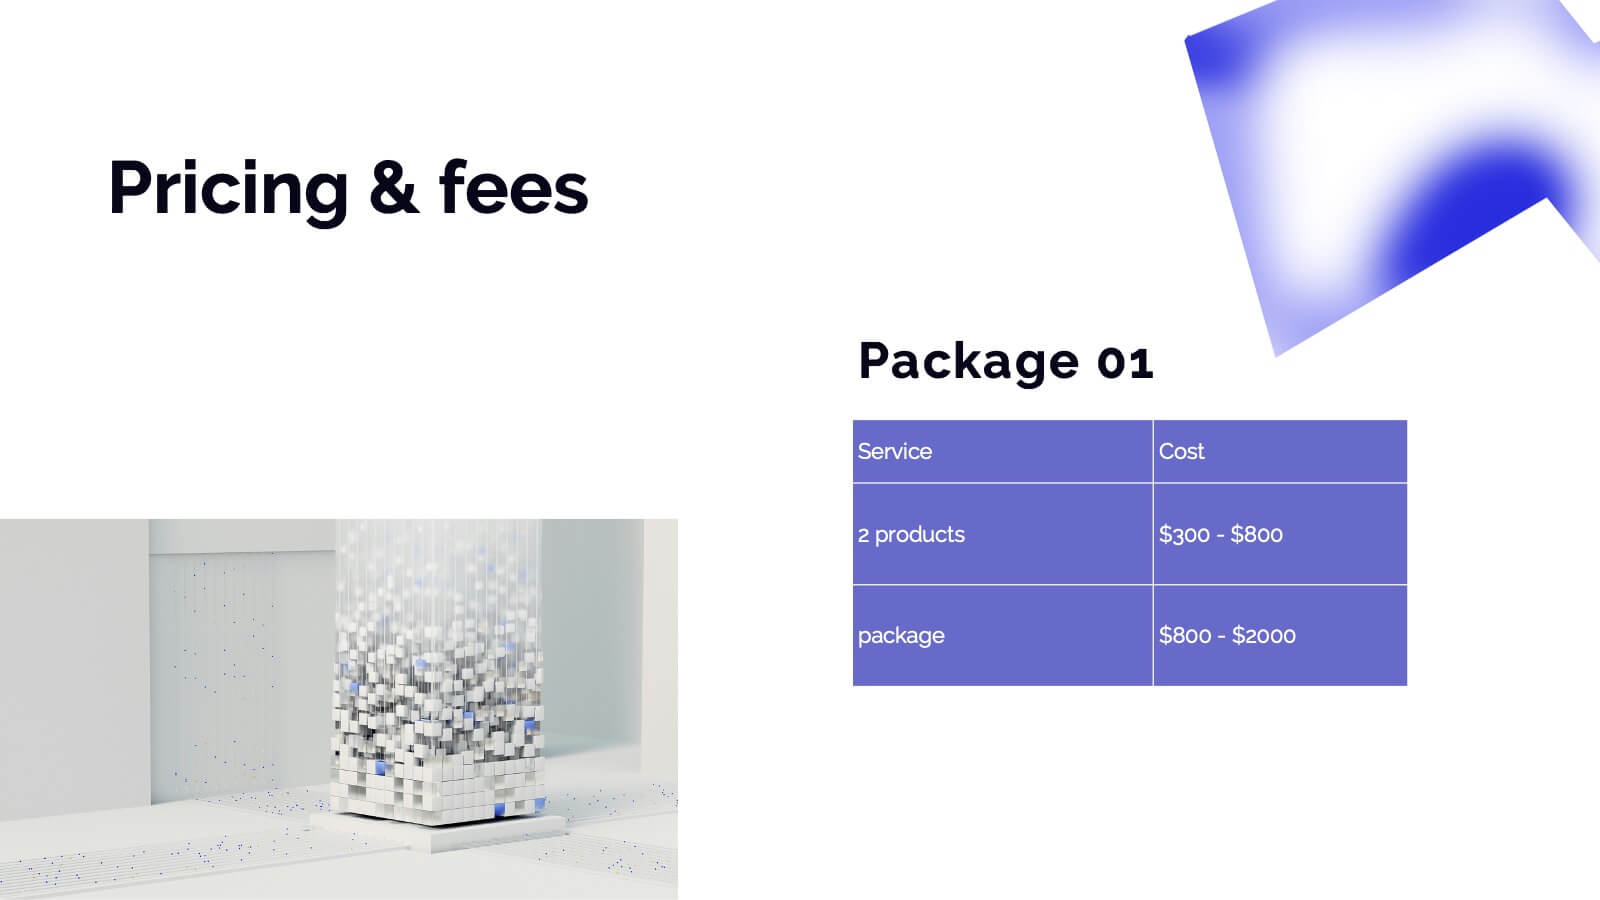
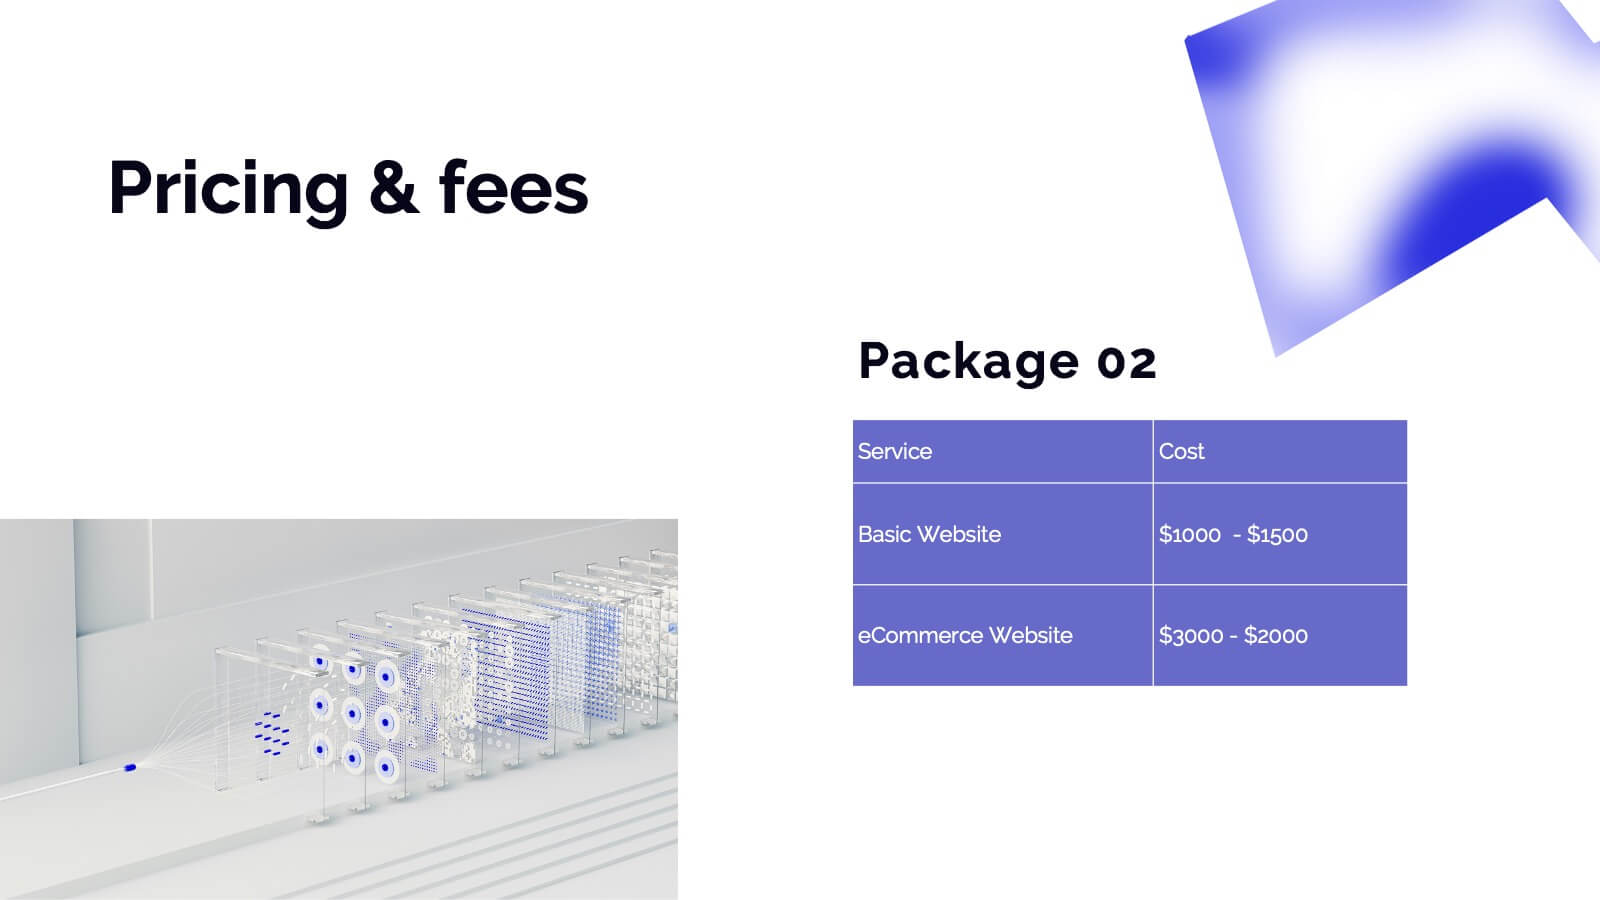
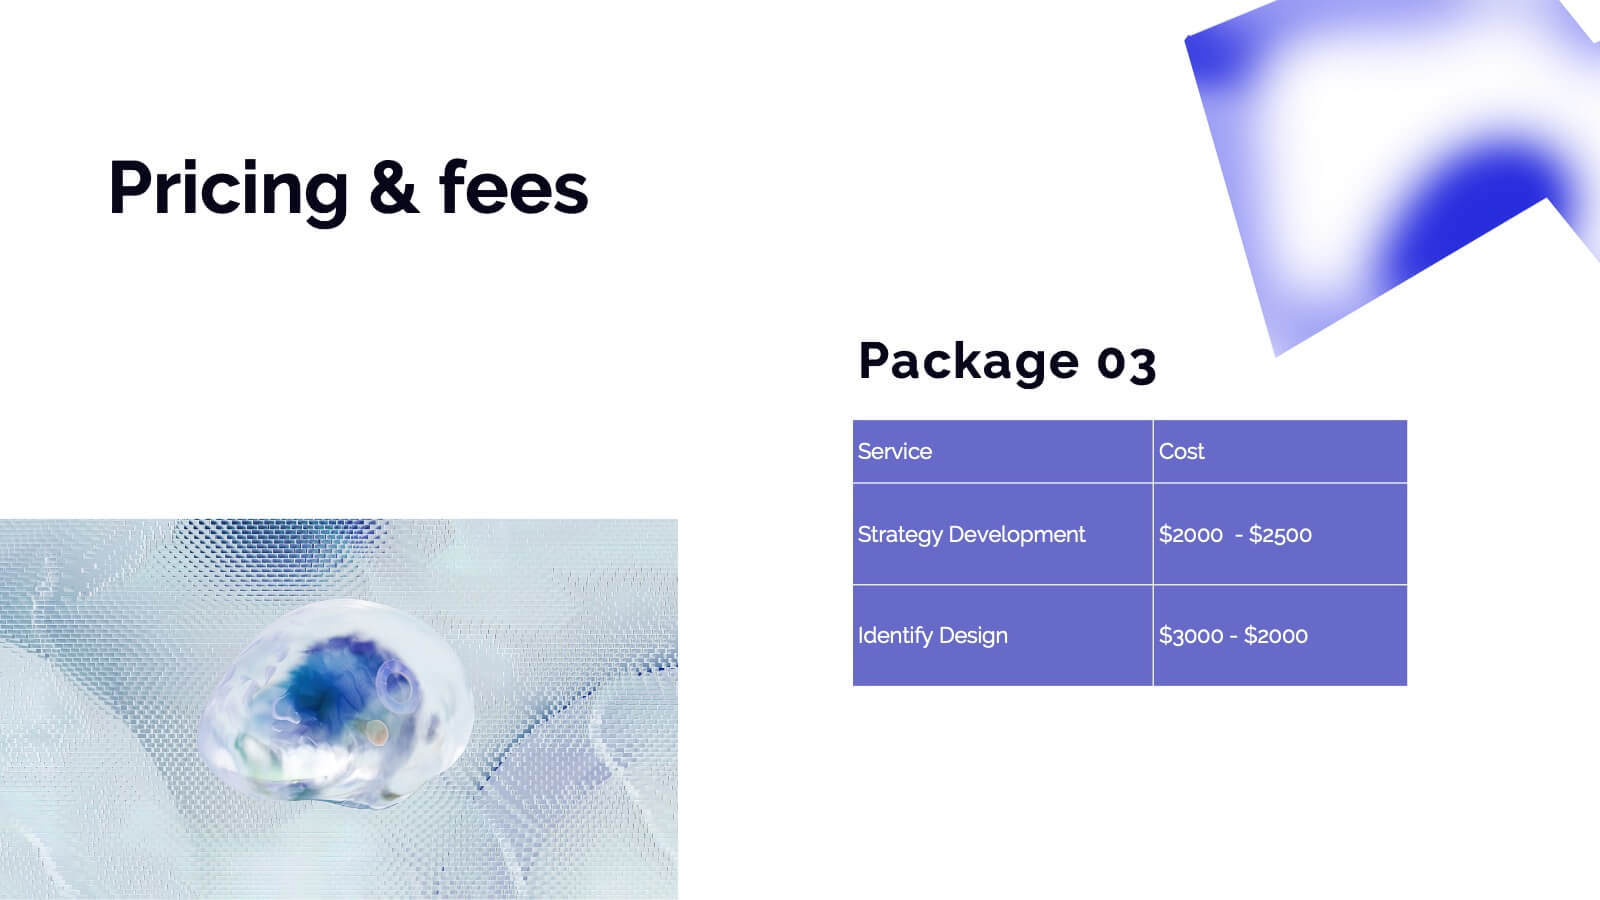
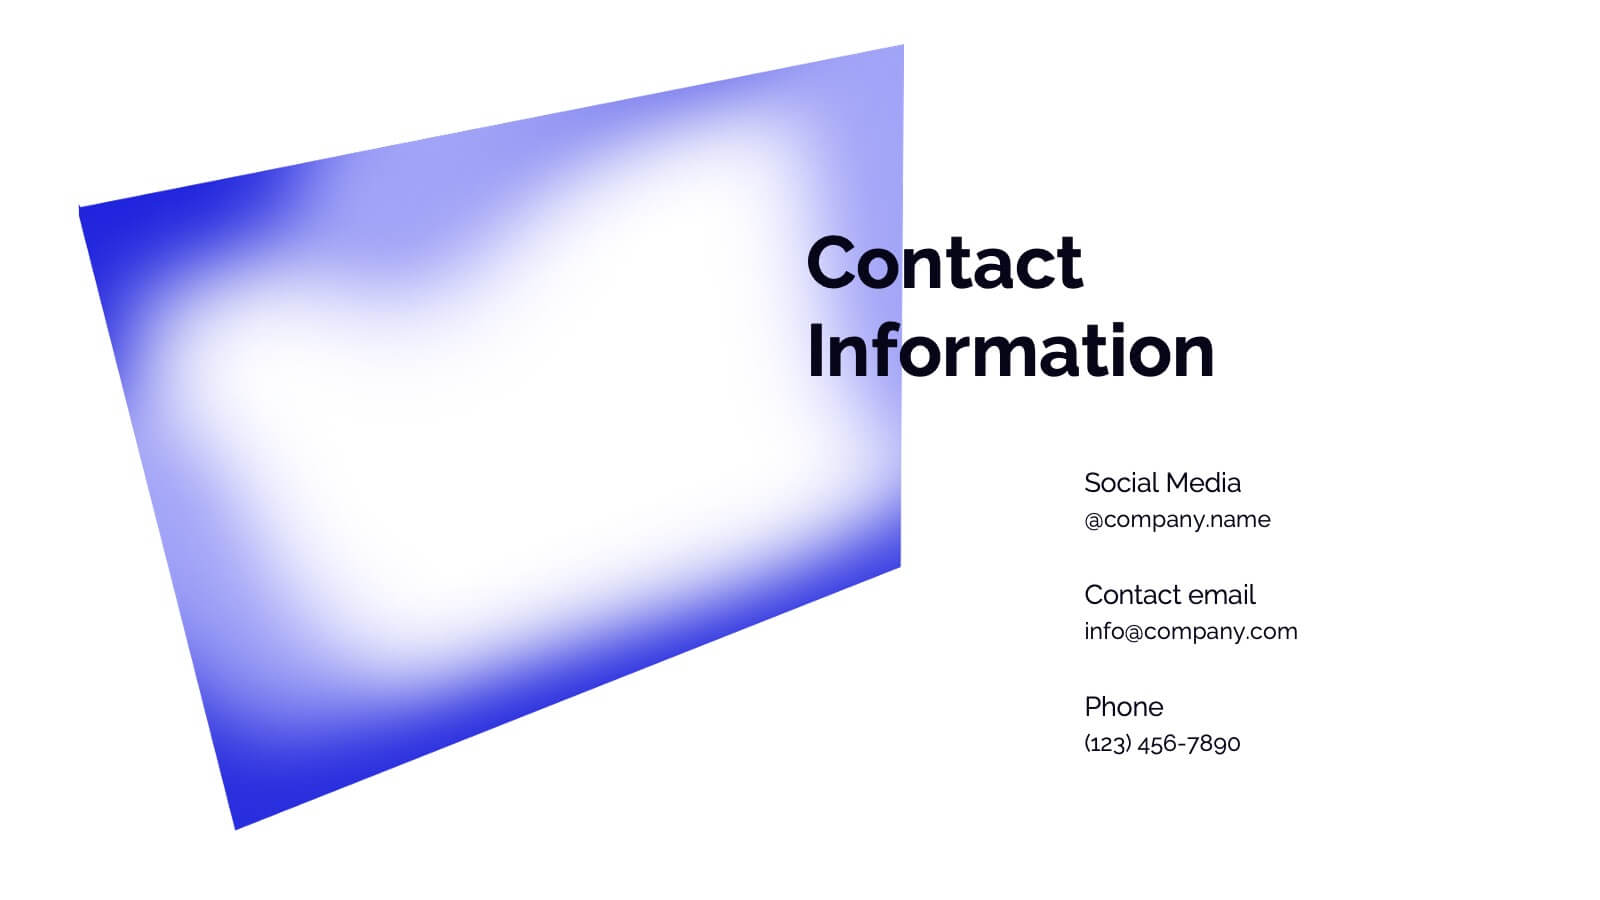
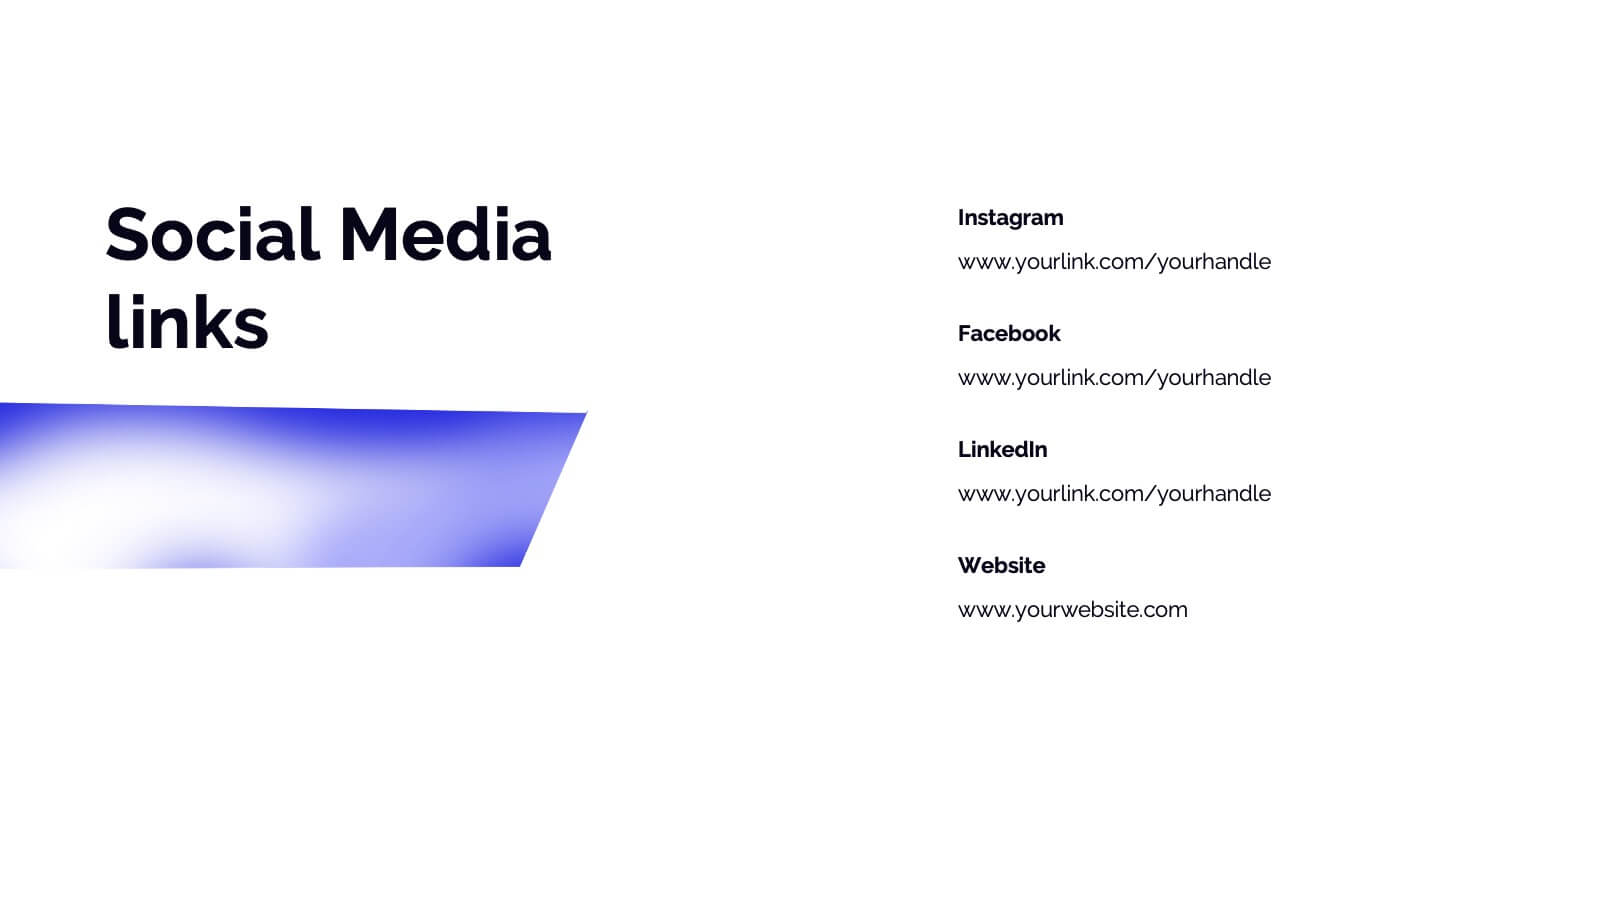
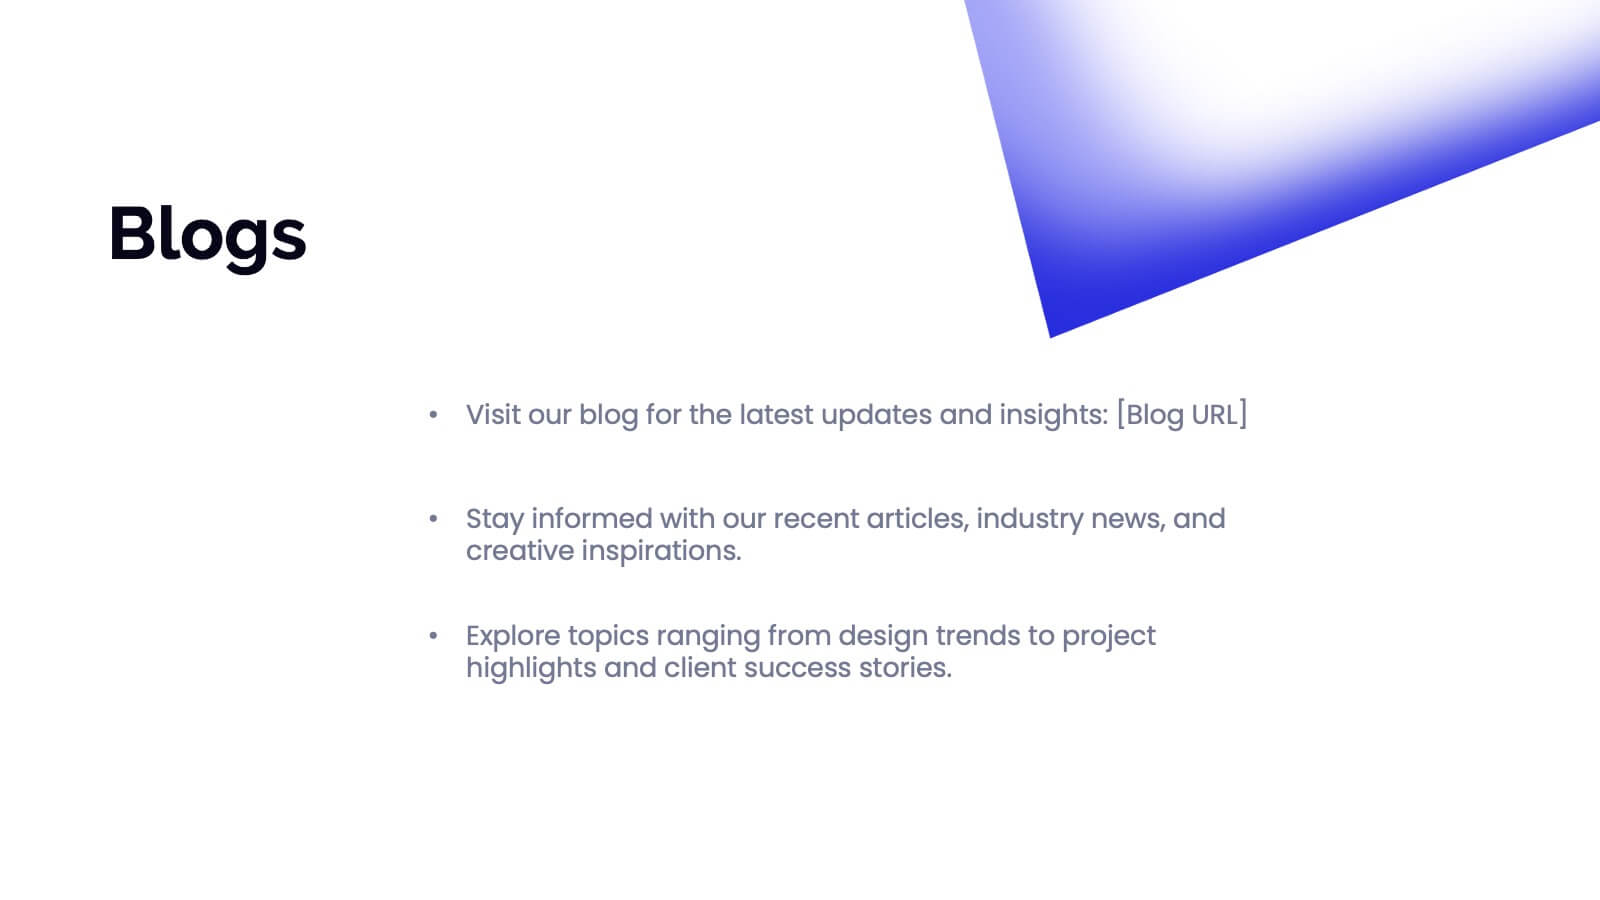
Dryad Photography Portfolio Template Presentation
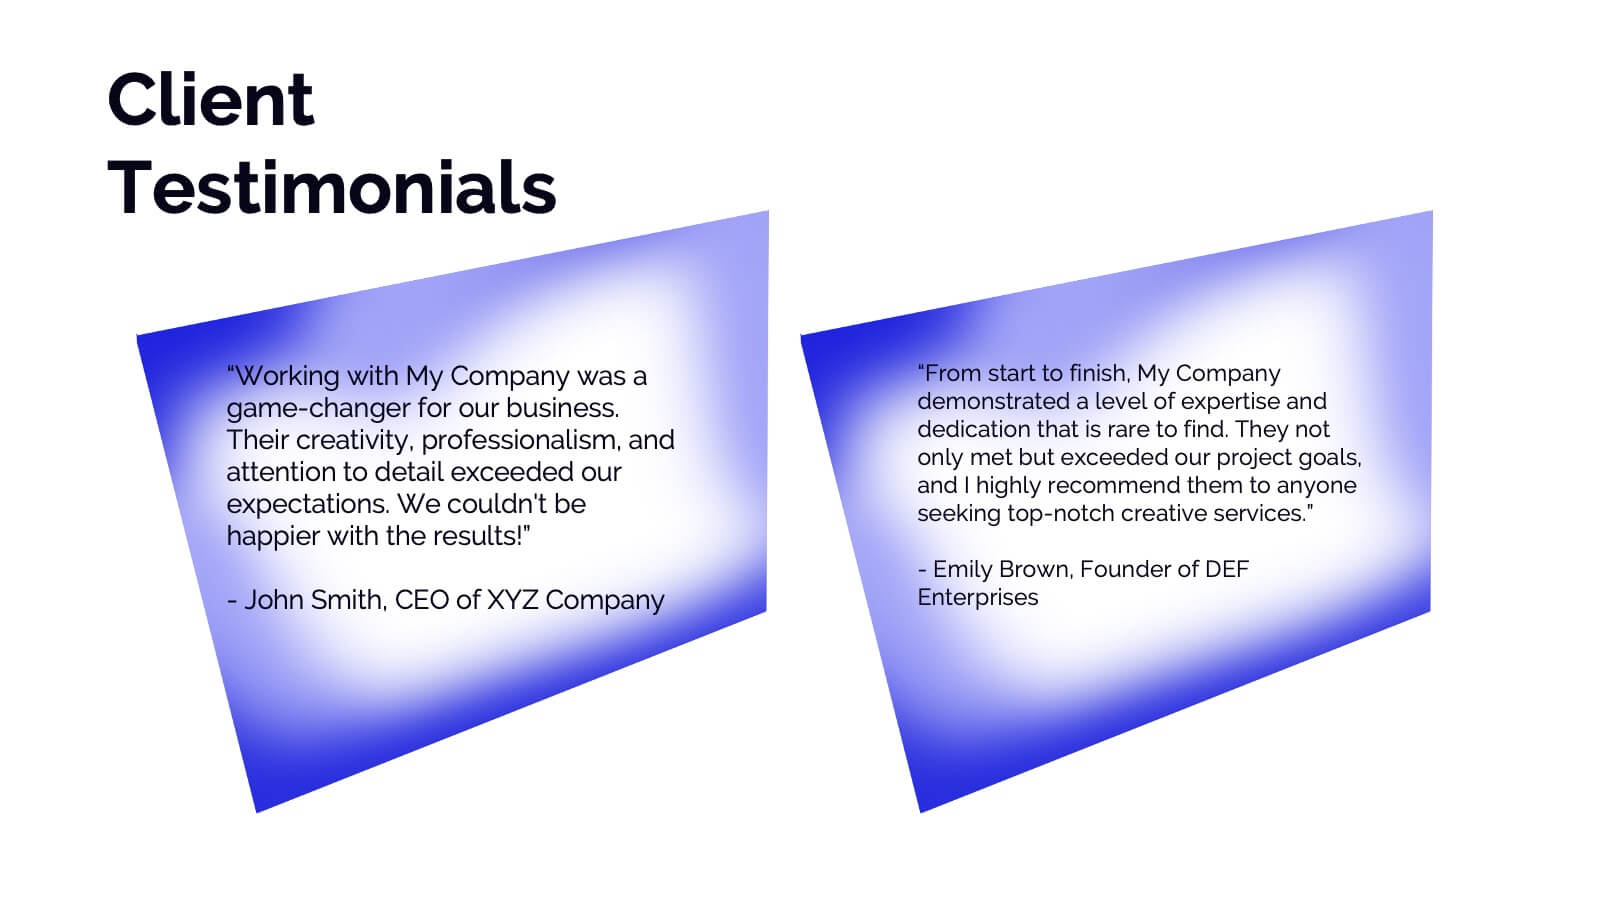
Showcase your photography skills with this elegant and professional portfolio presentation template! Perfect for highlighting your projects, style, and creative process, this template covers everything from client testimonials to pricing and services offered. It’s ideal for photographers wanting to present their work with style and clarity. Compatible with PowerPoint, Keynote, and Google Slides for effortless sharing and presentations.


7 slides
Weight Challenge Infographic Presentation
Challenges are essential for personal and professional growth, and they play an important role in our lives in several ways. This template is designed for any and all use. You can use it in business, academic presentations, or home. This template is designed to give you flexibility in your presentations and allow you to create dynamic content that stands out from the crowd. This is compatible with Powerpoint, Keynote, and Google Slides so you can easily edit your presentation. This template can be used for a variety of projects, including team building, goal setting and brainstorming!


5 slides
Team Role Distribution Matrix Presentation
Clarify responsibilities and improve collaboration with the Team Role Distribution Matrix Presentation. This RACI-style slide helps visualize team accountability across multiple tasks, making it ideal for project management, cross-functional teams, or workflow planning. Each layout option includes clearly labeled roles and color-coded responsibilities: Responsible, Accountable, Consulted, and Informed. Fully editable in Canva, PowerPoint, Keynote, and Google Slides.


5 slides
Social Media Marketing Infographics
Social Media Marketing is an essential component of any modern marketing strategy. These vertical infographics can be used to provide valuable insights into the most effective social media platforms, the latest trends in social media marketing, and tips and strategies for optimizing social media campaigns. These are an excellent way to communicate complex information in an easy-to-digest format and can be used for marketing and educational purposes. Use these infographics to Include data on user demographics, engagement rates, platform-specific best practices, and industry benchmarks.