


Features
- 4 Unique slides
- Fully editable and easy to edit in Microsoft Powerpoint, Keynote and Google Slides
- 16:9 widescreen layout
- Clean and professional designs
- Export to JPG, PDF or send by email


Do you have any questions?
Recommend


6 slides
Three-Part Comparative Venn Layout Presentation
Showcase relationships, overlaps, and distinctions across three core elements with this elegant petal-style Venn layout. Perfect for comparing strategies, audiences, or product features. Each section includes customizable labels and icons. Fully editable in PowerPoint, Keynote, and Google Slides—ideal for business analysis, educational presentations, and marketing plans.


10 slides
Market Positioning Competitive Analysis
Visually assess your brand’s position in the market with this quadrant-based layout designed for strategic clarity. This slide helps showcase key comparisons across marketing analysis, target audience alignment, unique value proposition, and messaging consistency. Fully editable in PowerPoint, Keynote, and Google Slides.


3 slides
Ishikawa Diagram Template Presentation
Bring clarity to complex challenges with a clean, structured visual that helps teams trace issues back to their true causes. This presentation outlines key factors, organizes insights, and supports decision-making with an intuitive, step-by-step layout. Ideal for problem-solving sessions and strategy workshops. Fully compatible with PowerPoint, Keynote, and Google Slides.


5 slides
IT Service Operations Strategy Presentation
Streamline your IT presentations with the IT Service Operations Strategy Presentation template. This structured layout is designed to showcase key service operation metrics, strategies, and performance indicators in a visually engaging format. Ideal for IT teams, service managers, and business analysts, this slide helps simplify complex IT processes with clear data points and percentages. Fully customizable in PowerPoint, Keynote, and Google Slides for effortless adaptation to your needs.


7 slides
Concentric Circle Diagrams Infographic Presentation Template
Concentric Circle Diagrams can display interrelated and independent units of a concept in overlapping circular designs. The diagram is really helpful for organizing information, displaying relationships among concepts, showing whole-part relationships and more. It uses overlapping circular designs to display ideas and separate them with their own size, color and position on a chart. This template contains a variety of circular diagram that display in overlapping different-shaded circles. This template can be used to demonstrate the relationship of all elements to the central idea.


6 slides
Root Cause Analysis Tools Infographics
Uncover the root causes of issues effectively with our Root Cause Analysis Tools infographic template. This template is fully compatible with popular presentation software like PowerPoint, Keynote, and Google Slides, allowing you to easily customize it to analyze and address complex problems. The Root Cause Analysis Tools infographic template provides a visually engaging platform to showcase various methods and techniques for identifying and mitigating root causes. Whether you're a quality assurance professional, project manager, or problem-solving enthusiast, this template offers a user-friendly canvas to create informative presentations and strategies for root cause analysis. Improve your problem-solving capabilities with this SEO-optimized Root Cause Analysis Tools infographic template, thoughtfully designed for clarity and ease of use. Customize it to highlight the tools and methodologies best suited to your specific challenges, ensuring you can effectively address issues at their core. Start crafting your personalized infographic today to enhance your root cause analysis skills.


21 slides
Thistledown Marketing Campaign Presentation
Elevate your marketing campaigns with this polished and professional presentation template. Perfectly tailored to showcase key components such as campaign objectives, target audience, and competitive landscape, it provides a cohesive structure for presenting your strategies effectively. The slides also include sections for financial highlights, unique selling proposition, and growth planning, ensuring your goals are communicated with clarity. Whether you're discussing market presence, service offerings, or team leadership, this template helps streamline your content. Fully editable in PowerPoint, Google Slides, and Keynote, it offers flexibility to align with your branding and deliver a compelling campaign presentation.


22 slides
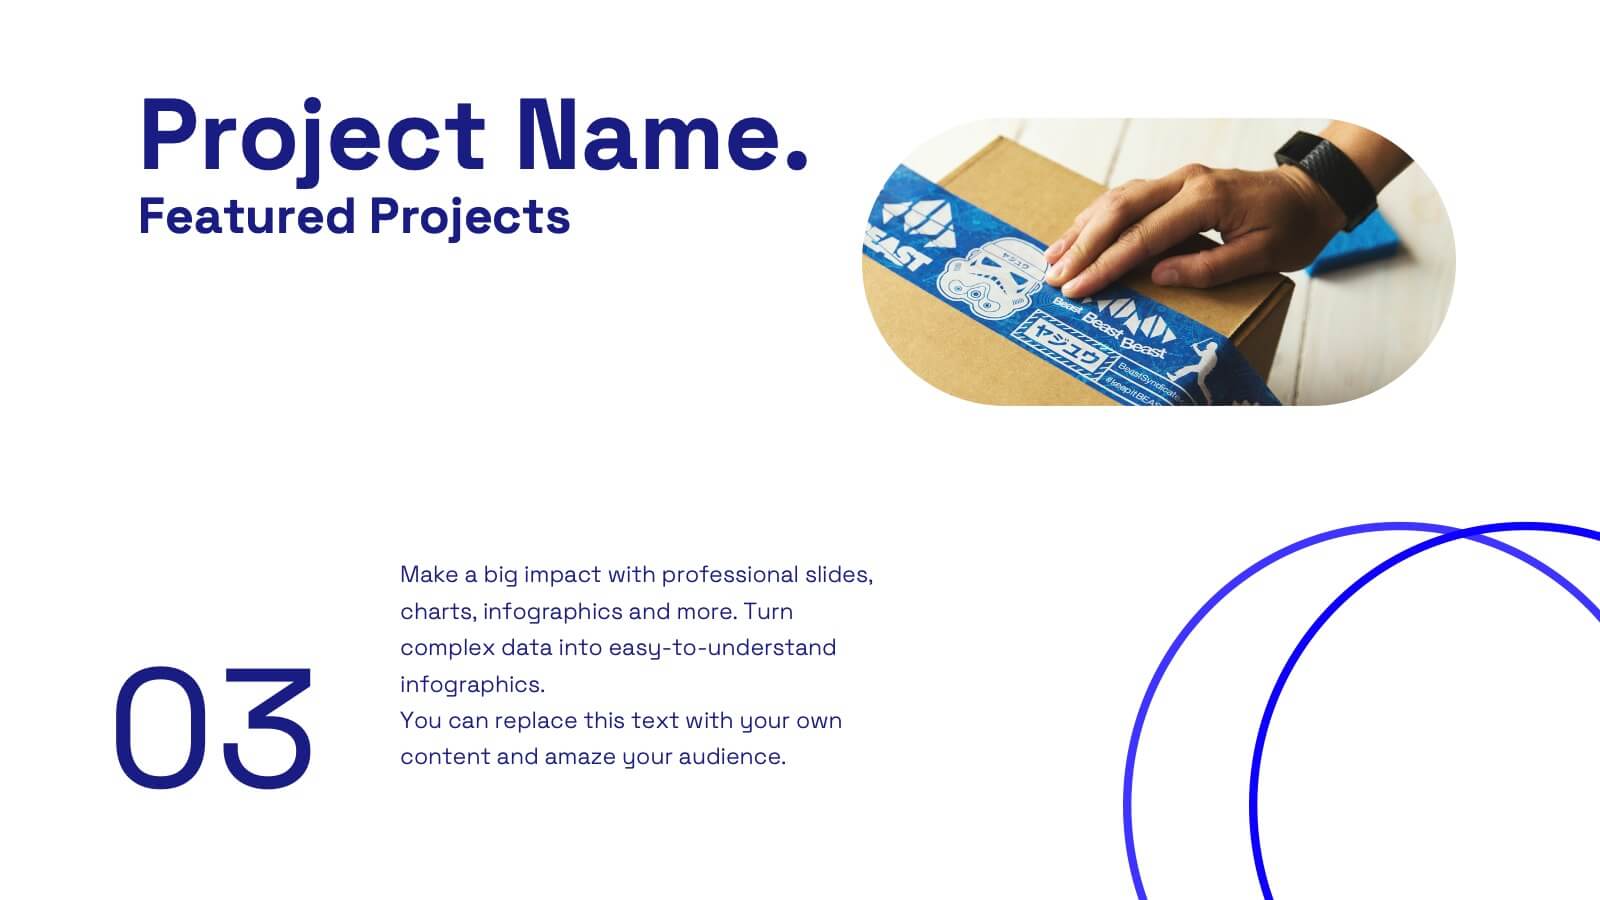
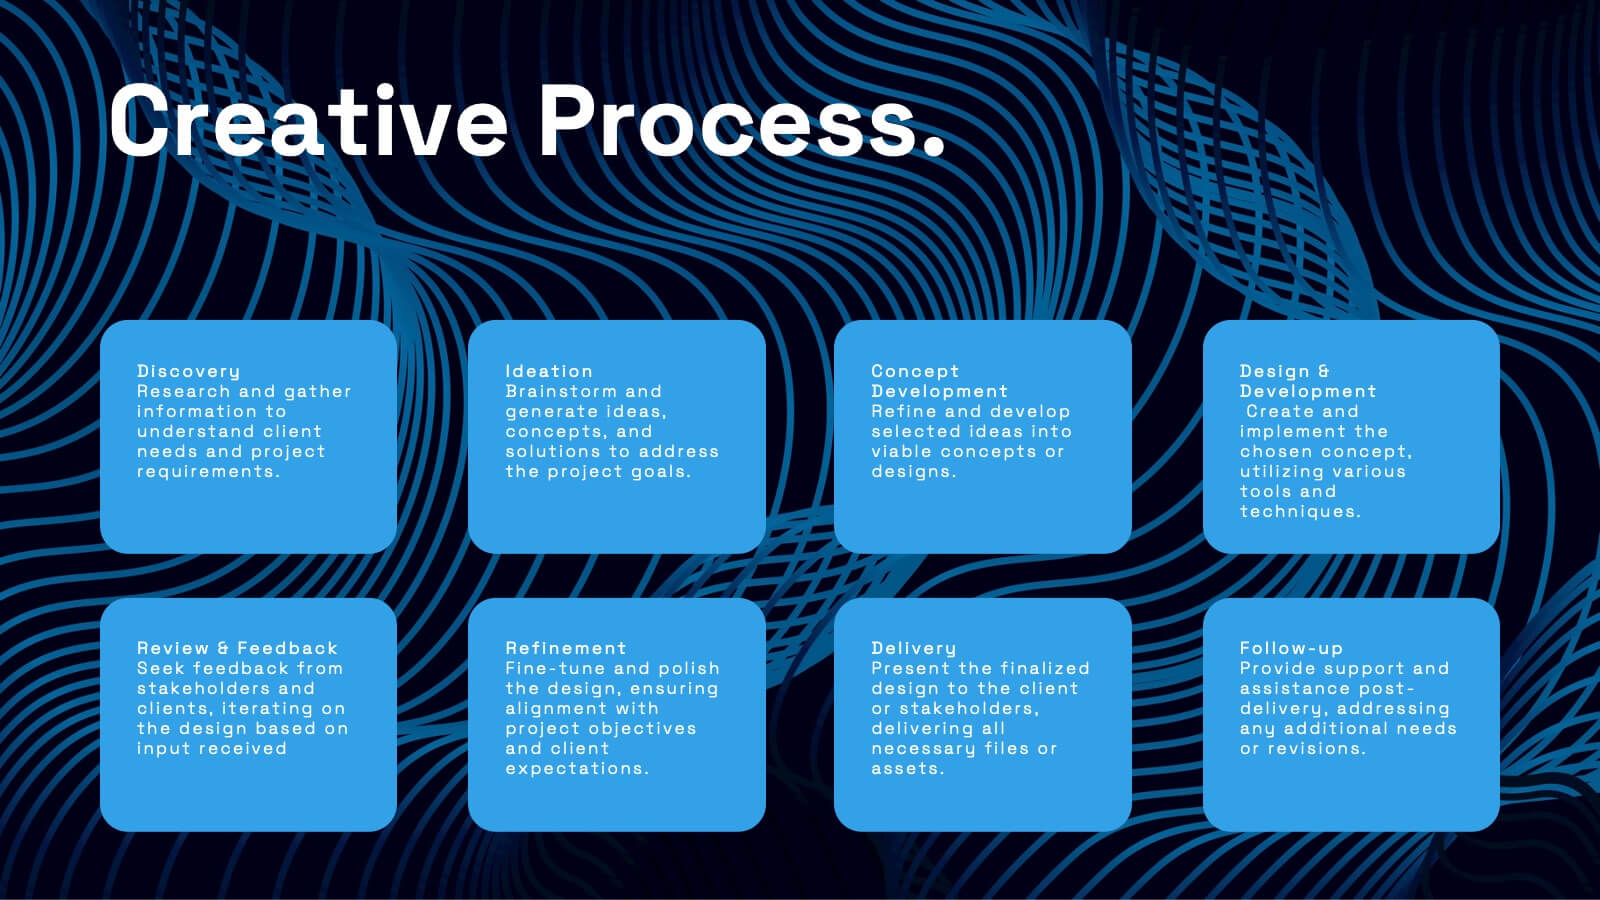
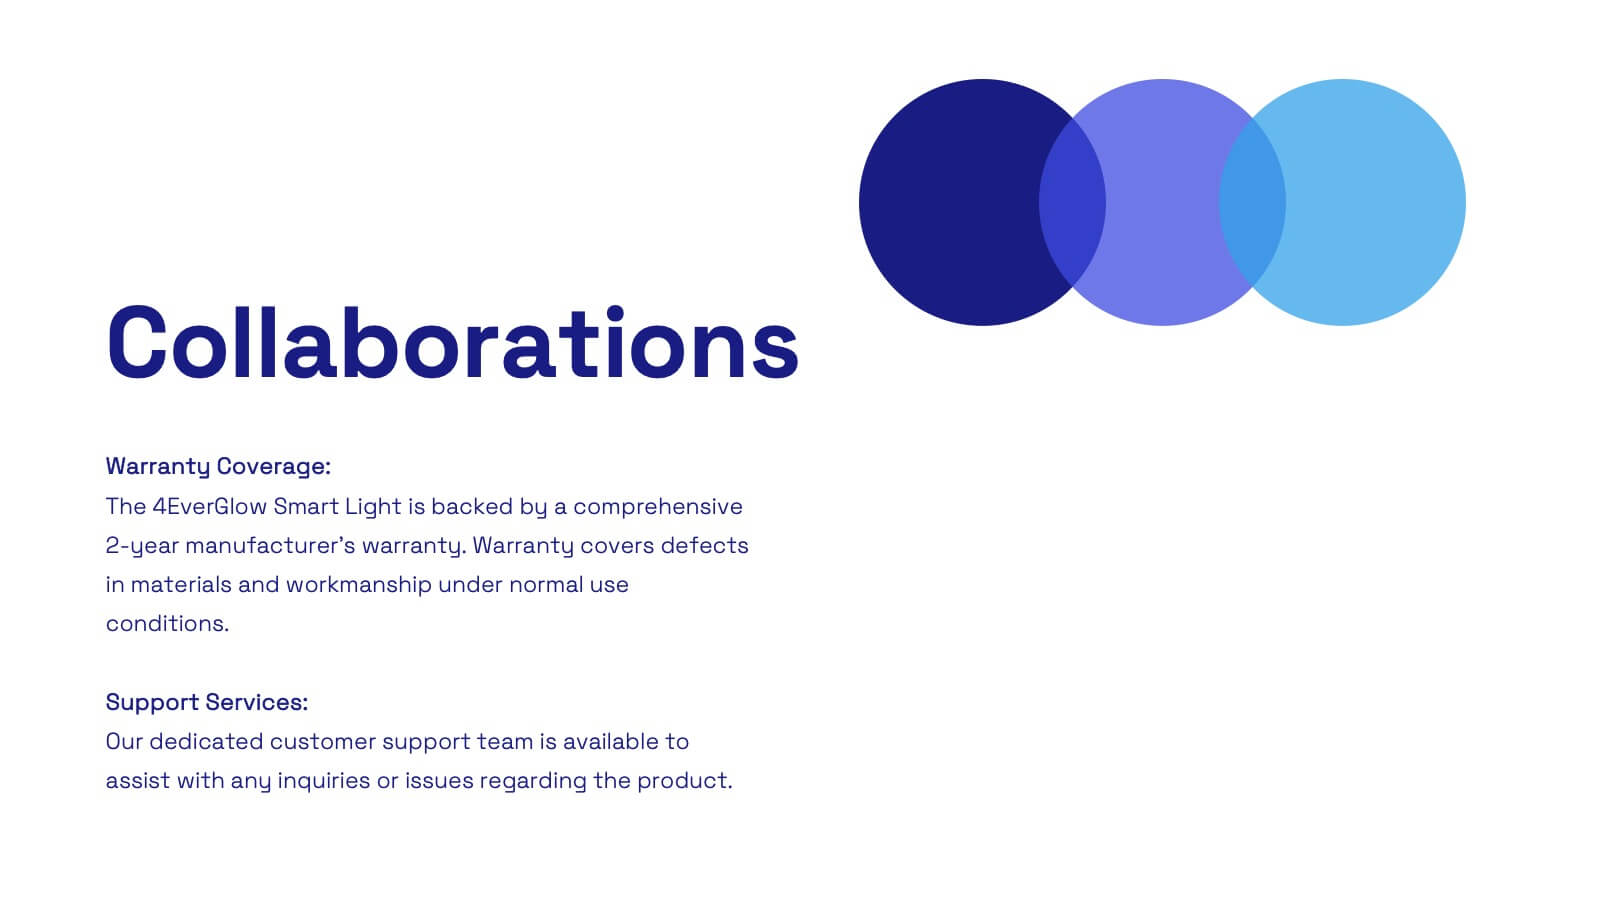
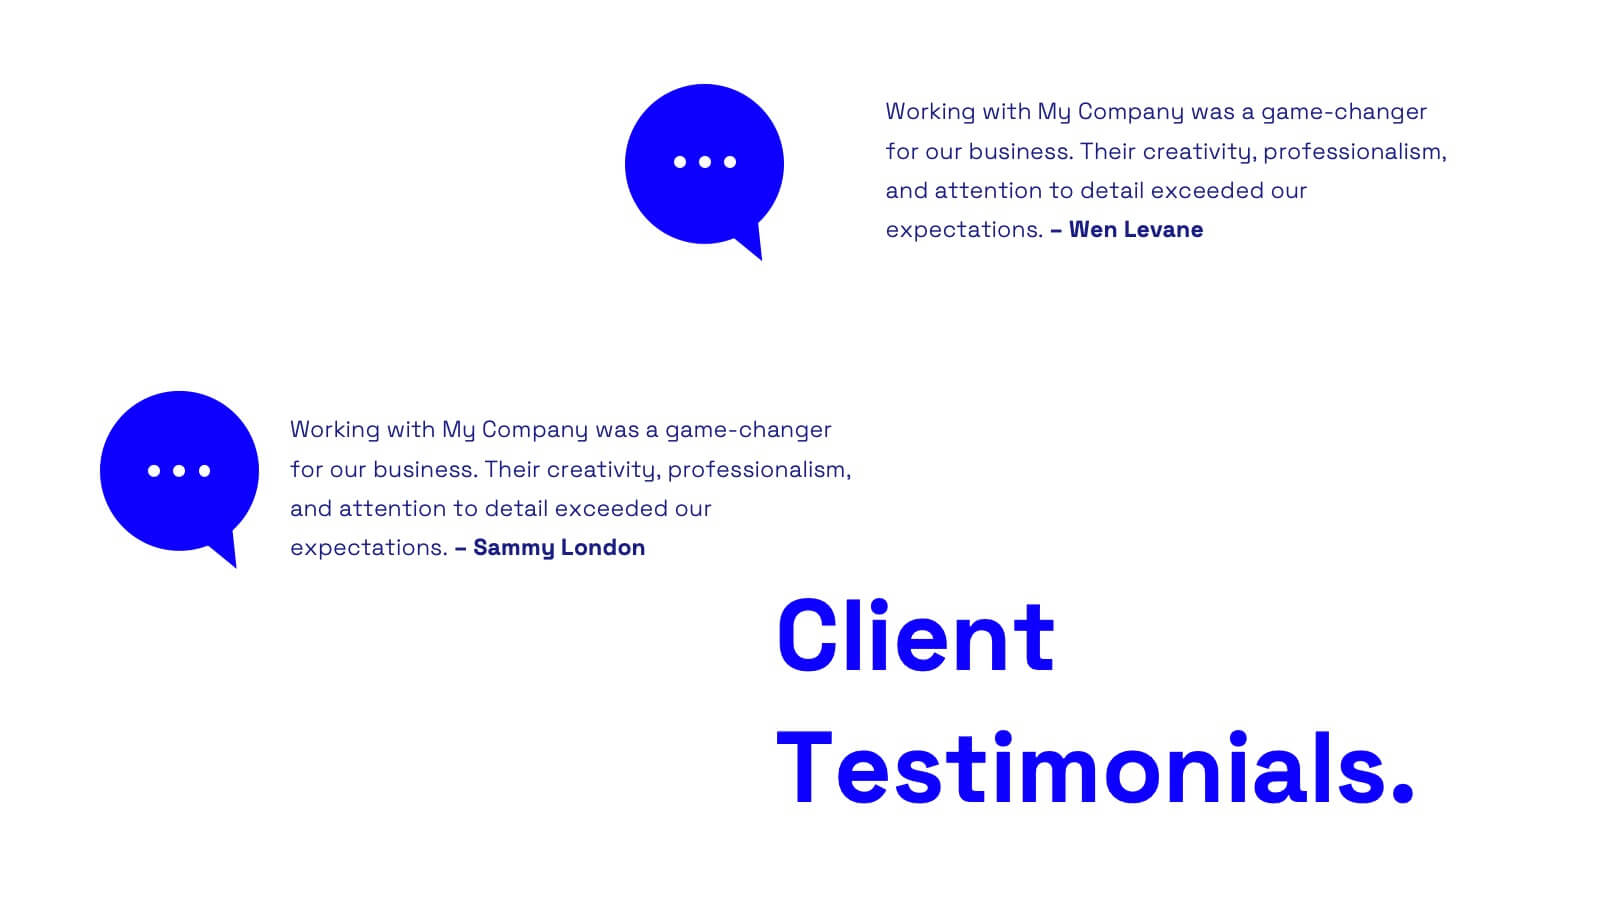
Wanderer Professional Portfolio Showcase Presentation
Showcase your creative work with this sleek, modern portfolio template. Perfect for highlighting your projects, philosophy, and client testimonials, it features a professional design with a dynamic layout. Display your awards, services offered, and pricing clearly to impress potential clients. Compatible with PowerPoint, Keynote, and Google Slides, it ensures seamless presentations on any platform.


7 slides
North America Political Map Infographic
This North America Political Map infographic template provides a visual representation of various data points across the continent. It is compatible with PowerPoint, Google Slides, and Keynote, making it versatile for different presentation platforms. The template includes different styles of maps and charts, such as population statistics, demographic data, and economic indicators. Color-coded for easy interpretation, it allows presenters to highlight specific regions and data with clarity. The design is clean and professional, with icons and graph elements that enhance the presentation of geographical and statistical information.


5 slides
Visual Decision-Making with Harvey Balls Presentation
Simplify complex evaluations with this Harvey Ball comparison chart. Ideal for product comparisons, feature assessments, or decision-making matrices, this slide presents up to 6 items and 4 features with intuitive visual cues. Fully editable in PowerPoint, Keynote, or Google Slides, it’s perfect for business, marketing, and strategy teams seeking clear and compelling insights.


7 slides
Compliance Gap Analysis Infographic
Navigate the complexities of organizational compliance with our compliance gap analysis infographic. Using a vibrant palette of orange, white, and green, this infographic elucidates the differences between current compliance practices and desired standards. Specifically designed for business analysts, compliance officers, and risk managers, this template is an invaluable tool to identify, analyze, and bridge compliance-related gaps. With its fun yet informative style, communicating these insights becomes more engaging and understandable. This infographic is ready for integration with PowerPoint, Keynote, and Google Slides, ensuring smooth presentations across various platforms.


7 slides
Company Profile Structure Infographic
This series of templates is meticulously crafted to represent a company’s structure in a detailed and organized manner. Each template varies in design and layout, ensuring that there is a style to suit different business needs and preferences. From straightforward, clean layouts to more dynamic, visually engaging designs, these templates provide an excellent basis for companies to present their organizational structure, core team members, departmental divisions, and key business areas effectively. Key information such as company values, mission statements, and strategic objectives can be clearly highlighted, allowing companies to communicate their business essence and operational ethos to stakeholders. Each template also accommodates data visualization through charts, graphs, and infographics, which are instrumental in depicting growth trajectories, performance metrics, or demographic breakdowns. With customization options, these templates can be tailored to reflect a company's unique brand identity, including color schemes, typography, and corporate logos, making each presentation not only informative but also reflective of the company's image. This collection is ideal for corporate introductions, stakeholder meetings, and internal presentations aimed at fostering a clear understanding of the company’s operational framework and strategic direction.


5 slides
Hierarchical Structure in Triangle Format Presentation
Clearly illustrate levels of authority or stages of growth with the Hierarchical Structure in Triangle Format Presentation. This layout features a visually stacked triangle with color-coded segments, each layer representing a tier or level of information. Ideal for organizational charts, value pyramids, or priority structures. Each section includes a title, icon, and description area to keep your message clear and impactful. Fully editable in PowerPoint, Keynote, and Google Slides.


5 slides
SWOT Matrix Diagram Presentation
Showcase key business insights with this SWOT Matrix Diagram Presentation. This clear 4-quadrant layout helps visualize your organization's Strengths, Weaknesses, Opportunities, and Threats, making it ideal for strategic planning, competitor analysis, or internal reviews. Each section includes icons and editable text placeholders for easy customization. Fully compatible with PowerPoint, Keynote, and Google Slides.


5 slides
Team and Client Feedback Collection Strategy
Gather actionable insights with the Team and Client Feedback Collection Strategy Presentation. This slide layout uses a balanced circular and rating-star design to showcase four core feedback sources—ideal for presenting survey outcomes, satisfaction metrics, and review strategies. Fully editable in PowerPoint, Keynote, and Google Slides.


5 slides
Corporate Skills Training Program Presentation
Elevate corporate capability with the 'Corporate Skills Training Program' template, ideal for detailing strategic workforce development. It's crafted for organizations aiming to enhance employee competencies and performance metrics. This template is compatible with PowerPoint, Keynote, and Google Slides, ensuring adaptability across various presentation platforms.


15 slides
Business Journal Infographic
A Business Journal Infographic is a visual representation of data, information, or concepts related to business topics that typically follow the style and format often found in business journals or publications. This infographic is designed to present complex information quickly and clearly. The purpose of this is to convey information in a visually engaging and easily digestible format, making it easier for readers to grasp complex business concepts or data. With this template transform your business narrative into a captivating visual story that not only informs but inspires readers to delve into the world of entrepreneurship.