


Features
- 5 Unique slides
- Fully editable and easy to edit in Microsoft Powerpoint, Keynote and Google Slides
- 16:9 widescreen layout
- Clean and professional designs
- Export to JPG, PDF or send by email


Do you have any questions?
Recommend


26 slides
Warm Tones Real Estate Presentation
Create an engaging and inviting Warm Tone Real Estate presentation with this easy to use template. The color scheme of this welcoming template features warm tones to set the mood for a peaceful, natural environment. The cover slide features emerald green and brown, while the next two slides use warmer brown, tan shades, keeping the same theme going. Fully customizable, this template is ready to help you sell and promote properties quickly and easily. This layout is perfect for showcasing properties with a premium feel that’ll inspire confidence in both buyers and sellers alike.

21 slides
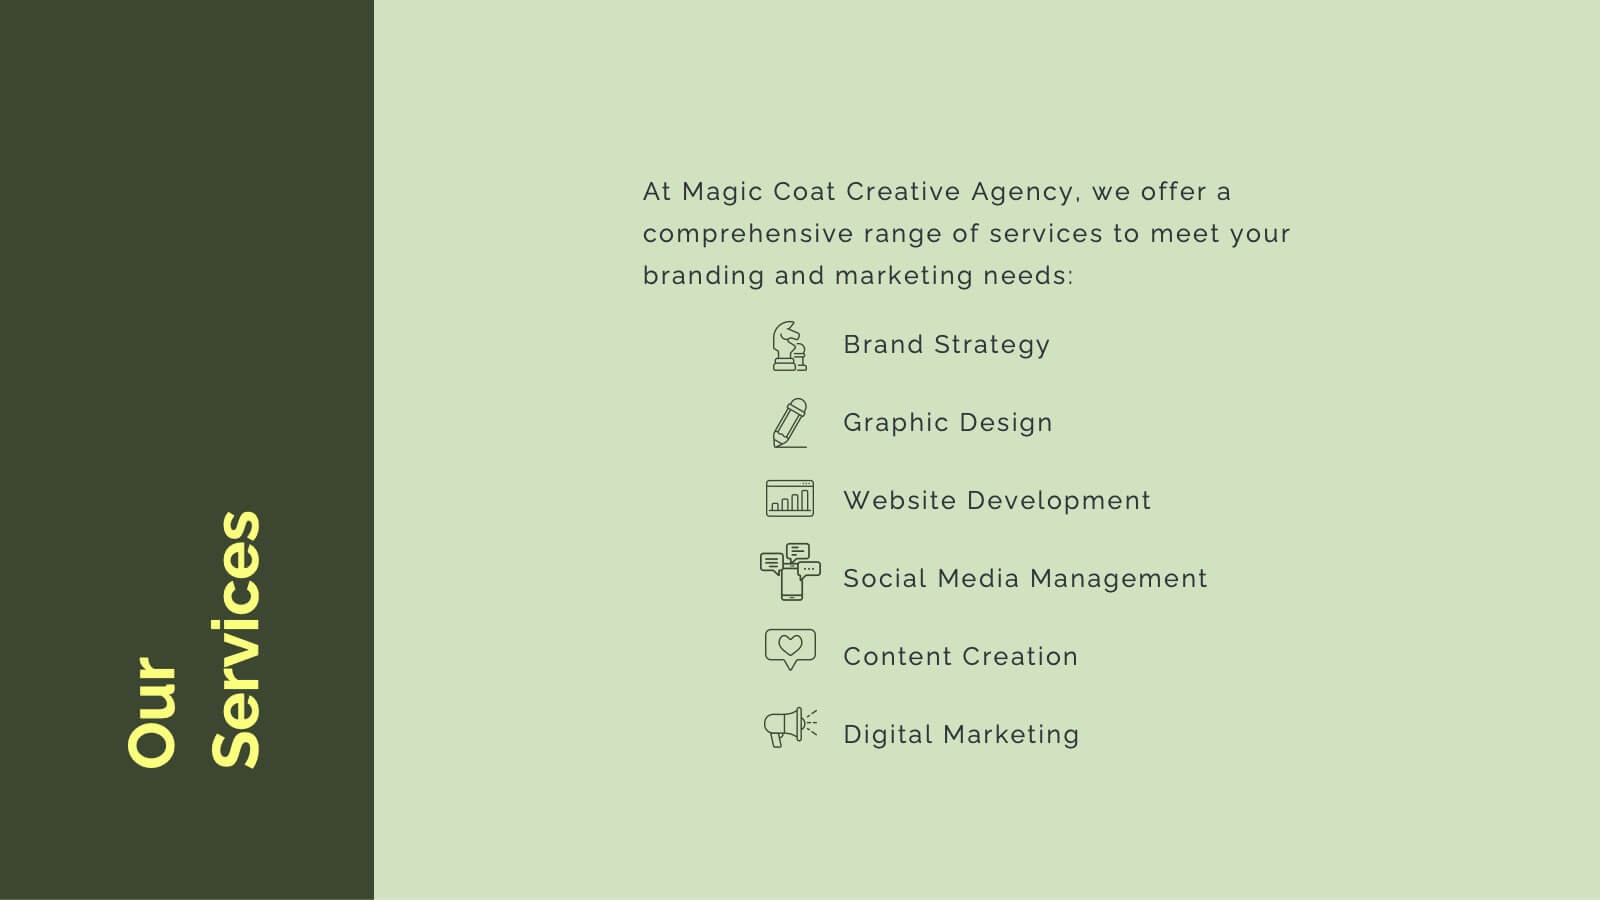
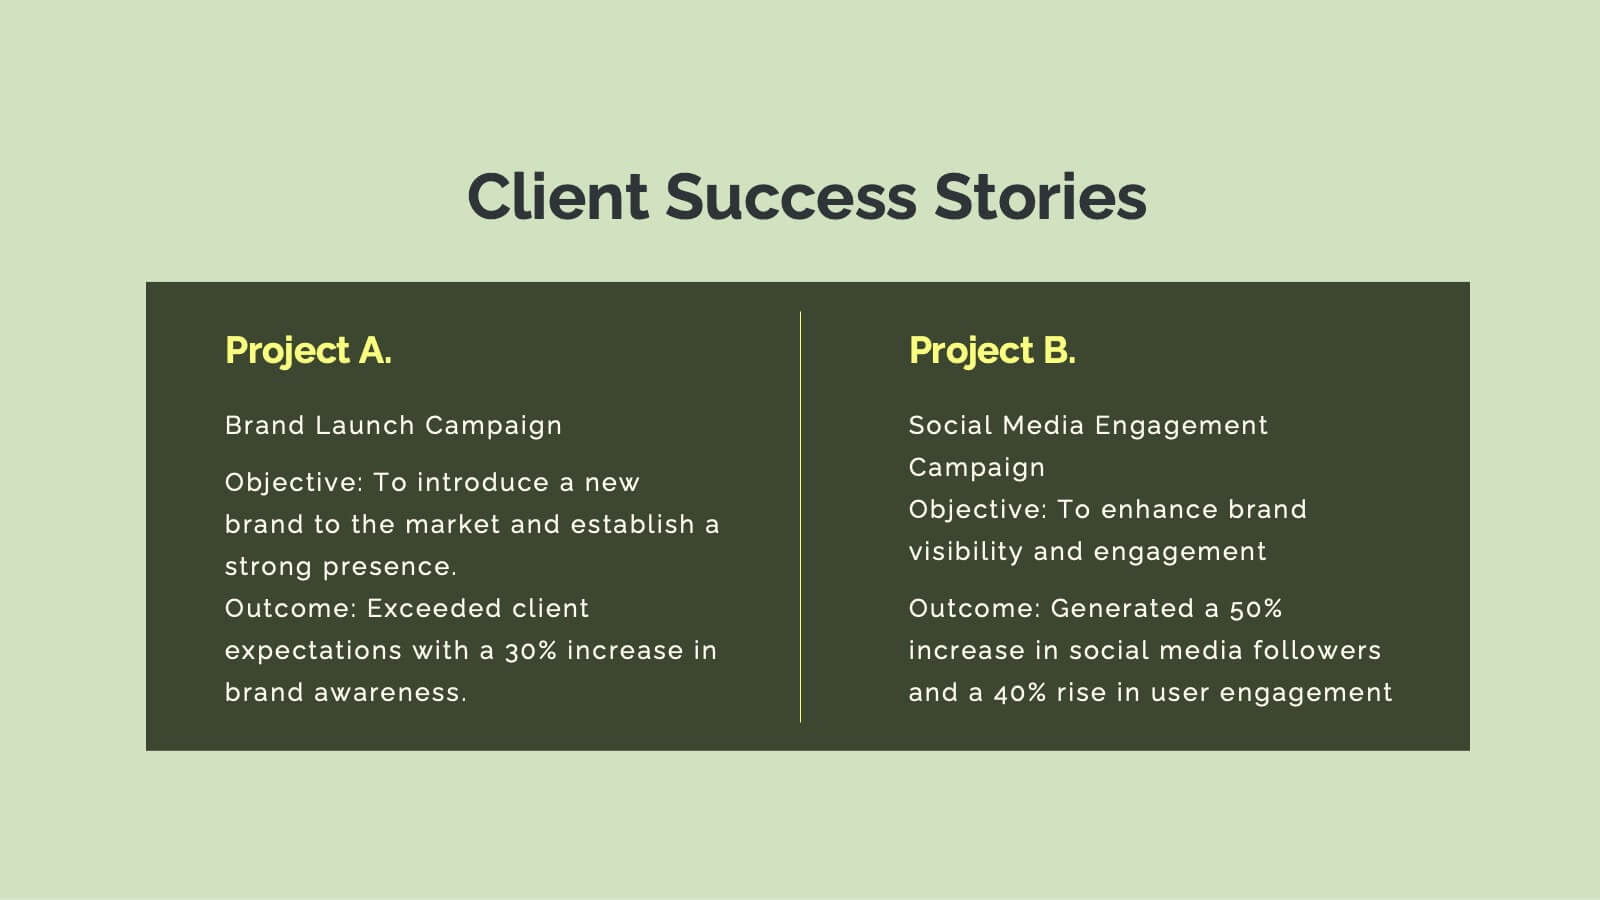
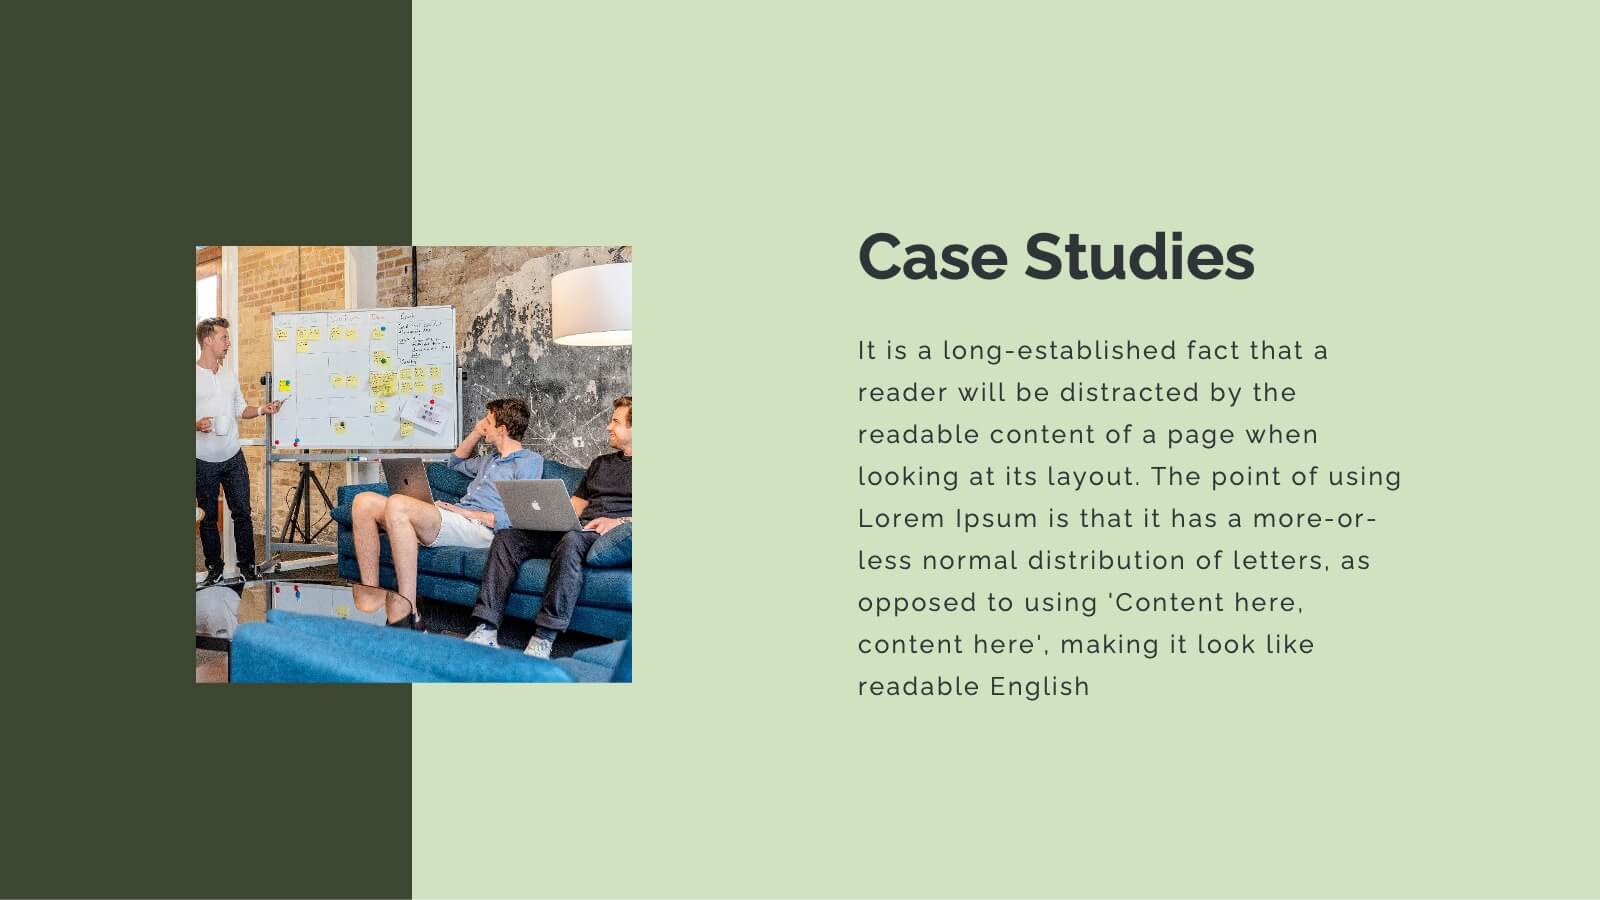
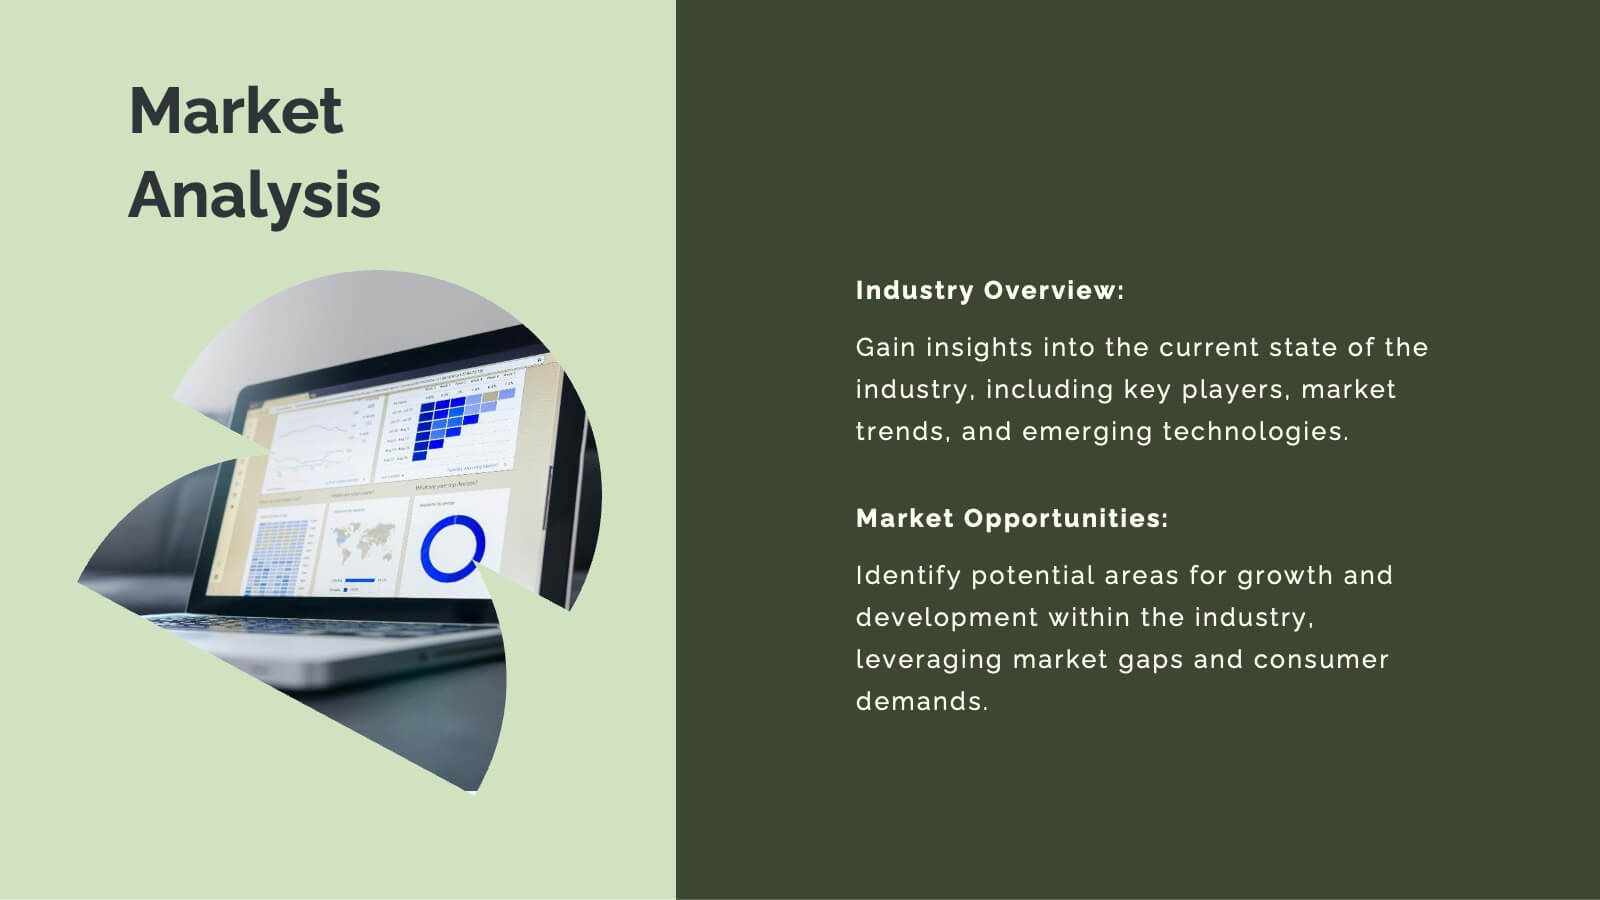
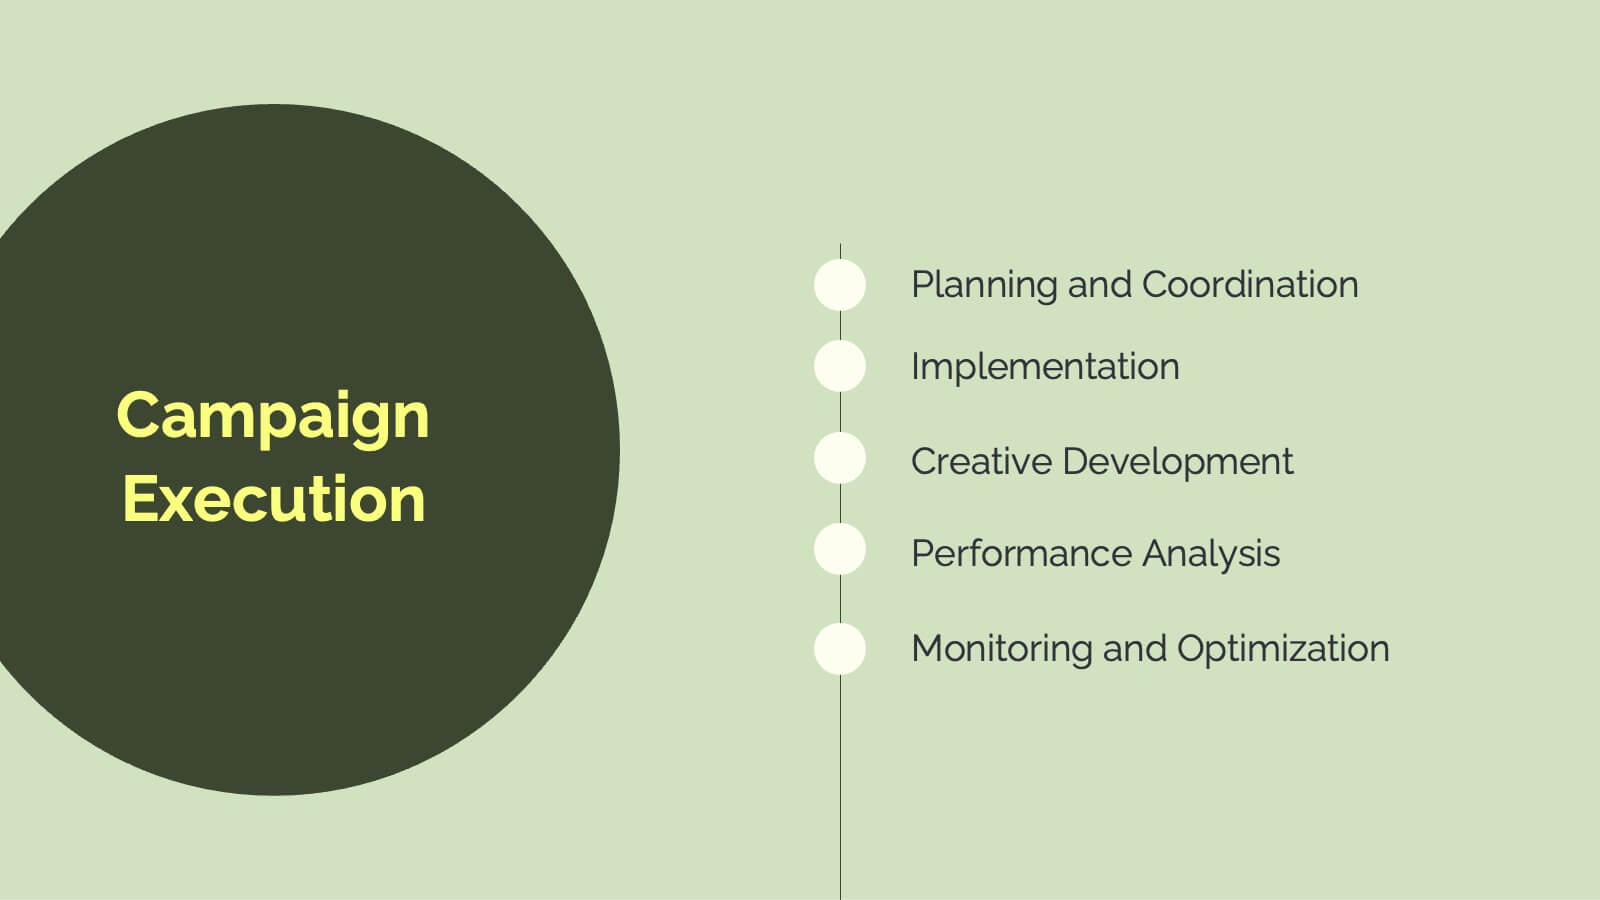
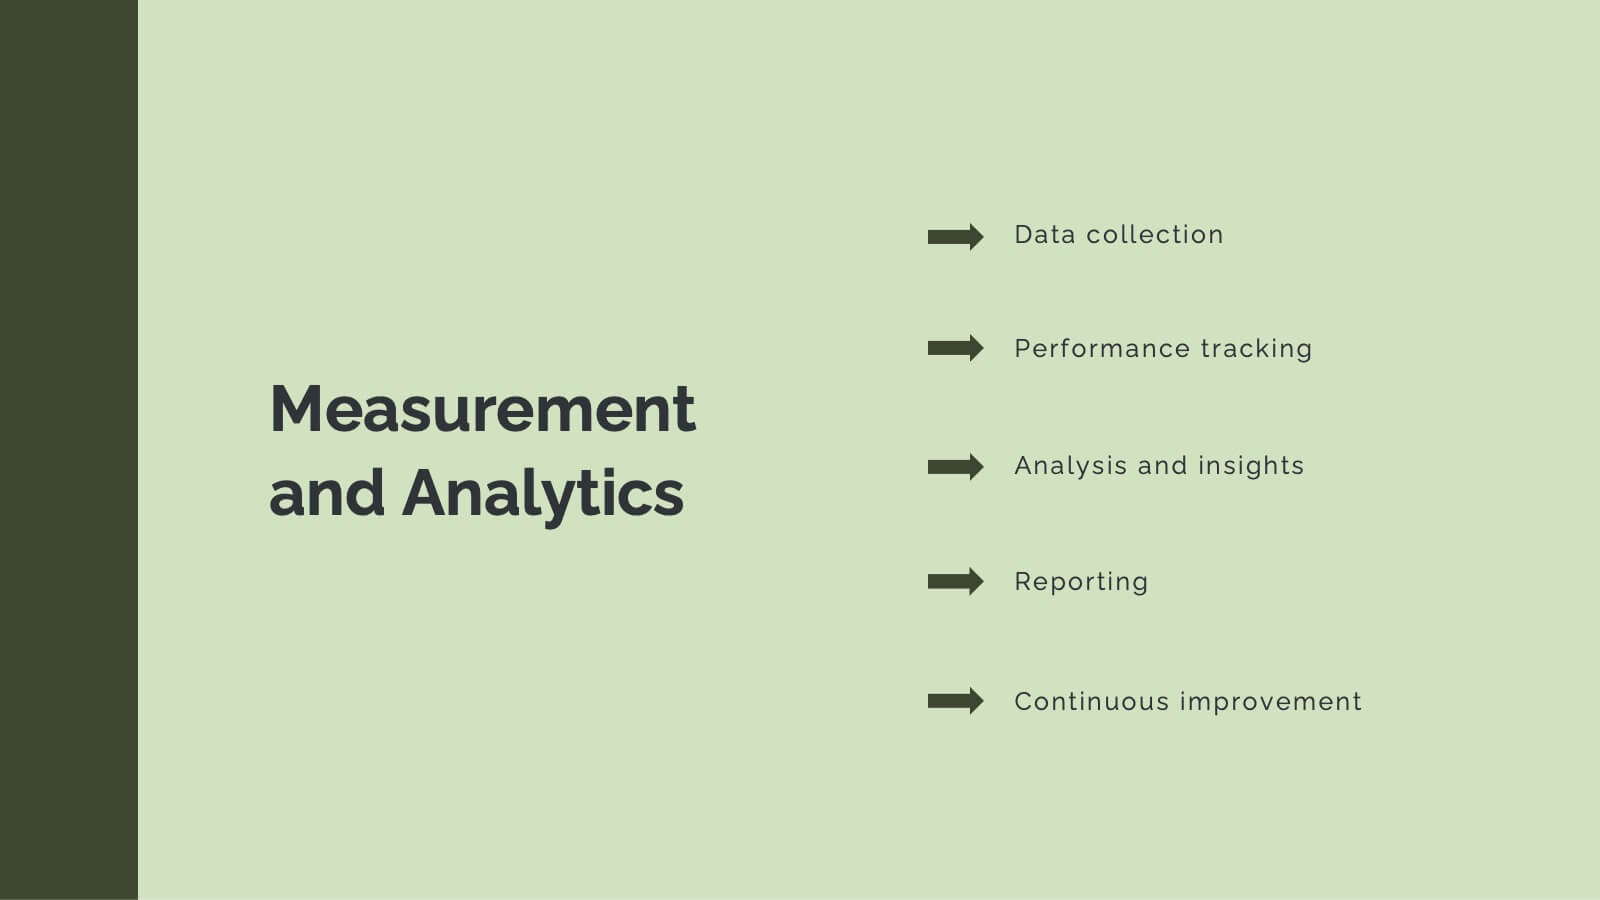
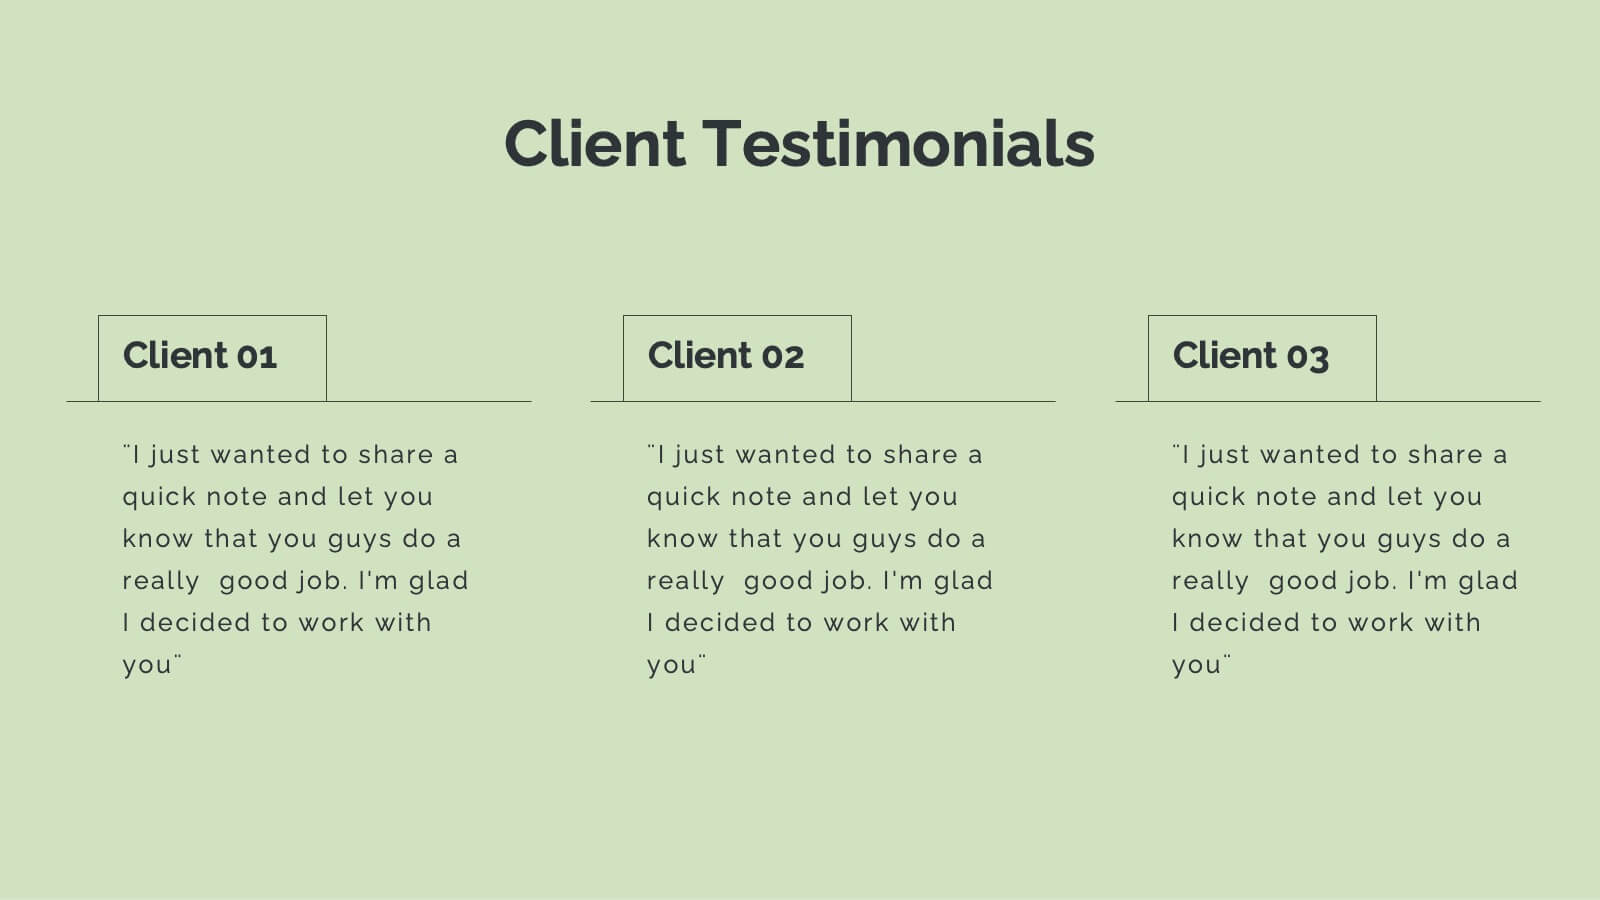
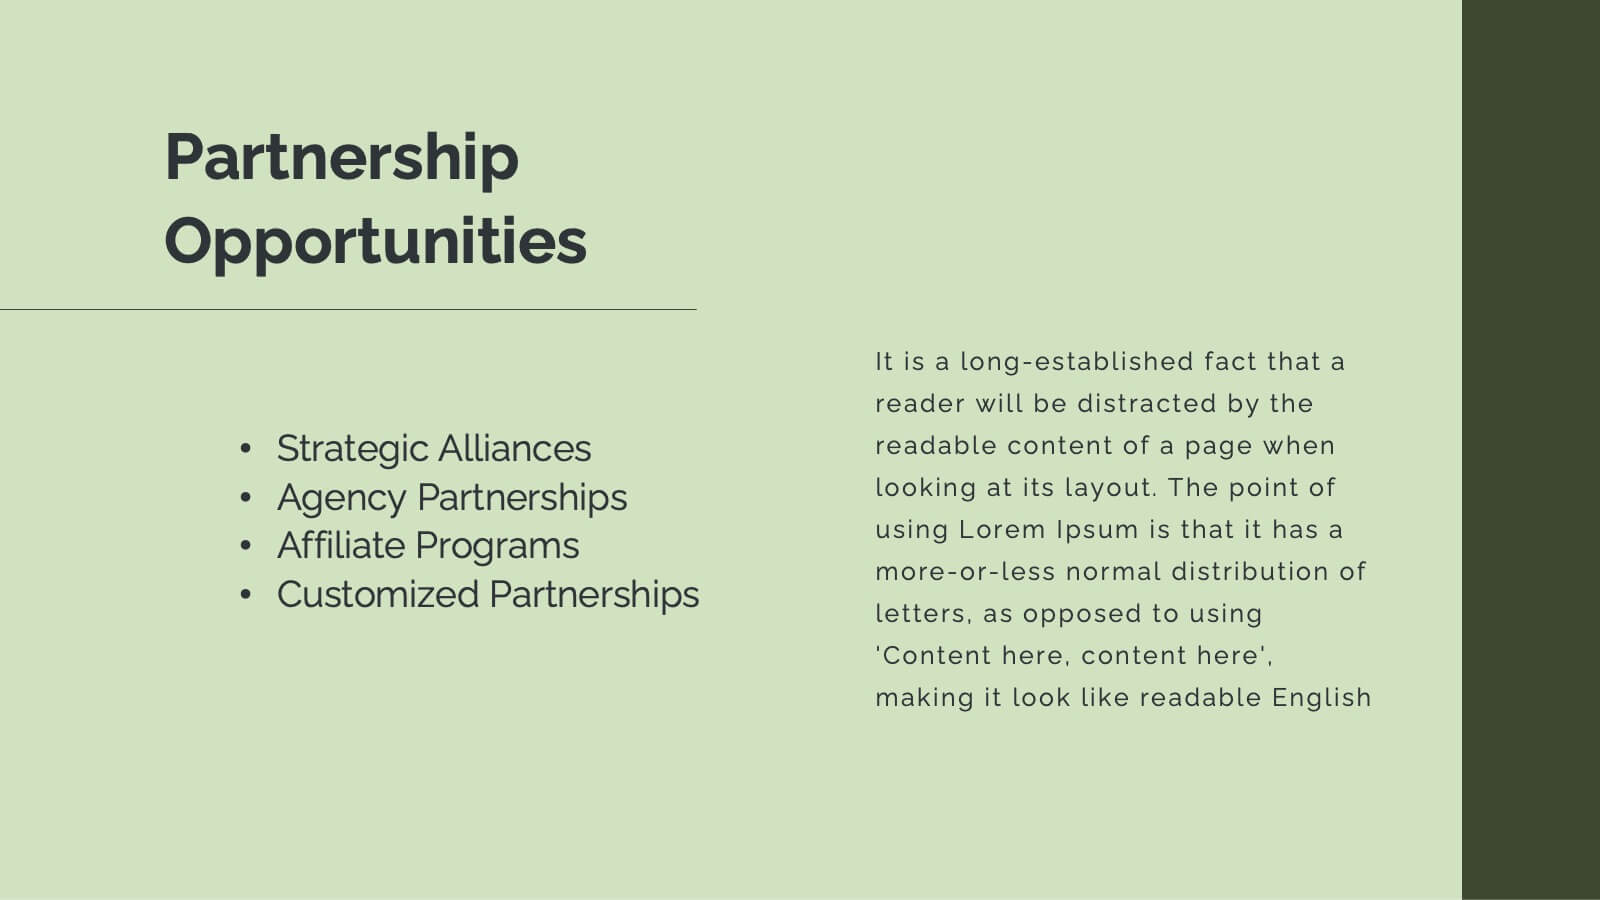
Horizon Advertising Agency Proposal Presentation
Elevate your advertising impact with this comprehensive agency proposal template. It’s meticulously designed to showcase your agency’s capabilities from strategic planning to creative execution, ensuring a persuasive presentation of services like market analysis, campaign strategies, and client success stories. Each slide is formatted to facilitate understanding and engagement, making it perfect for highlighting your team's expertise and unique approach. Compatible with major presentation platforms like PowerPoint, Google Slides, and Keynote, this template supports your efforts to secure new clients and projects seamlessly across various devices.


26 slides
Mazen Presentation Template
Mazen is a multi-purpose template that’s perfect for any business. The colors and layout are clean and chic, and it’s suitable for all types of businesses, from small business accounts to large corporate companies. It also has a hip aesthetic with nude warm tones, while pictures and charts are easy to edit and easy to read so users can easily understand the information in them. Easy to use, high quality and many features make this template suitable for all kinds of businesses. Pictures and charts are also made for easy editing as well as easy readability without too much confusion on reading.


5 slides
Demographic and Psychographic Segments Presentation
Break down your audience with clarity using the Demographic and Psychographic Segments Presentation. This slide is ideal for showcasing four key consumer dimensions through a centered circular layout and quadrant icons. Perfect for marketing campaigns, branding strategies, and audience targeting. Fully editable in Canva, PowerPoint, Keynote, or Google Slides.


6 slides
Process Flow Charts Presentation
Bring your workflow to life with a clean, modern layout that transforms complex steps into a simple visual path. This presentation helps teams explain processes, percentages, and progress with clarity and ease, making it ideal for planning and optimization. Fully compatible with PowerPoint, Keynote, and Google Slides.


5 slides
Porter's Five Forces Competitive Analysis Presentation
Illustrate market dynamics and industry competitiveness using Porter’s Five Forces. This template covers New Entrants, Buyer Power, Supplier Power, Substitutes, and Customer Power in a clean, letter-coded format. Fully editable in PowerPoint, Keynote, and Google Slides, it's perfect for strategic analysis and investor presentations. Clear, structured, and easy to customize.


26 slides
Coffee Shop Simple Presentation
Perk up your presentation with this Coffee Shop template, brimming with the energy of a bustling café. It’s the perfect blend for baristas, café owners, or anyone presenting on the coffee industry. The design features rich, warm colors and images that evoke the cozy ambiance of a coffee shop. Introduce your team with 'Meet Our Team' slides, and discuss your menu or business strategies with the option slides. Utilize the 'Chart Slide' for sales figures or customer preferences, and map out your global coffee sources with the 'Asia Map Slide'. The 'Mobile Device Mockup' is ideal for demonstrating your café's app or online ordering system. Each slide is like a cup of your finest brew—crafted to energize and engage your audience. The 'Thank You' slide sends them off with the satisfaction of a well-spent coffee break. This template isn’t just a visual aid; it's an experience, inviting your audience to savor every detail of your coffee-centric venture.


7 slides
Matrix Diagram Infographic Presentation Template
A matrix diagram, also known as a matrix chart or matrix plot, is a type of chart that is used to compare and contrast different elements or variables. It is typically represented as a grid or table with rows and columns. This template will help show you how different things are related to each other. Use this template to compare and contrast things like products or tasks. It includes grids and tables that you can fill in with your own information. Add your own pictures and colors to make it look more appealing. This template is perfect for your school projects or work presentations.


7 slides
Agile Circle Methodology Infographic Presentation
Agile Methodology is a flexible and adaptive approach to project management that values customer satisfaction, teamwork, and continuous improvement. Our Agile Methodology template is perfect for academic or work presentation projects. This template is super easy to use and works with Powerpoint, Keynote, and Google Slides. It has a minimal design with, bright colors that will keep your audience engaged. With this template, you can learn all about Agile Methodology in a way that is visually appealing. Use this template to see how you and your team work more efficiently and effectively.


5 slides
Strategic HR Planning with Skills Gap Analysis Presentation
Supercharge your strategic HR planning with our 'Skills Gap Analysis' presentation template. This tool is designed to help you visualize and address the skills gaps within your organization efficiently. Engage your team with clear, data-driven insights that foster targeted development plans. Compatible with PowerPoint, Keynote, and Google Slides, it's the perfect addition to your HR toolkit.


3 slides
Financial Cost Management Strategies
Break down your financial action plan with the Financial Cost Management Strategies Presentation. Featuring a dynamic 3-step arc design, this template is ideal for illustrating cost-saving initiatives, expense control methods, or phased budget implementation strategies. Each curved step includes space for icons, step numbers, titles, and concise descriptions, making it easy to communicate each stage clearly. Fully editable in PowerPoint, Keynote, and Google Slides, it’s perfect for finance teams, consultants, or operations leaders.


7 slides
Business Funnel Infographic Presentation
A Funnel Infographic is used to help communicate the stages of a sales funnel in a transparent and visually appealing way. This is a marketing model that is used to track the journey from project to profit. This template includes a series of funnel-shaped graphics that represent the different stages of the sales funnel. You can customize this template with your own content, colors, and fonts to suit your specific needs. Add your own text to each stage of the funnel, and use the additional icons to represent each stage in more detail. Convey your marketing message with this Infographic!


21 slides
Drowsira Marketing Research Report Presentation
Present your market insights effectively with this professional and modern template. Covering key sections such as market presence, target audience, competitive landscape, and financial highlights, it offers a structured layout for impactful storytelling. Fully customizable and available for PowerPoint, Keynote, and Google Slides.


21 slides
Dewspire Project Management Plan Presentation
Streamline your project planning process with this visually striking and organized presentation template. Perfectly designed to communicate every stage of your project management, it features sections for problem analysis, objectives, and the scope of work. The timeline, budget breakdown, and resource allocation slides ensure your plans are both clear and actionable. Highlight team expertise with dedicated meet the team layouts and showcase your commitment to quality through evaluation criteria and risk management plans. Ideal for team presentations or client proposals, this template supports PowerPoint, Google Slides, and Keynote, offering full customization for seamless adaptability. Deliver your project vision with confidence and precision!


5 slides
Cybersecurity Risk Management Presentation
Simplify your security strategy with this clean, lock-themed visual. This layout organizes five key points with corresponding icons, perfect for presenting IT safeguards, data protection plans, or risk response actions. The vertical structure ensures clarity, while the design remains professional and editable in PowerPoint, Keynote, and Google Slides.


10 slides
Project Launch in 4 Structured Phases Presentation
Present your roadmap with clarity using this four-phase launch diagram. Designed for planning, strategy, or product rollout presentations, each step is illustrated in a 3D layered format with editable text sections. Fully customizable in PowerPoint, Keynote, and Google Slides—ideal for project managers and teams outlining sequential development or launches.


5 slides
AIDA Funnel for Marketing Strategy Presentation
This presentation template breaks down the AIDA model—Attention, Interest, Desire, Action—into a clean, engaging layout. Perfect for marketing strategies, campaign planning, or customer journey mapping. Easily customizable in Canva, it combines modern icons, bold typography, and horizontal flow to clearly visualize your marketing funnel in a compelling, structured format.