


Features
- 5 Unique slides
- Fully editable and easy to edit in Microsoft Powerpoint, Keynote and Google Slides
- 16:9 widescreen layout
- Clean and professional designs
- Export to JPG, PDF or send by email


Do you have any questions?
Recommend


8 slides
End of Presentation Thank You Slide
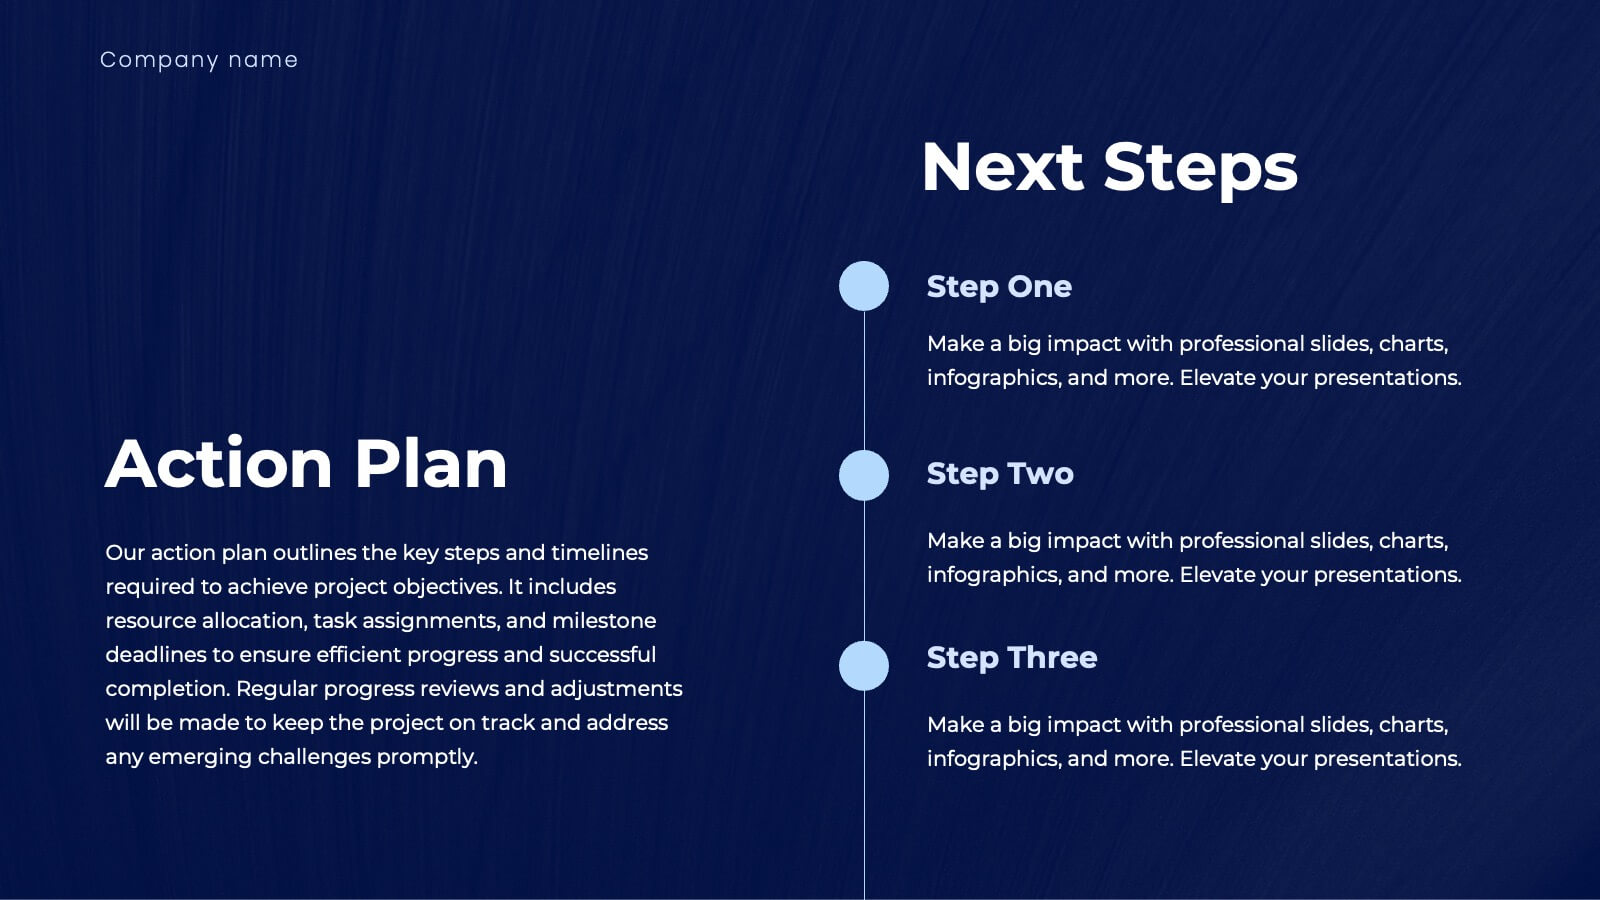
Wrap up your presentation with a bold, memorable finish using a vibrant layout that instantly grabs attention. This slide gives you space to share final notes, highlight next steps, or leave a lasting impression with clean, modern design. Fully editable and compatible with PowerPoint, Keynote, and Google Slides.


5 slides
Tips for Recycling Infographics
Recycling is an important practice that helps reduce waste, conserve resources, and protect the environment. These vertical infographics are designed to educate and encourage individuals on effective recycling practices. These provides a comprehensive overview of recycling and offers practical tips to help people incorporate recycling into their daily lives. This aims to educate and inspire individuals to take an active role in recycling and waste reduction. These are the perfect tools to raise awareness about waste management, and encourage sustainable behaviors. Compatible with Powerpoint, Keynote, and Google Slides.


4 slides
Business Milestone Roadmap Presentation
Visualize your company's journey with this curved-road milestone infographic. Perfect for tracking key goals, quarterly achievements, or strategic plans, this template uses clear markers along a winding path to emphasize progress and direction. Ideal for business updates, project timelines, or growth strategies. Fully editable in PowerPoint, Keynote, and Google Slides.


4 slides
Elegant Watercolor Background Presentation
Add a touch of sophistication to your presentation with soft watercolor textures that create a calming, professional atmosphere. Perfect for creative projects, proposals, or portfolios, this elegant design blends artistry with clarity. Fully compatible with PowerPoint, Keynote, and Google Slides for seamless customization and a refined visual finish.


26 slides
Jewelry Elegant Company Profile Presentation
Immerse yourself in the dazzling world of jewelry, where gems and craftsmanship create timeless elegance. Our template, exuding luxury in shades of brown and orange, embodies the modern elegance and aesthetic charm of fine jewelry. Enhanced with chic graphics, bespoke icons, and evocative image placeholders, it mirrors the allure of precious metals and stones. Seamlessly adapted for Powerpoint, Keynote, or Google Slides. A shimmering choice for jewelry brands, boutique owners, designers, or anyone seeking to showcase the sparkle and artistry of jewelry. Illuminate your brand; let each jewel tell its story.


12 slides
Digital Threat Prevention Framework Presentation
Make cybersecurity visuals as clear as your strategy. This digital threat prevention infographic template helps break down complex security frameworks into visually engaging and easy-to-follow steps. Great for showcasing layered defenses or network protocols. Fully customizable and works seamlessly with PowerPoint, Keynote, and Google Slides.


4 slides
Key Business Insights Executive Summary
Present your insights like a pro with this dynamic, timeline-inspired slide that makes key data points easy to follow. Designed to highlight four major takeaways or milestones, this visual format is ideal for summarizing business progress, strategy updates, or operational highlights. Fully editable in PowerPoint, Keynote, and Google Slides.

20 slides
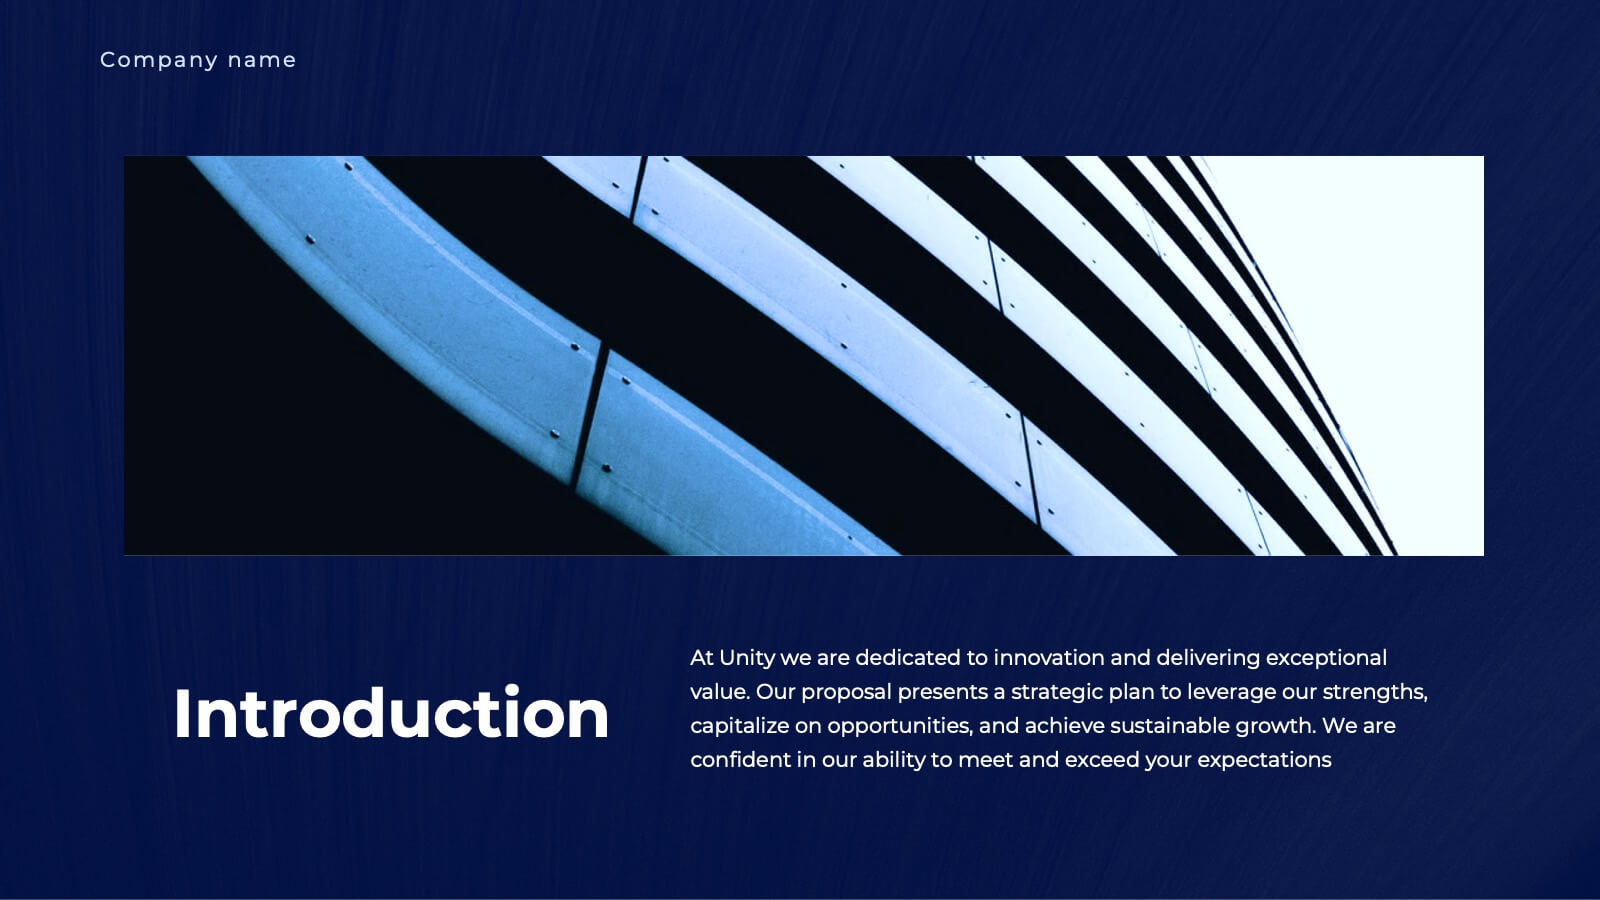
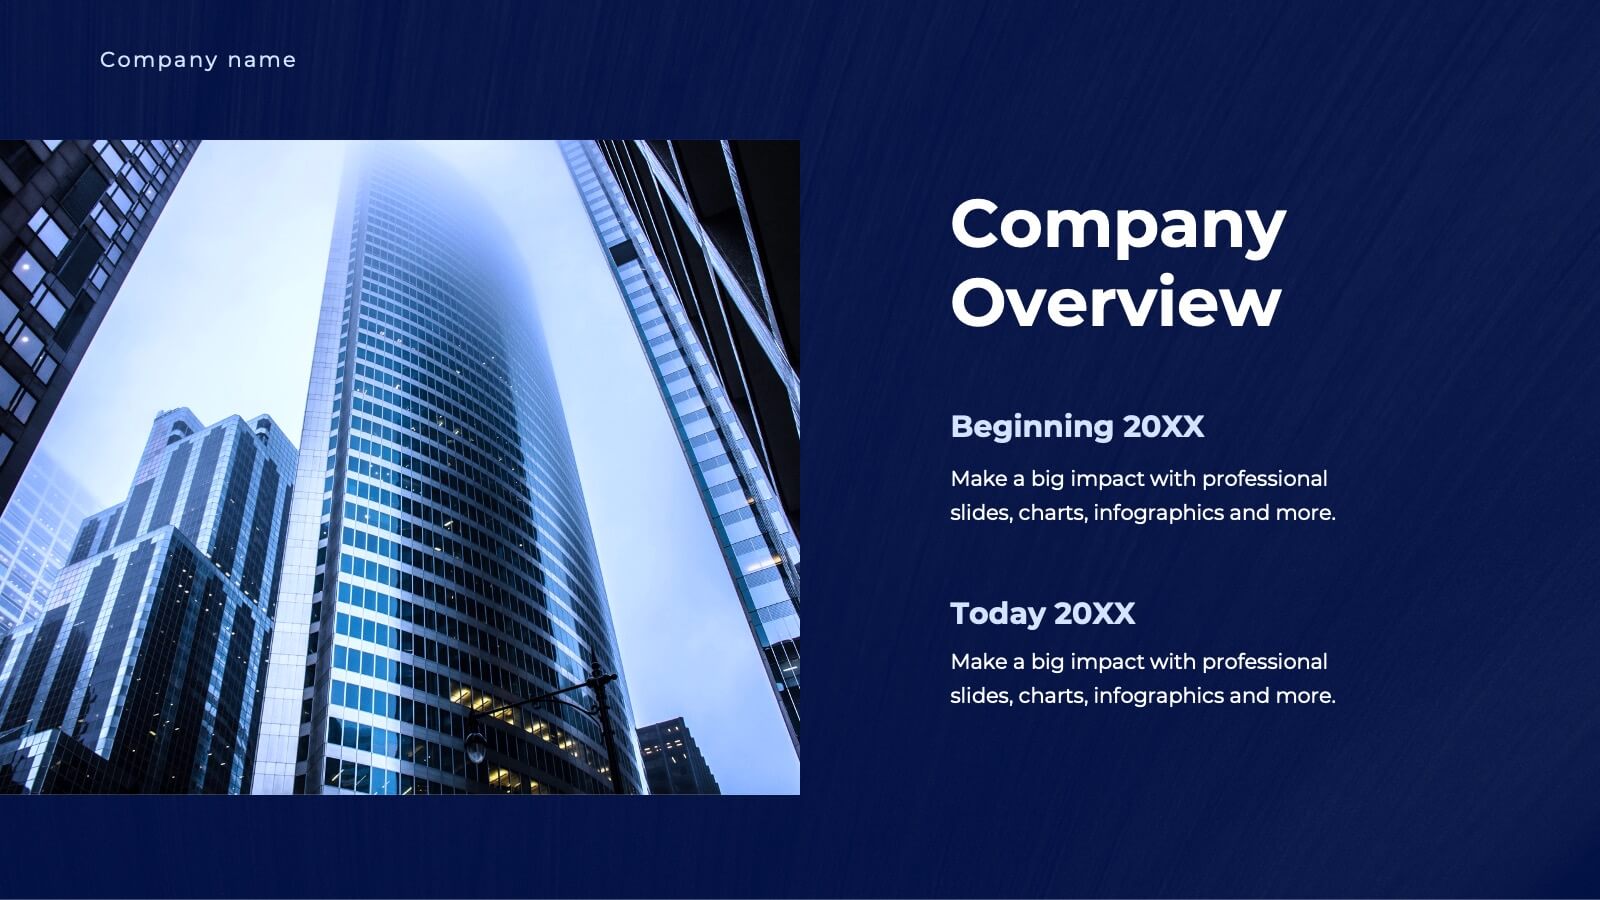
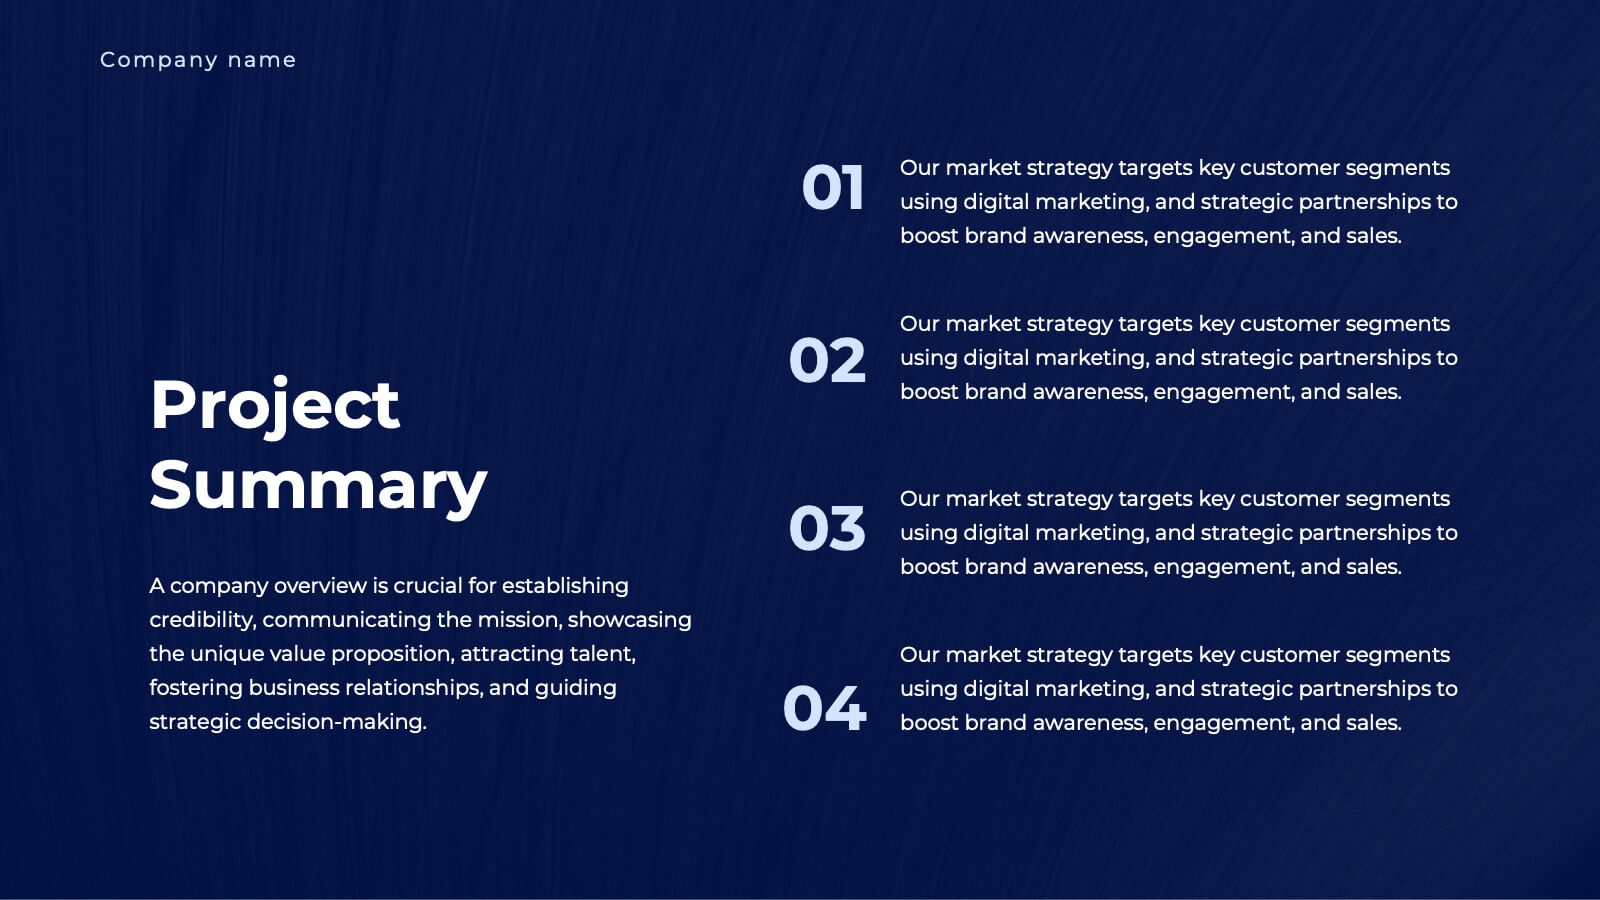
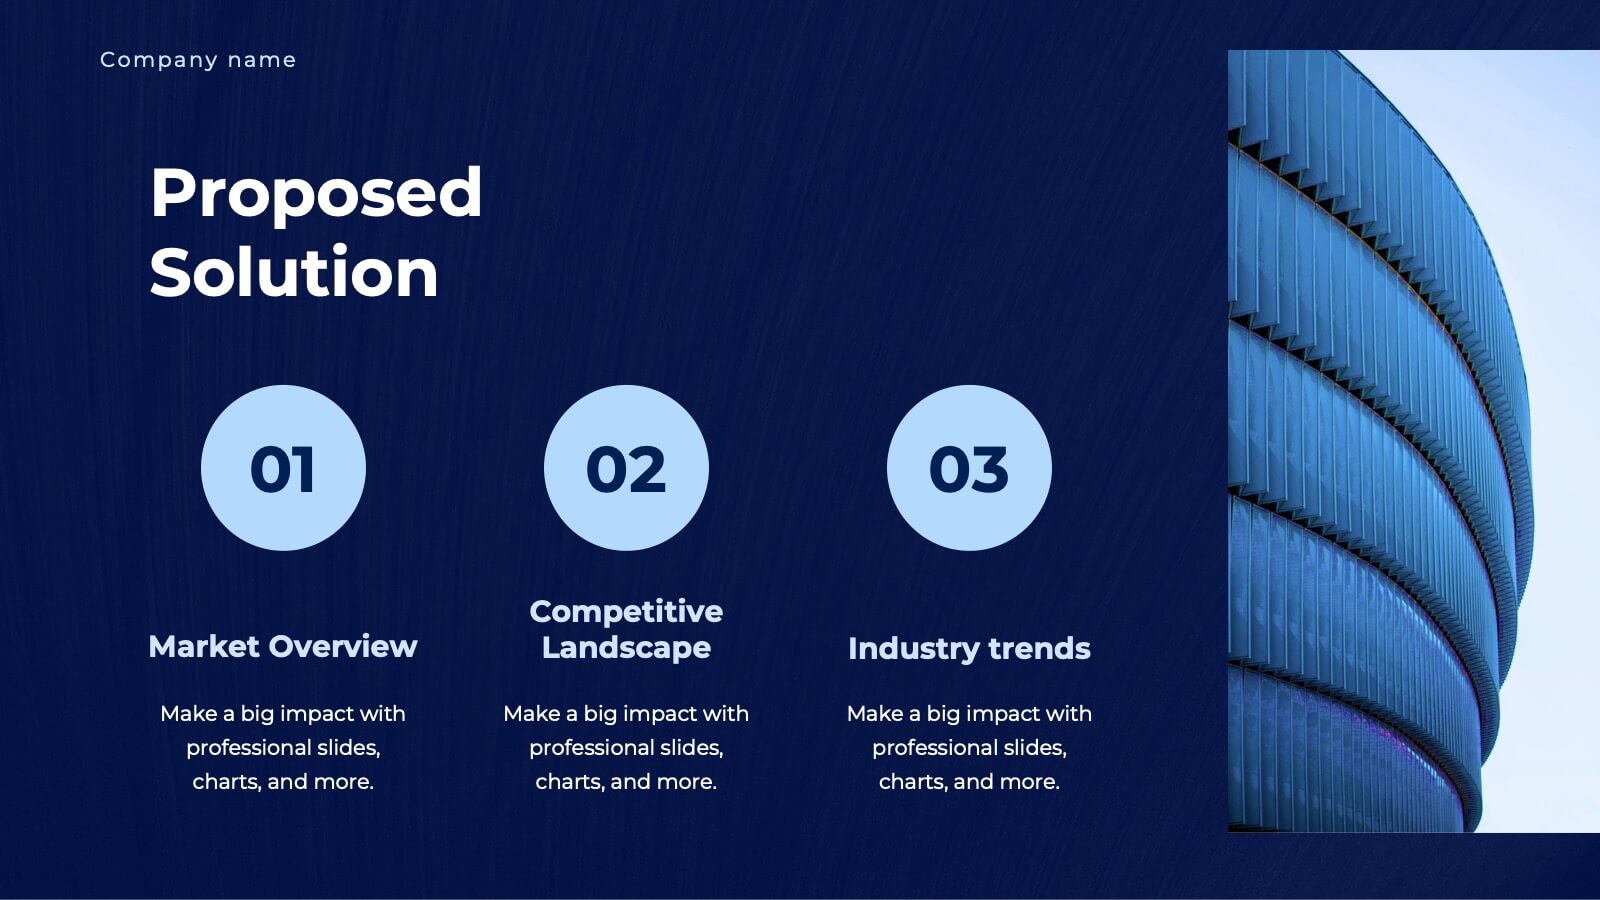
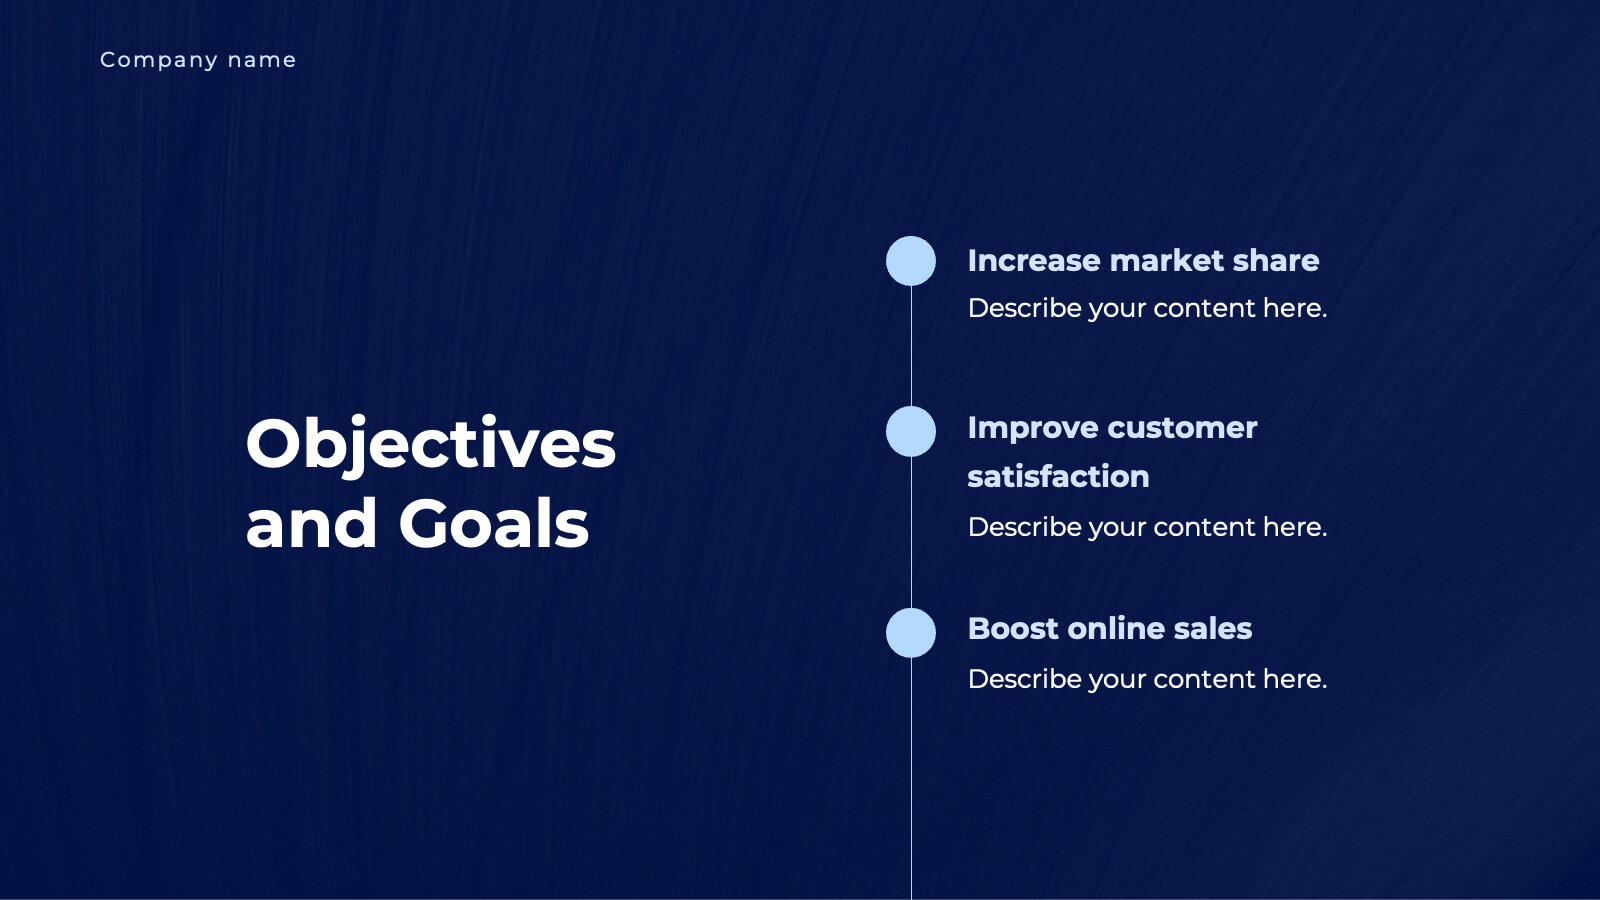
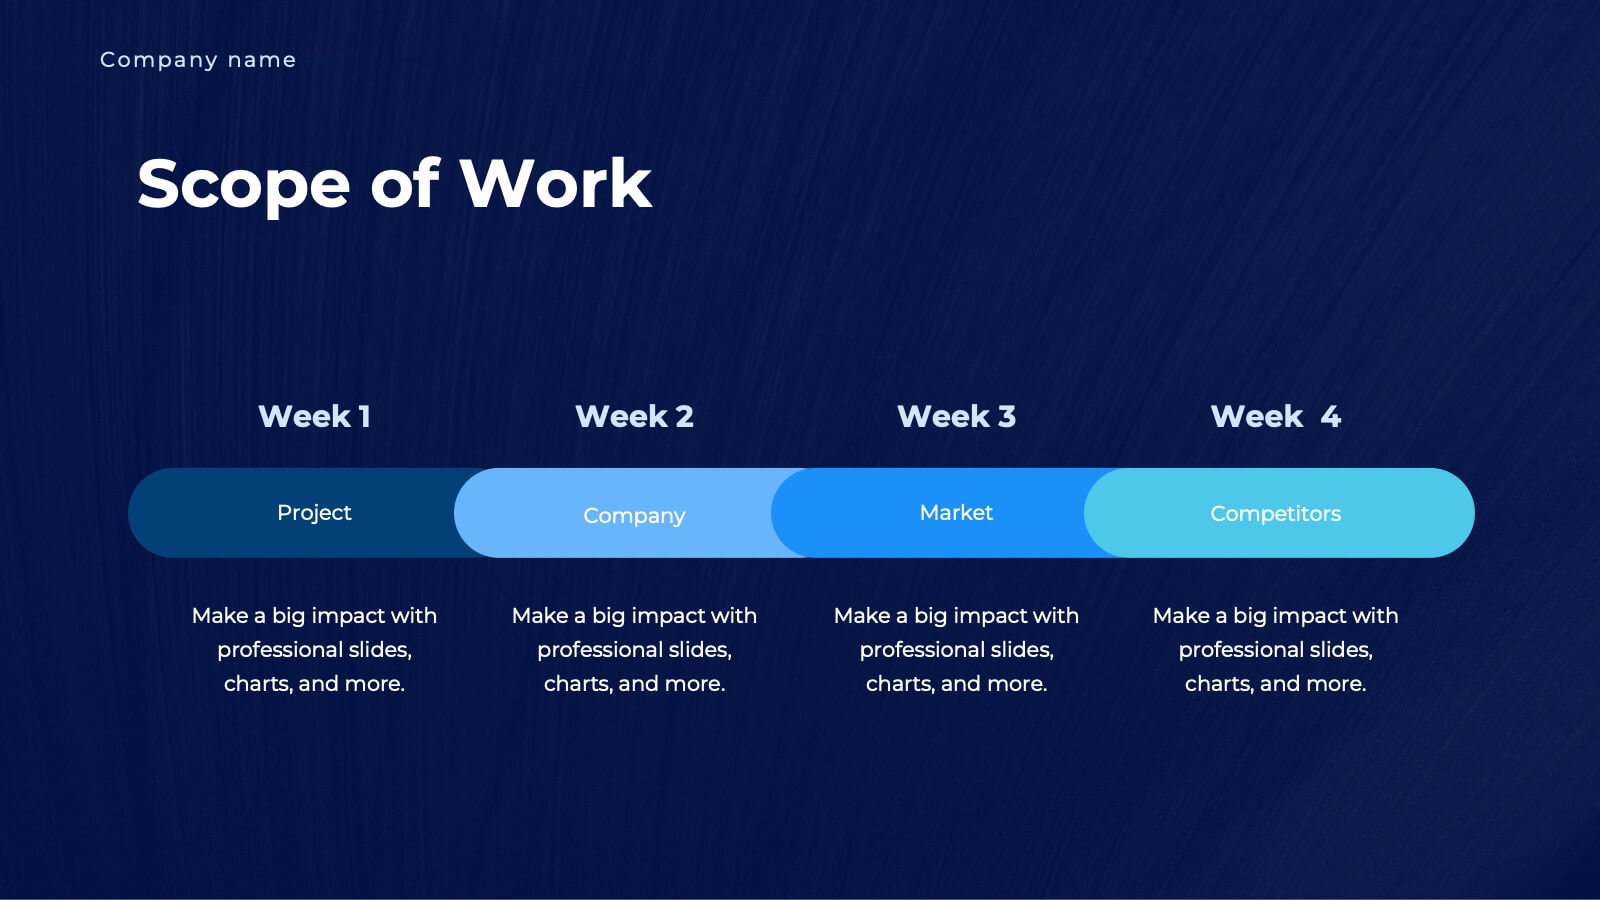
Unity Business Proposal Presentation
Take your business proposals to the next level with this elegant and comprehensive template! Perfect for presenting company overviews, project summaries, and detailed solutions. Ideal for business professionals looking to impress clients and stakeholders. Compatible with PowerPoint, Keynote, and Google Slides, this template ensures your proposals are impactful and professional.


5 slides
Social Media Strategies Presentation
Bring your online vision to life with a clean, modern layout that makes planning campaigns feel effortless. This presentation helps you map out goals, content pillars, audience insights, and platform tactics with clarity and impact. Fully editable and compatible with PowerPoint, Keynote, and Google Slides.


4 slides
Regional Economy Development in Oceania Map Presentation
Visualize development priorities across Oceania with this regional map template. Featuring three editable title blocks and icon-labeled highlights, it’s perfect for showcasing growth strategies, funding allocation, or policy focus areas. Fully compatible with PowerPoint, Keynote, and Google Slides for data-driven presentations in regional planning or economic development.


23 slides
Tempest Design Portfolio Presentation
Elevate your creative showcase with the Tempest Design Portfolio Presentation template! This beautifully crafted layout is designed to highlight your best work in a sophisticated and professional manner. The subtle earthy tones and minimalist design create a perfect backdrop for presenting your projects, from the initial concept to the final execution. Whether you're an individual designer or a creative agency, this template allows you to elegantly present your portfolio, philosophy, and style, making a powerful impact on your audience. Each slide is thoughtfully designed to emphasize your achievements, client testimonials, and services offered, ensuring that your work shines through with clarity and style. Ideal for client presentations, creative pitches, or showcasing your portfolio online, this template is fully compatible with PowerPoint, Keynote, and Google Slides. Make your design story unforgettable with the Tempest template, and let your creativity speak volumes!


22 slides
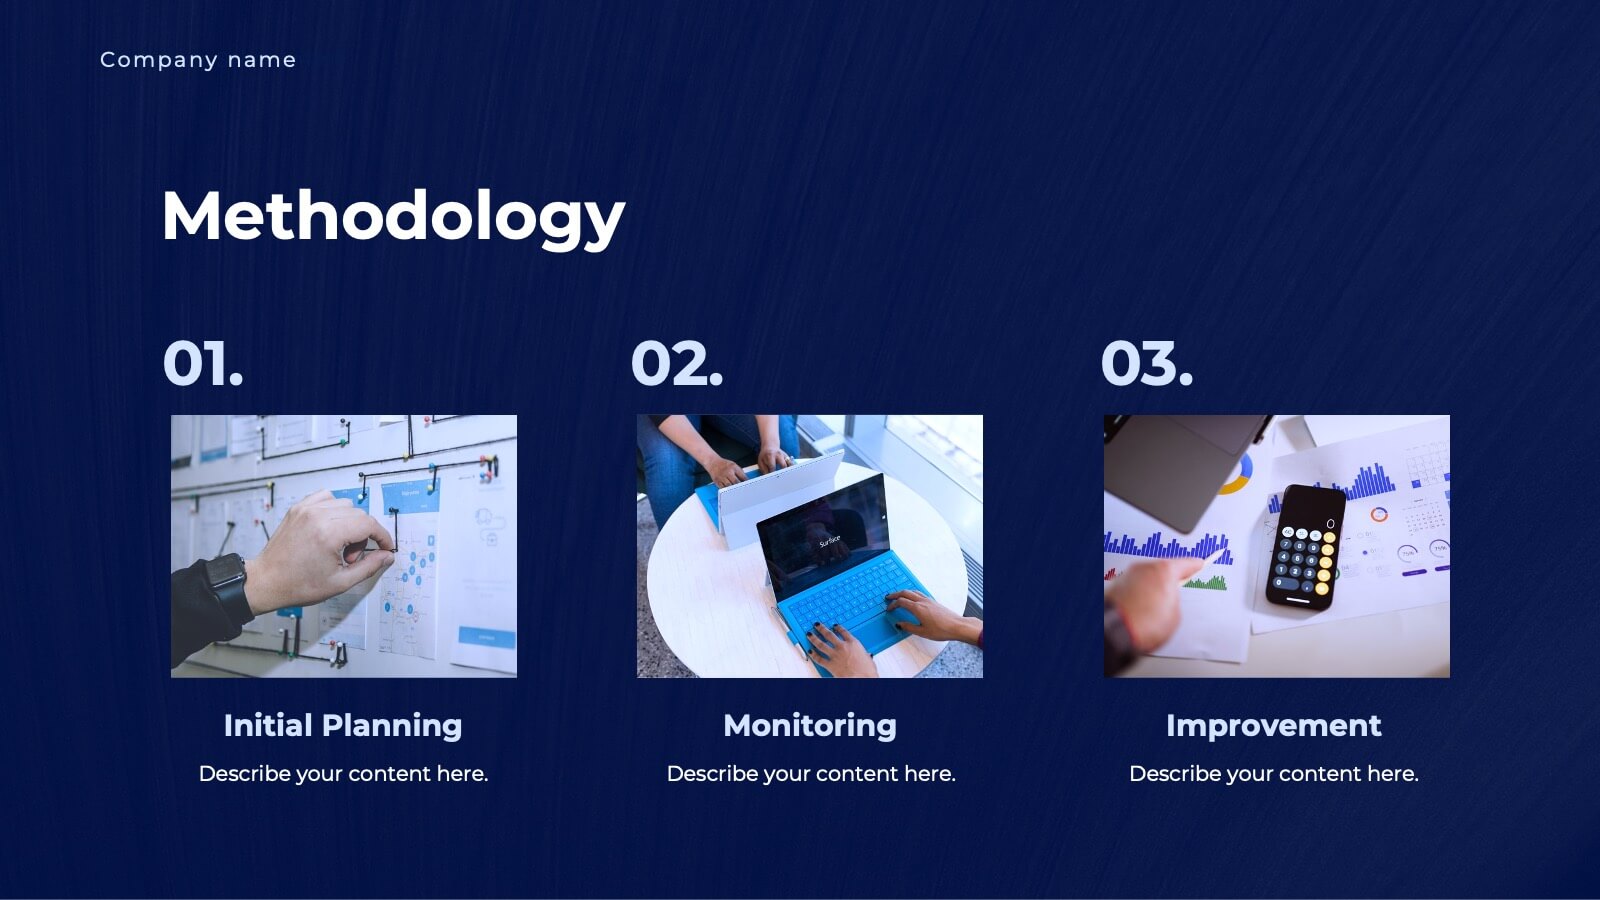
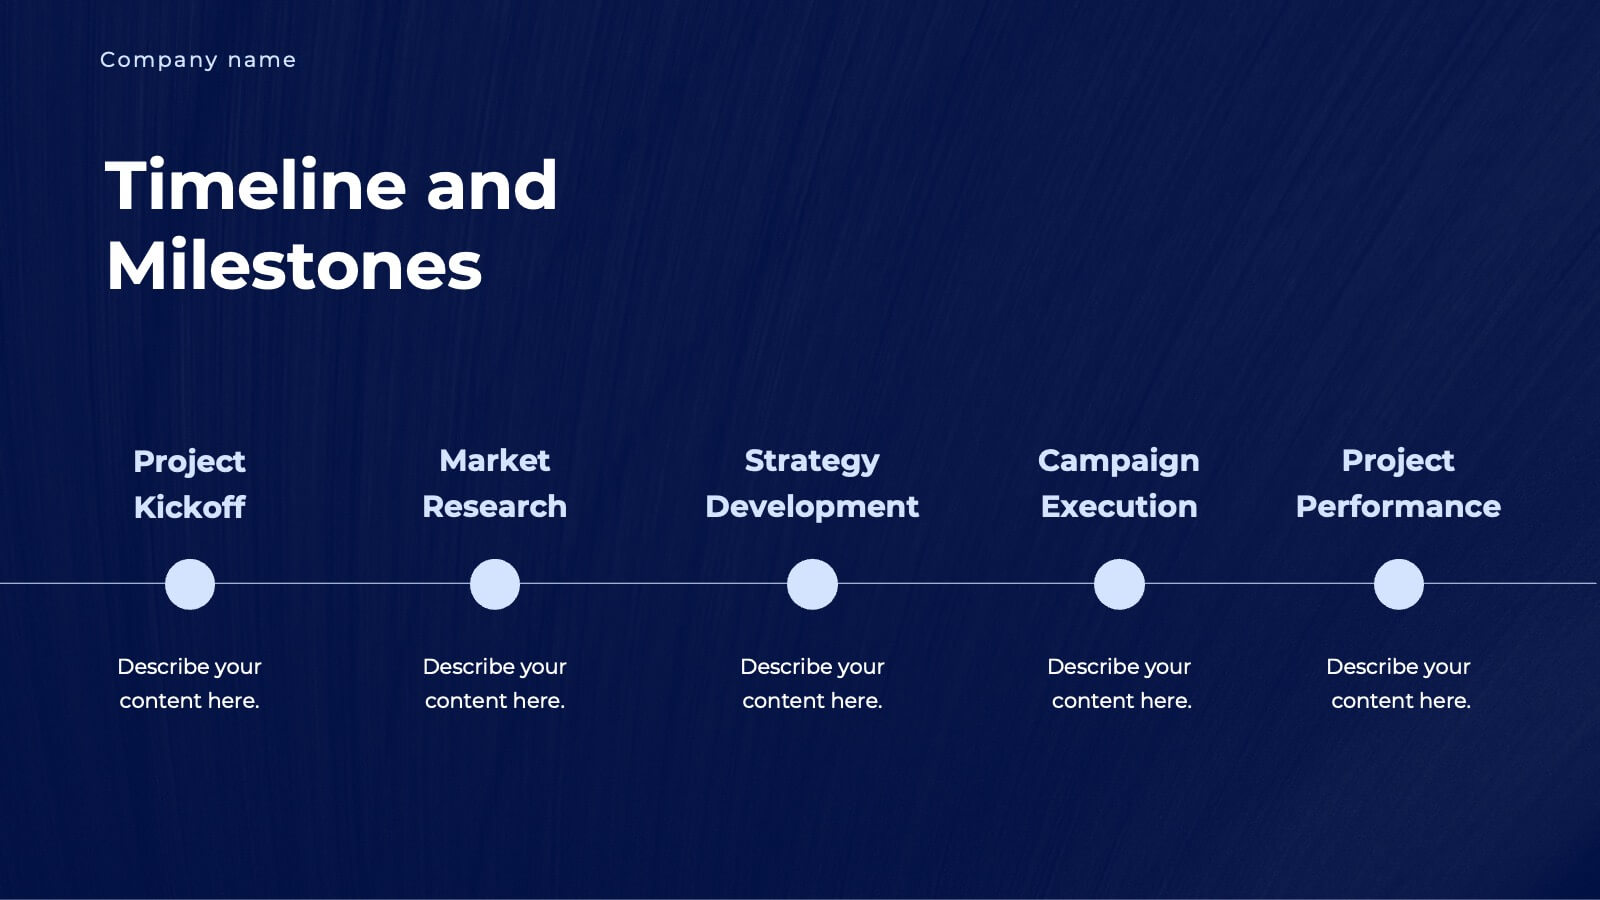
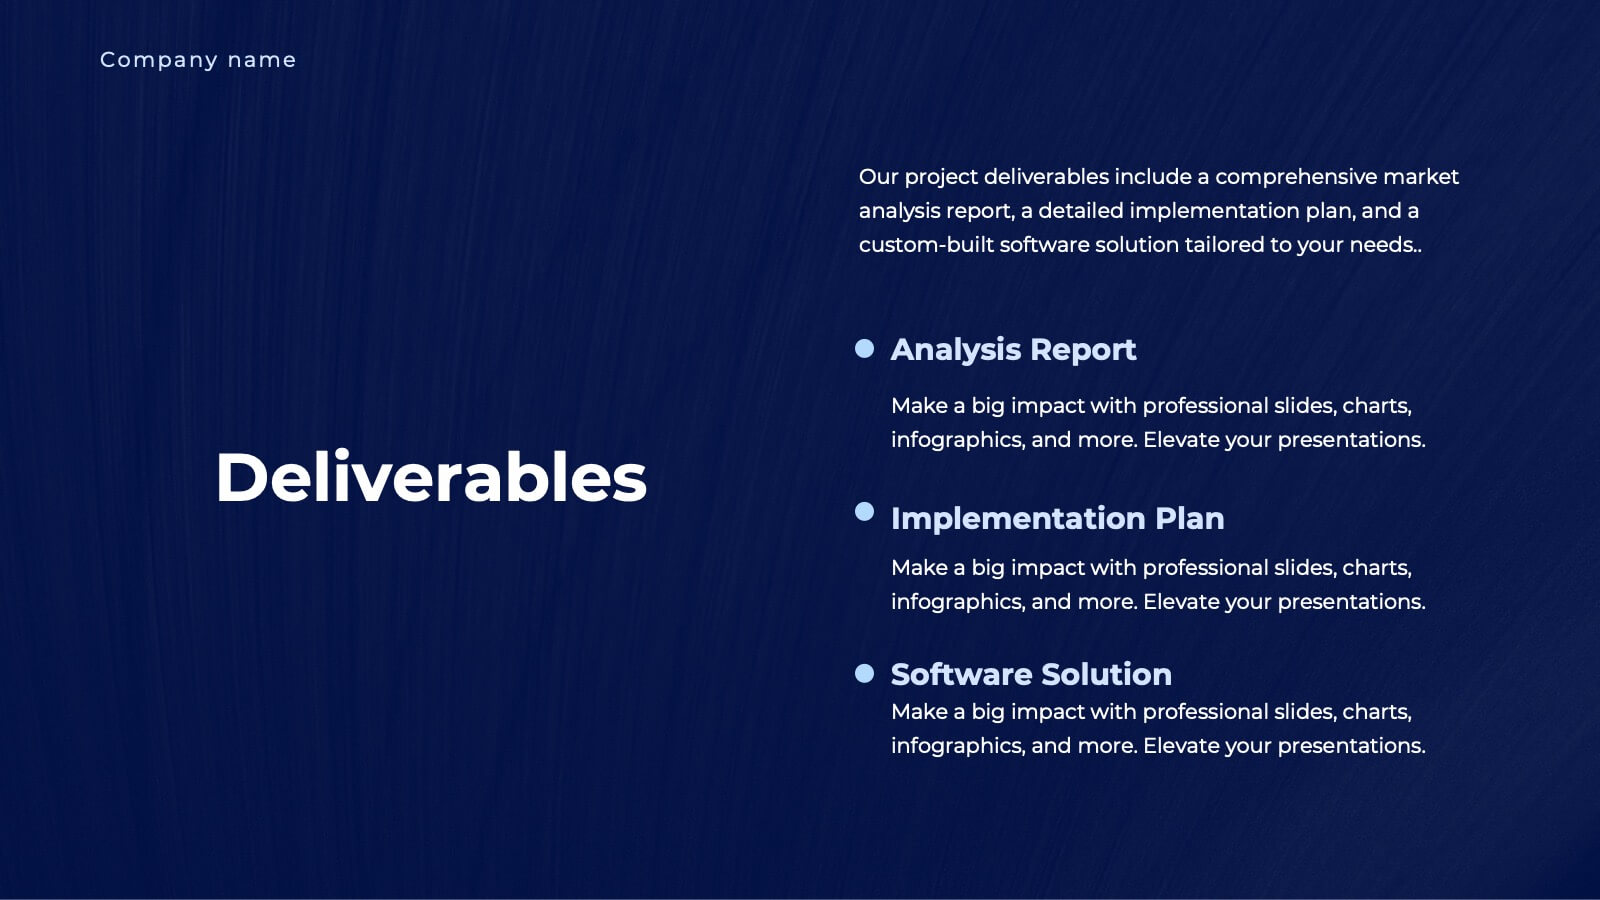
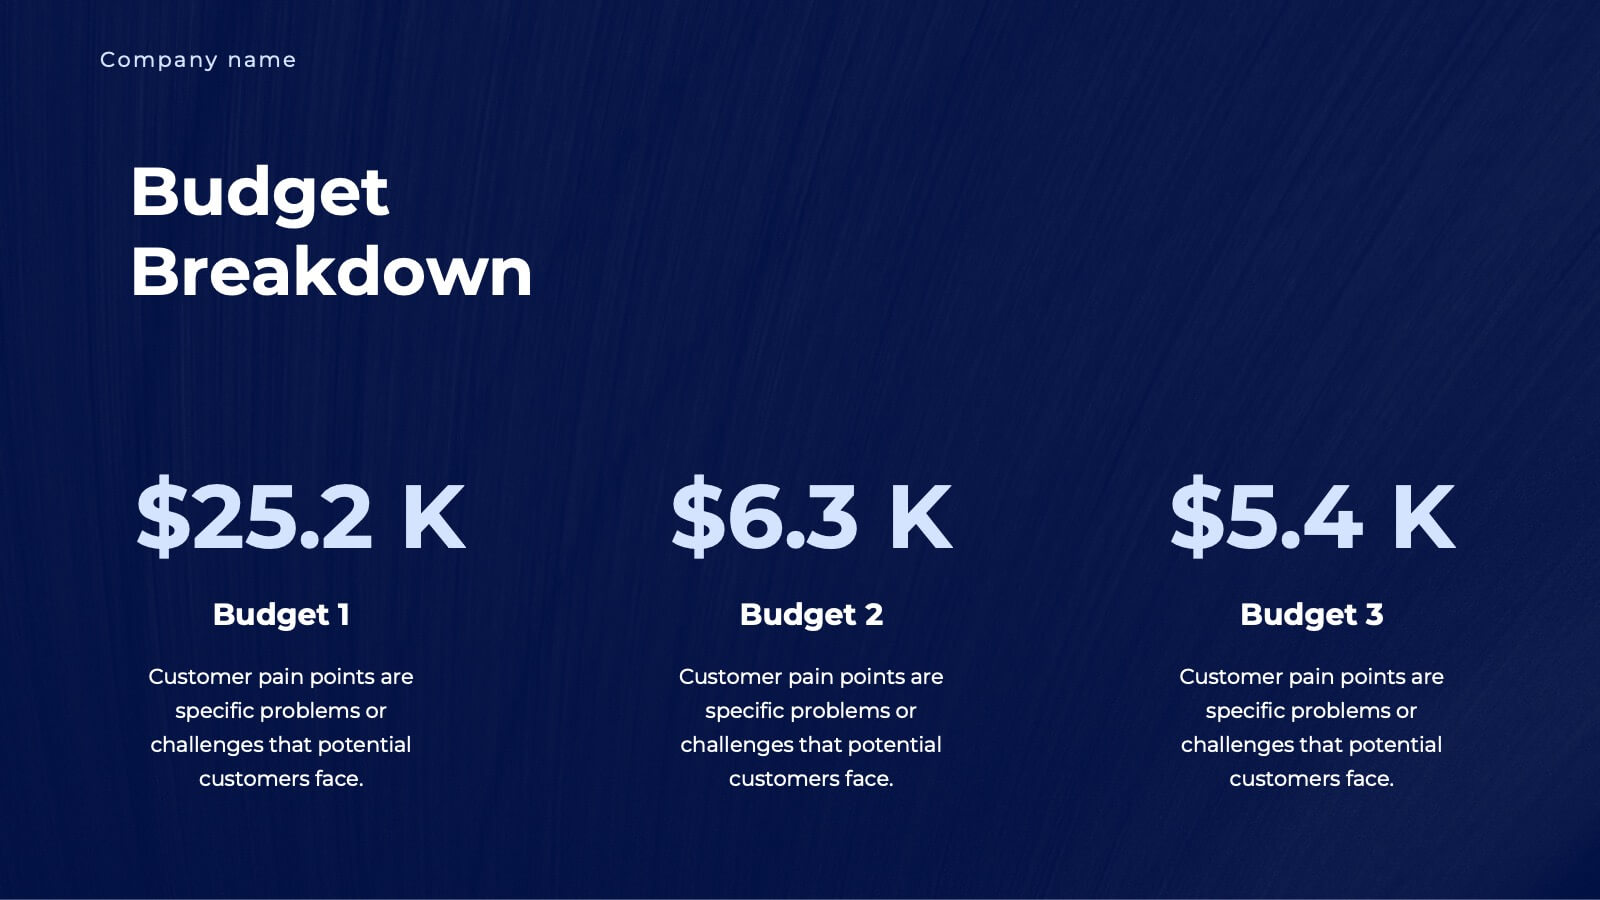
Aurorafrost Project Timeline Presentation
A sleek timeline-focused presentation template that showcases project overviews, objectives, deliverables, and milestones. Perfect for tracking budgets, resource allocation, stakeholder analysis, and quality assurance plans. Includes modern layouts for seamless planning and execution. Fully editable for a range of industries, compatible with PowerPoint, Keynote, and Google Slides for polished results.


7 slides
Communication Styles Infographic
Dive into the diverse world of communication with our communication styles infographic. Set against a palette of blue, yellow, and white, this template offers a visual exploration of different communication methods and their nuances. Whether it's assertive, passive, aggressive, or passive-aggressive, understanding these styles is vital in both personal and professional settings. Ideal for corporate trainers, educators, students, or anyone aiming to improve their interpersonal skills. Crafted for clarity and compatibility, this infographic is an excellent addition to PowerPoint, Keynote, and Google Slides, ensuring your presentations resonate with both substance and style.


8 slides
Responsibility Assignment Overview Presentation
The Responsibility Assignment Overview Presentation is a practical and visually structured RACI matrix layout, ideal for clarifying team roles across multiple tasks. Featuring a clear grid system, it highlights who is Responsible, Accountable, Consulted, and Informed for each task—ensuring project accountability and team alignment. Each letter is color-coded for easy scanning, with editable placeholders for up to six tasks and roles. Perfect for project managers, HR professionals, and operations teams. Fully customizable in PowerPoint, Keynote, and Google Slides.


4 slides
Execution Phase Project Status Dashboard Presentation
Track execution phase progress at a glance with the Execution Phase Project Status Dashboard presentation slide. Featuring a visual traffic light indicator and pie charts, this layout helps communicate key metrics, task status, and completion percentages in a clear, engaging way. Ideal for internal reviews, stakeholder updates, or project team briefings. Fully editable in PowerPoint, Keynote, and Google Slides.


8 slides
Core Pillars of Business Success Presentation
Highlight your company’s foundation with the Core Pillars of Business Success presentation. This slide features four bold, column-style visuals labeled A through D—each representing a critical component of your business strategy. Ideal for illustrating structure, vision, and stability, it helps communicate growth factors like leadership, innovation, operations, and finance. Fully editable in PowerPoint, Keynote, and Google Slides, it's perfect for consultants, executives, and strategic planners.


5 slides
Flow Chart for Decision Trees
Clarify complex decisions with the Flow Chart for Decision Trees Presentation. This layout uses a vertical tree design with branching logic paths, making it perfect for outlining strategic choices, workflows, or evaluation criteria. Featuring five customizable sections with icon support and placeholder text, this template works seamlessly in PowerPoint, Keynote, and Google Slides.