


Features
- 5 Unique slides
- Fully editable and easy to edit in Microsoft Powerpoint, Keynote and Google Slides
- 16:9 widescreen layout
- Clean and professional designs
- Export to JPG, PDF or send by email


Do you have any questions?
Recommend


5 slides
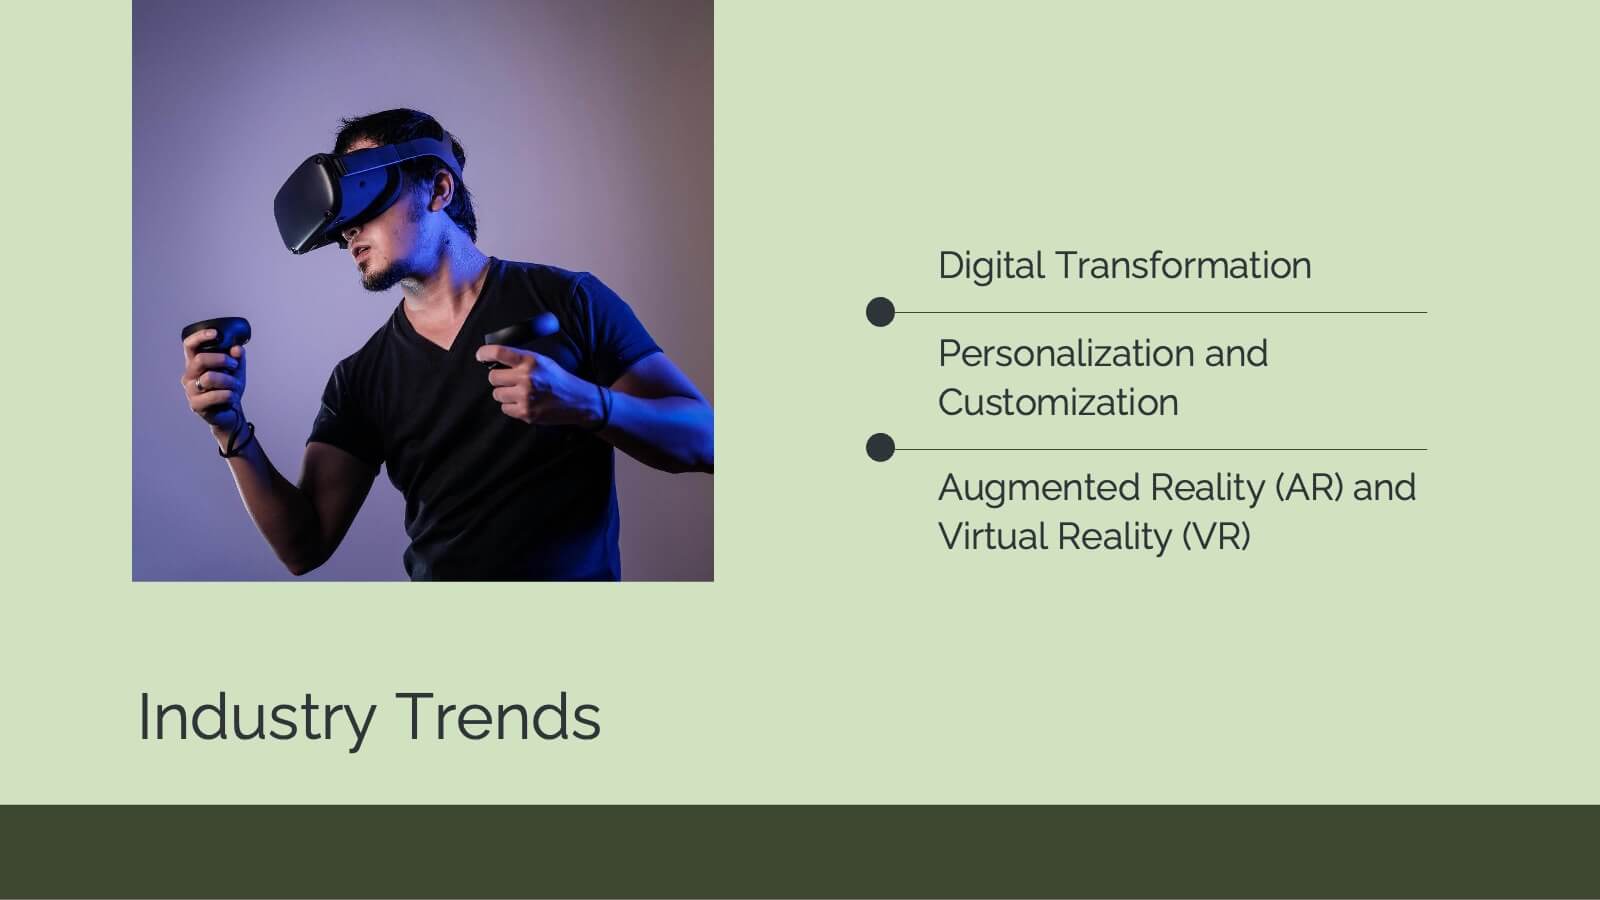
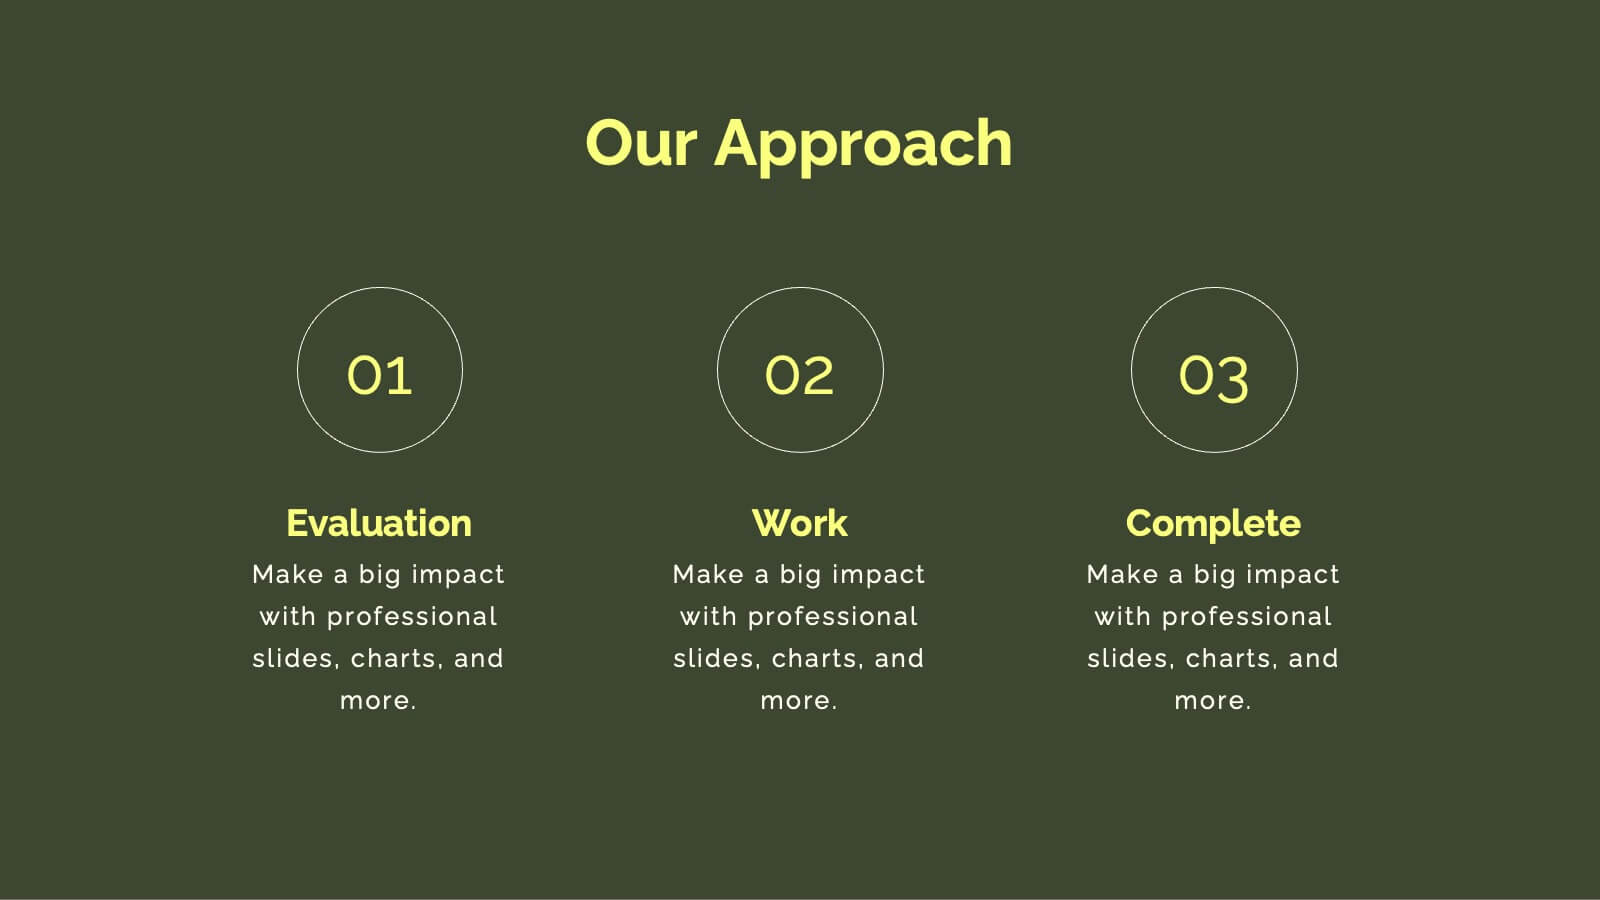
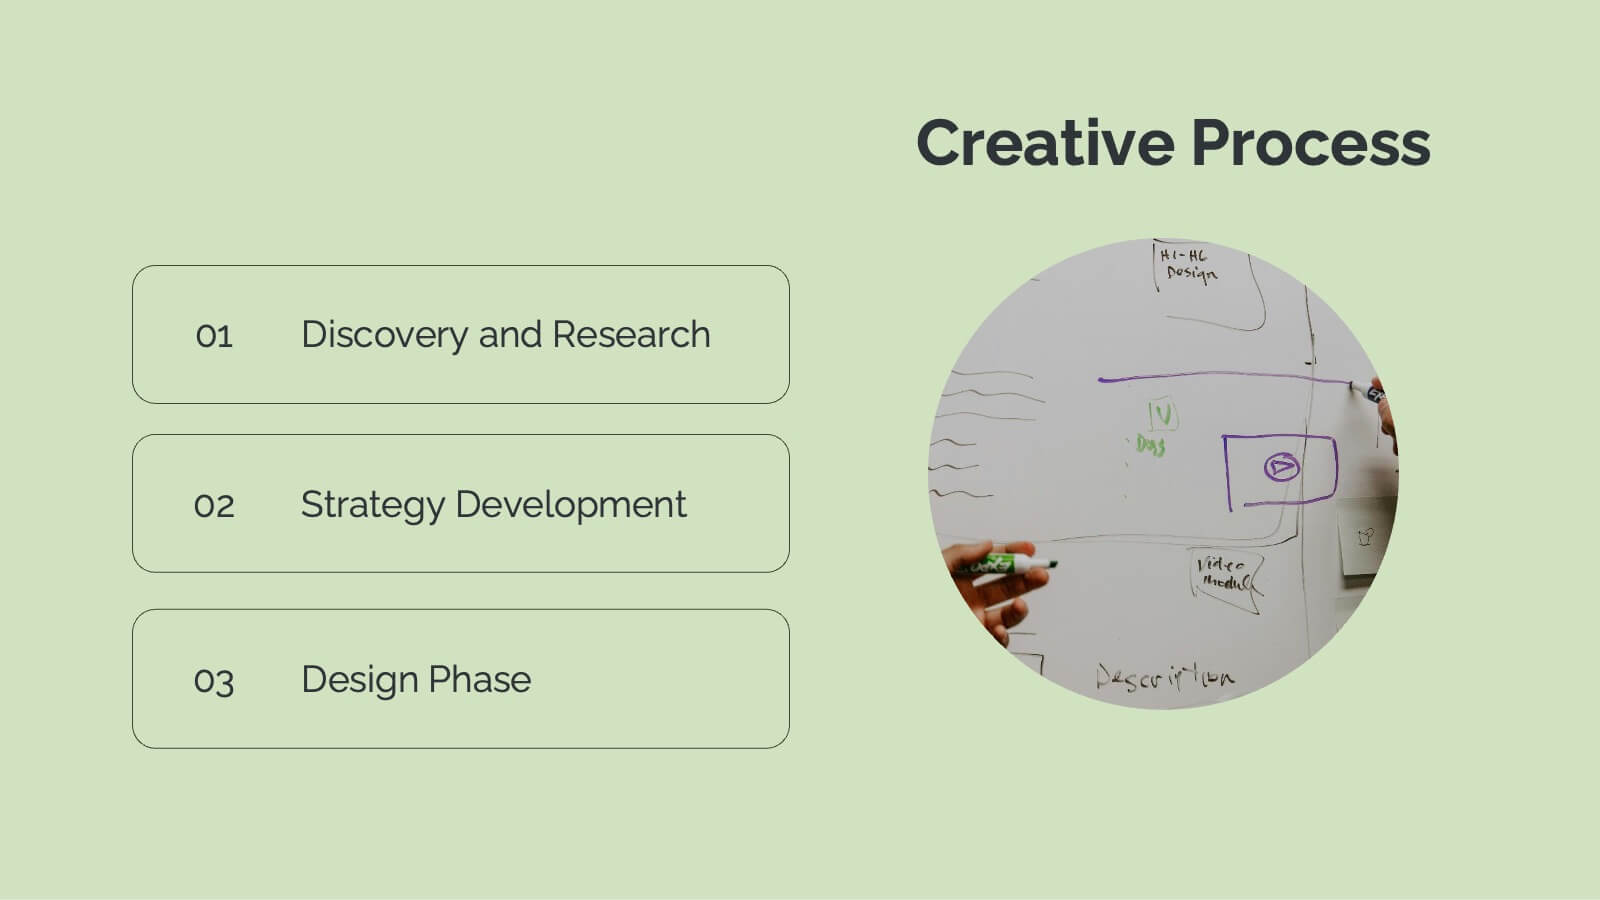
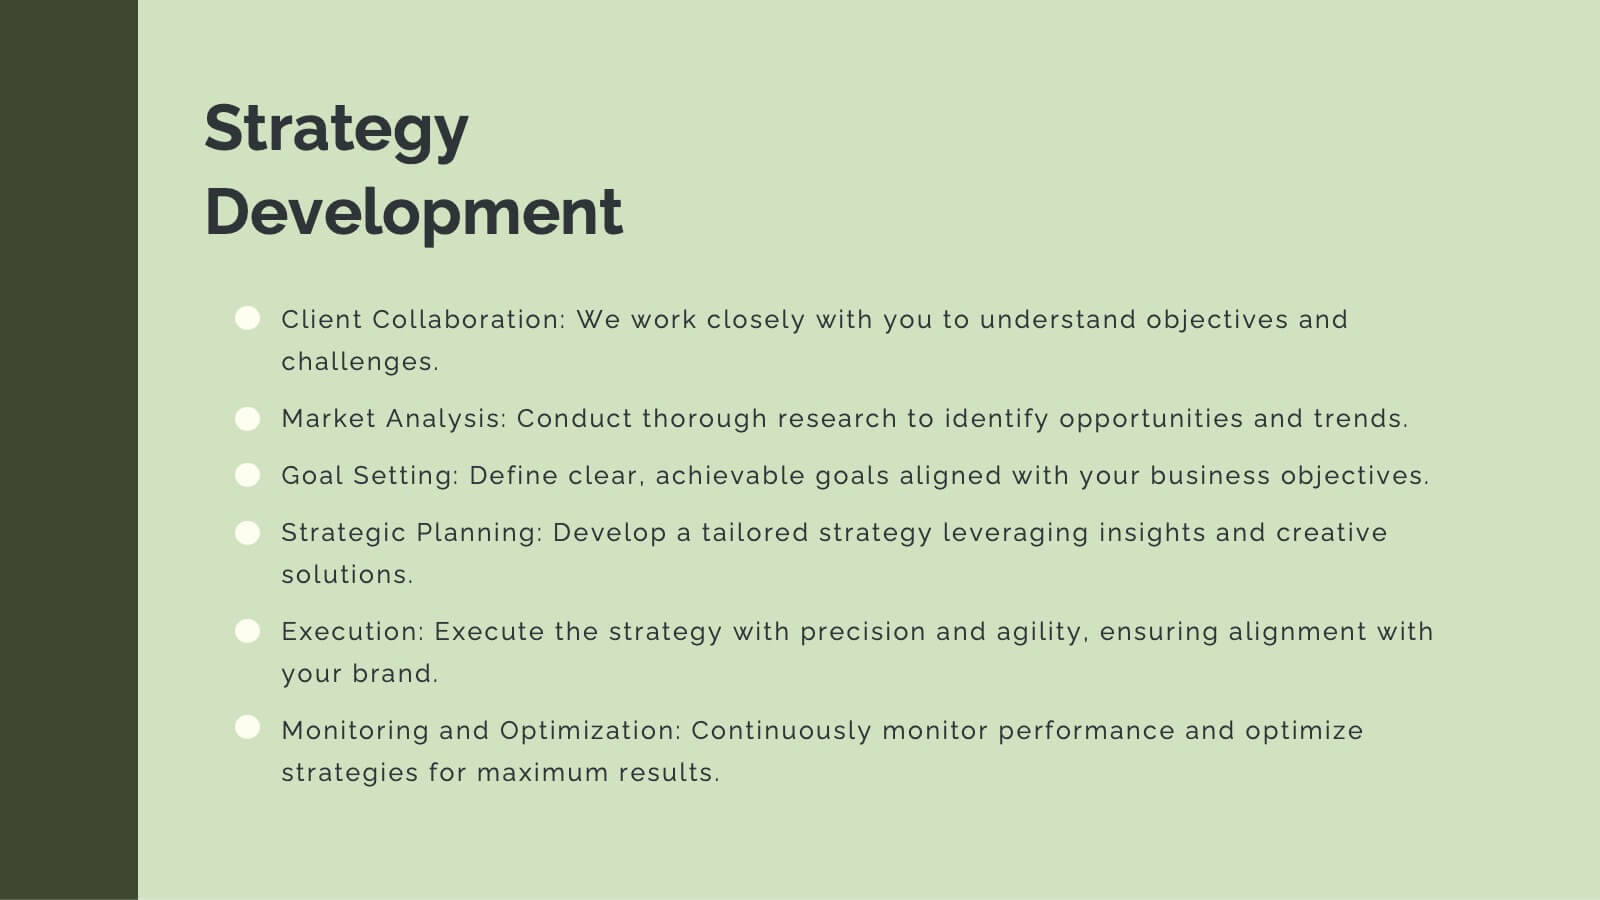
Professional Business Proposal Presentation
Make your pitch stand out with a polished, minimal design that highlights every key stage of your business strategy. This clean visual layout is perfect for outlining project phases, services, or data-driven insights with clarity and impact. Fully compatible with PowerPoint, Keynote, and Google Slides for easy customization.


10 slides
Creative Business Pitch Deck Presentation
Make your ideas stand out with a presentation that blends creativity and professionalism. Perfect for entrepreneurs and teams showcasing innovative business concepts, it helps structure your pitch with clarity and impact. Fully customizable and compatible with PowerPoint, Keynote, and Google Slides for seamless editing and polished results.


26 slides
Operational Efficiency Tips Purple Presentation
Optimize your team's workflow and showcase your strategies for improved performance with this operational efficiency template. The vibrant purples and dynamic design invite viewers into a world where streamlined processes and clear objectives lead to success. Lay out the steps of your action plan, from the CEO's vision to the team's execution, with a variety of slides designed for clear communication. Charts and diagrams turn complex data into easy-to-follow visuals, while mockups provide a real-world view of your tools and platforms. Tailored for use in popular presentation software, this set of slides is an excellent aid for managers and consultants aiming to present plans that boost productivity and cut down waste. It’s all about making the complex simple and achieving more with less, helping your audience see the path to a leaner and more effective operation.


6 slides
Competitive Market Forces Analysis Presentation
Elevate your insights with a dynamic circular layout that turns complex market pressures into a clear, structured story. This presentation helps you compare key forces, highlight competitive advantages, and communicate strategic recommendations with confidence and simplicity. Fully editable and compatible with PowerPoint, Keynote, and Google Slides.


24 slides
Silver Product Launch Presentation
Unleash the potential of your product launch with this vibrant and engaging presentation template! Designed to showcase your product's unique features, market positioning, and competitive edge, this template helps you tell a compelling story from start to finish. It’s perfect for grabbing attention and driving impact. Compatible with PowerPoint, Keynote, and Google Slides.


6 slides
International Business Operations Layout Presentation
Showcase your company’s global workflow with this international operations map. Featuring a step-by-step arrow layout and matching location markers, it’s perfect for visualizing supply chains, regional tasks, or expansion strategies. Easily customizable and ideal for executive briefings, logistics updates, and global strategy decks. Compatible with PowerPoint, Keynote, and Google Slides.


4 slides
Audience Segmentation by Persona Presentation
Make data talk with personality! This vibrant slide set helps you visually compare buyer personas and their unique traits to refine audience targeting strategies. Whether you’re mapping user types or customer behaviors, these editable slides are perfect for strategic marketing. Fully compatible with PowerPoint, Keynote, and Google Slides.


23 slides
Cloudrift UX Case Study Presentation
Present a comprehensive and visually engaging UX Case Study with this dynamic and modern template. Begin with an introduction to the design challenge, followed by detailed slides for project overviews, user research, and persona development. Highlight the user journey mapping, information architecture, and wireframing process to showcase your structured approach to solving design problems. This template offers dedicated sections for prototyping, user testing, and feedback iterations, ensuring every stage of your process is documented. Dive into critical components like interaction design, responsive design, and accessibility considerations, demonstrating your commitment to delivering user-centric solutions. Conclude with a project showcase that highlights the final product and its impact. Fully customizable and compatible with PowerPoint, Google Slides, and Keynote, this template is perfect for presenting your UX design insights with clarity and professionalism.


4 slides
Workplace Safety and Compliance Presentation
Ensure a safer work environment with our 'Workplace Safety and Compliance' presentation template. Perfect for illustrating essential safety protocols and compliance standards, this visual tool boosts understanding and adherence. Fully compatible with PowerPoint, Keynote, and Google Slides, it's an excellent resource for any safety-oriented presentation.


7 slides
Medical Center Infographic
A medical center, often referred to as a healthcare center, is a facility or establishment where a range of medical services and care are provided to individuals in need of medical attention. This infographic template is designed to provide a comprehensive overview of the medical center, emphasizing its services, healthcare professionals, facilities, patient satisfaction, and community engagement. This infographic is fully customizable and compatible with Powerpoint, Keynote, and Google Slides. Easily customize and design this to align with your specific medical center's brand and message.

21 slides
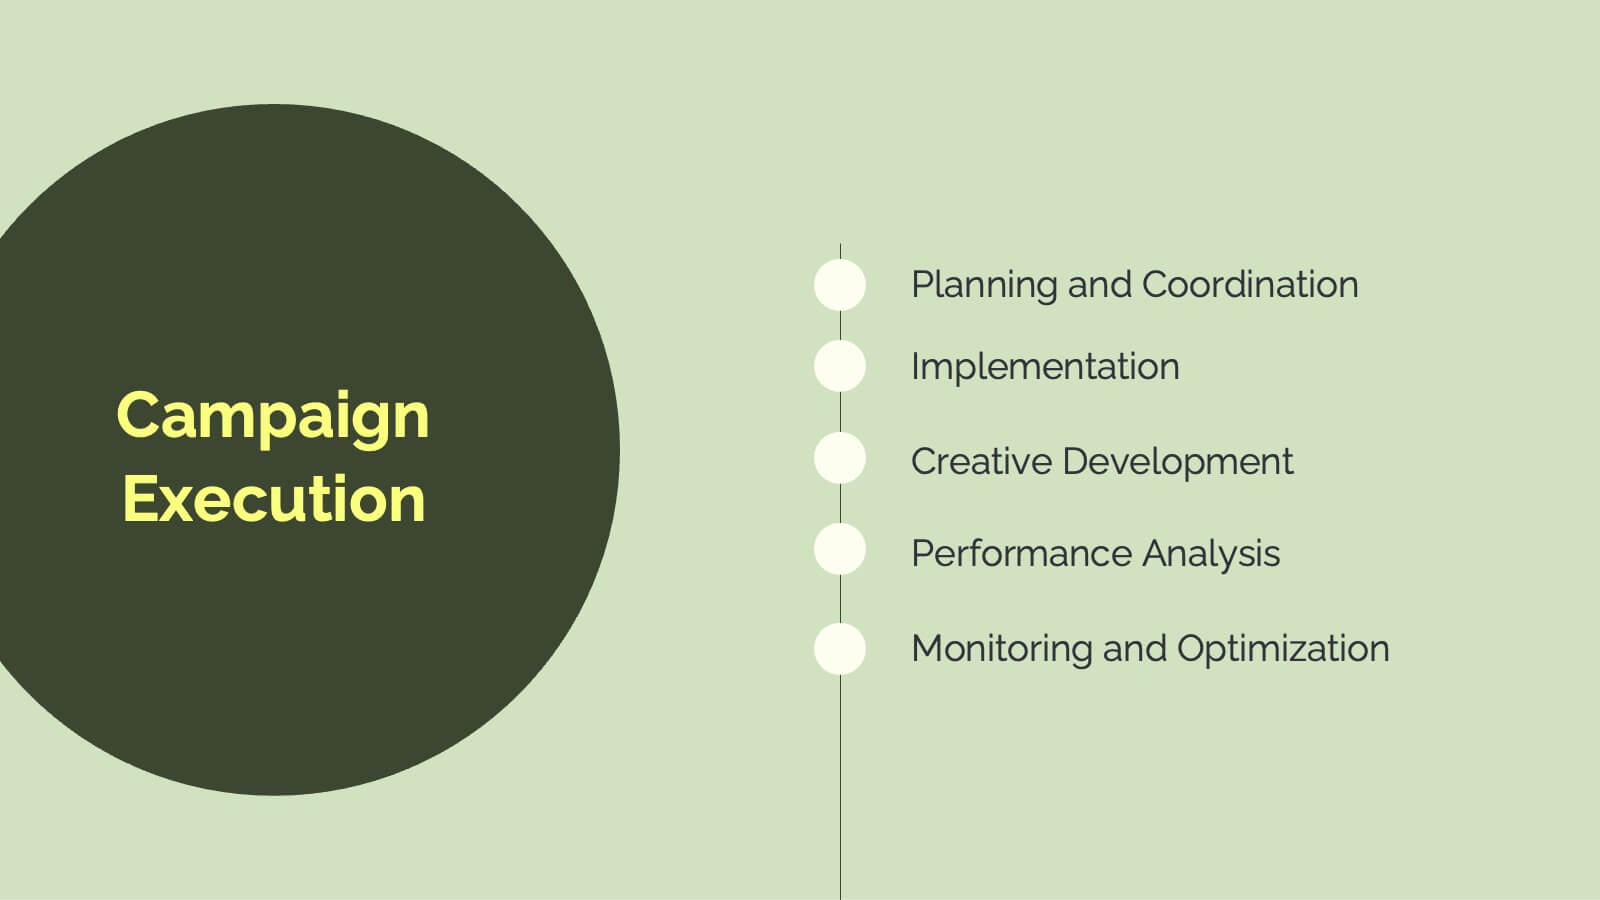
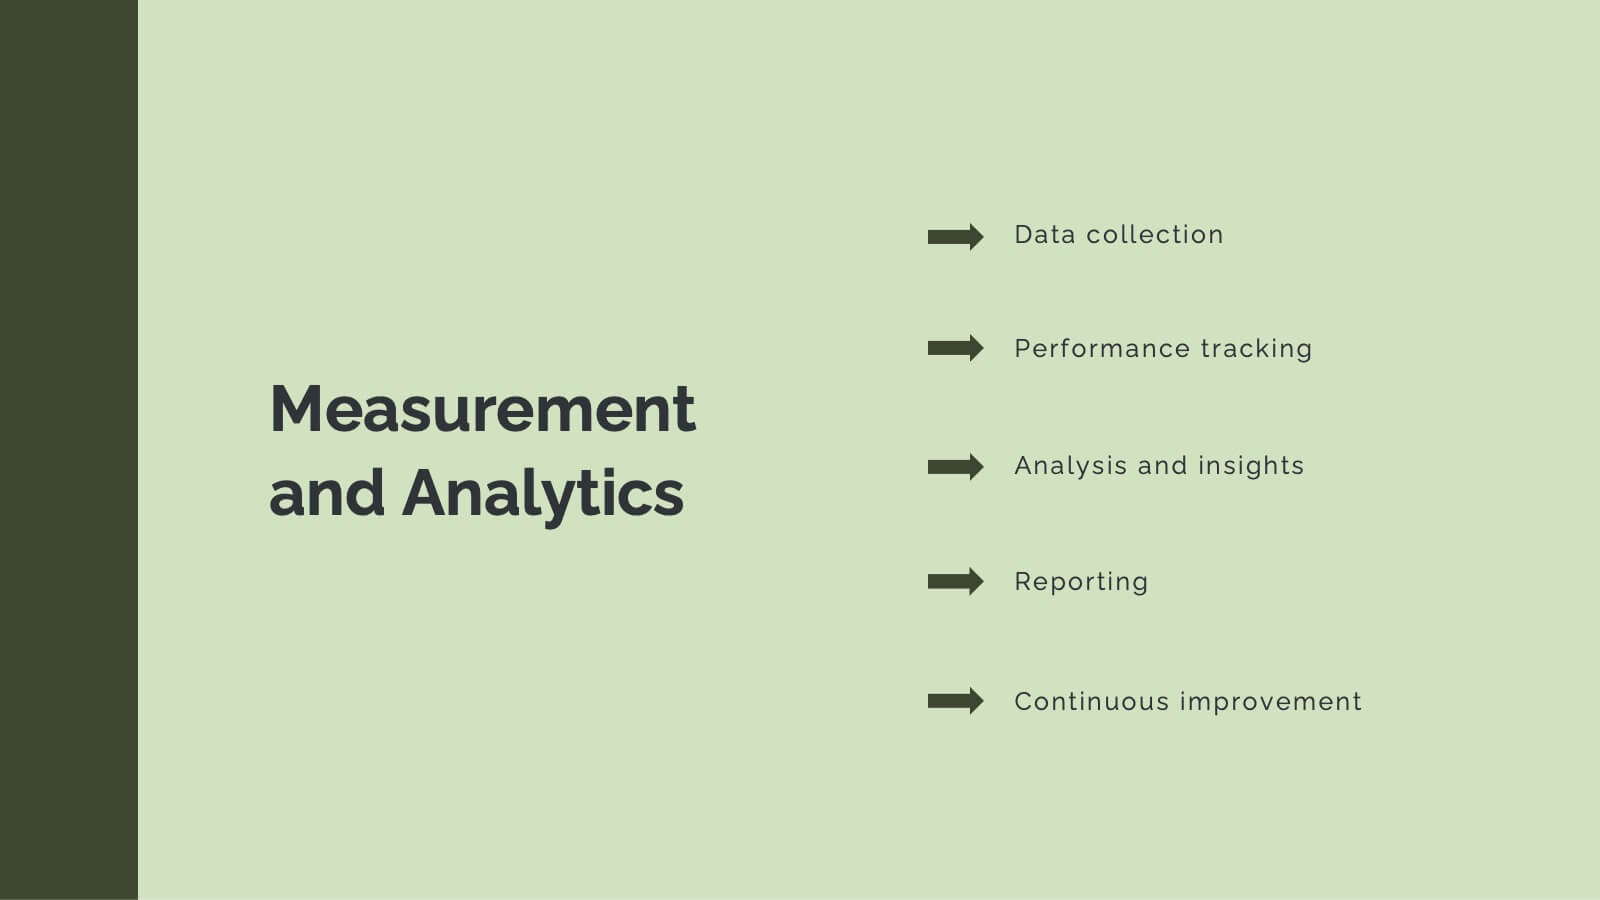
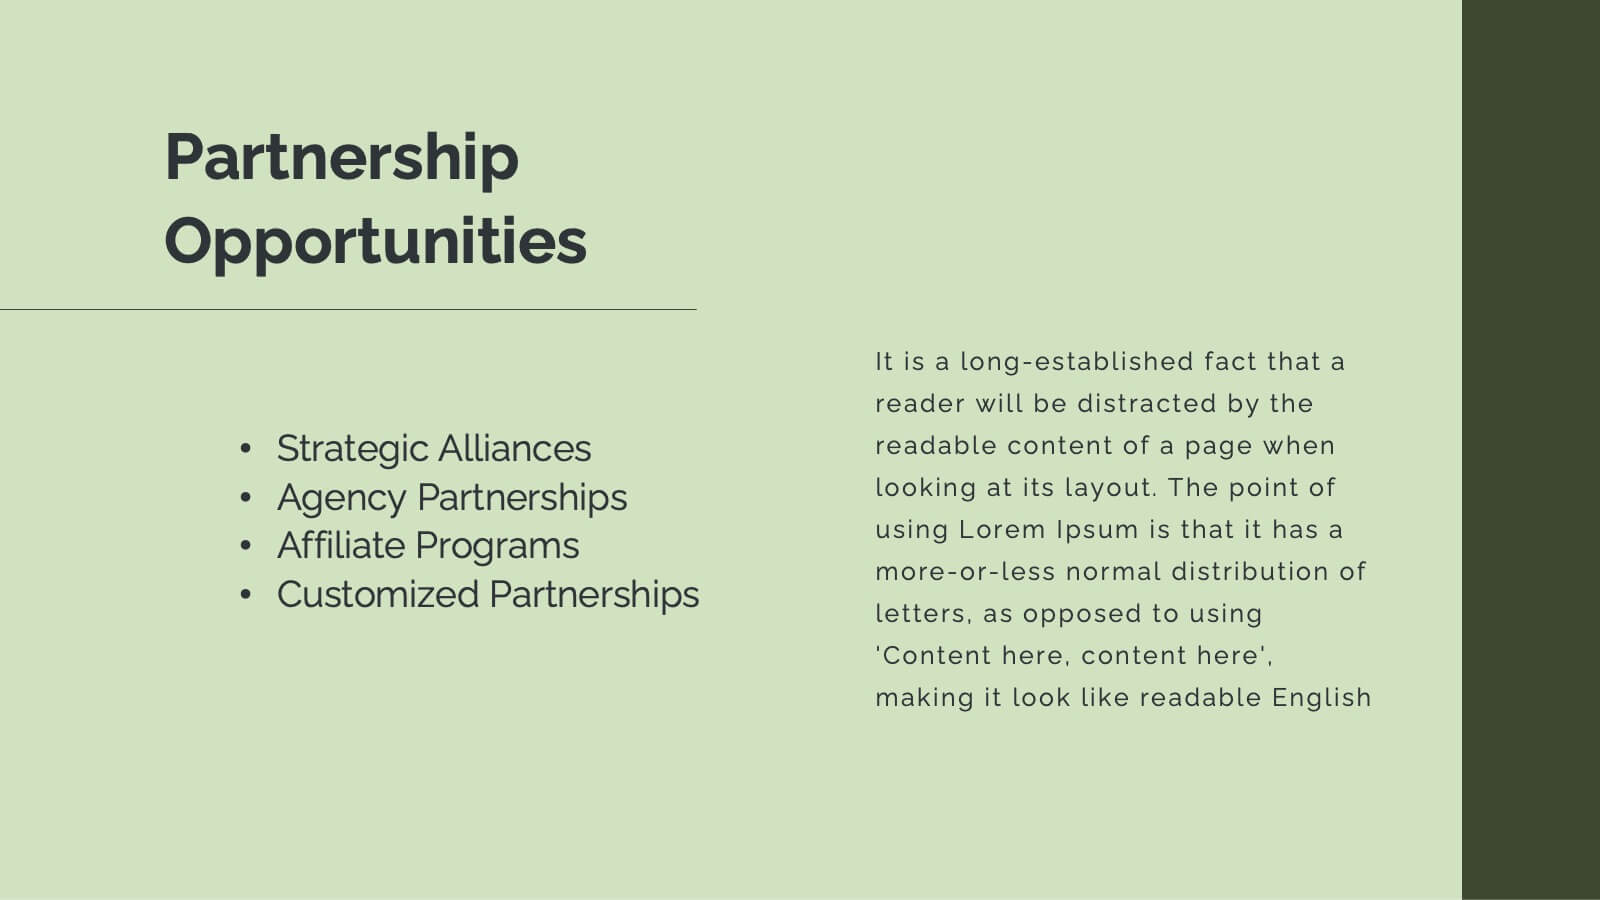
Horizon Advertising Agency Proposal Presentation
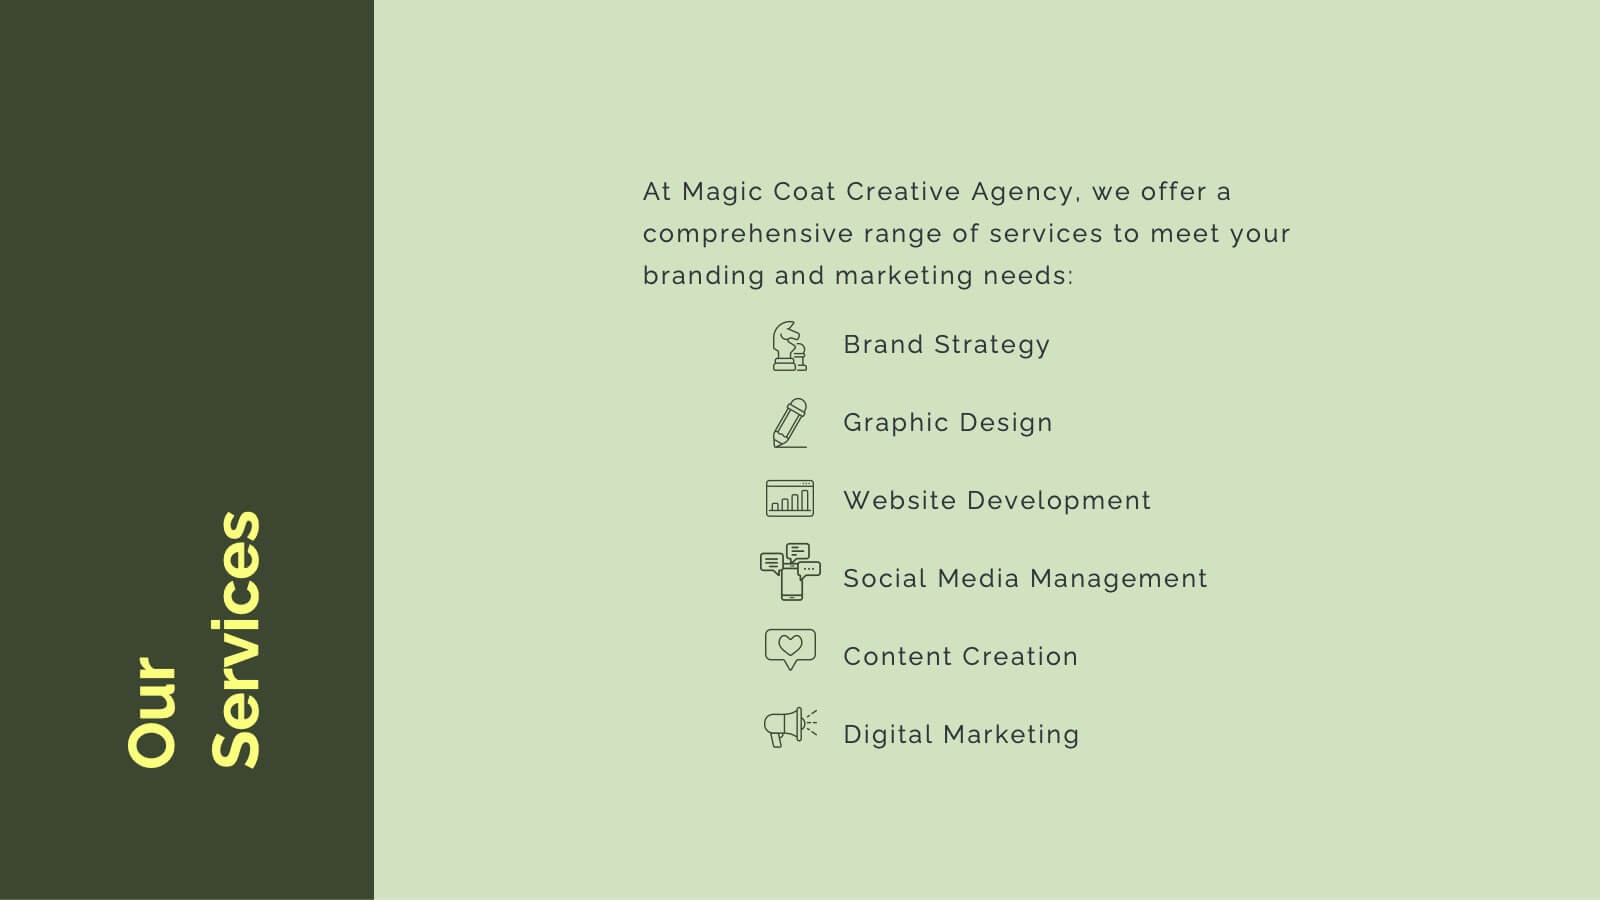
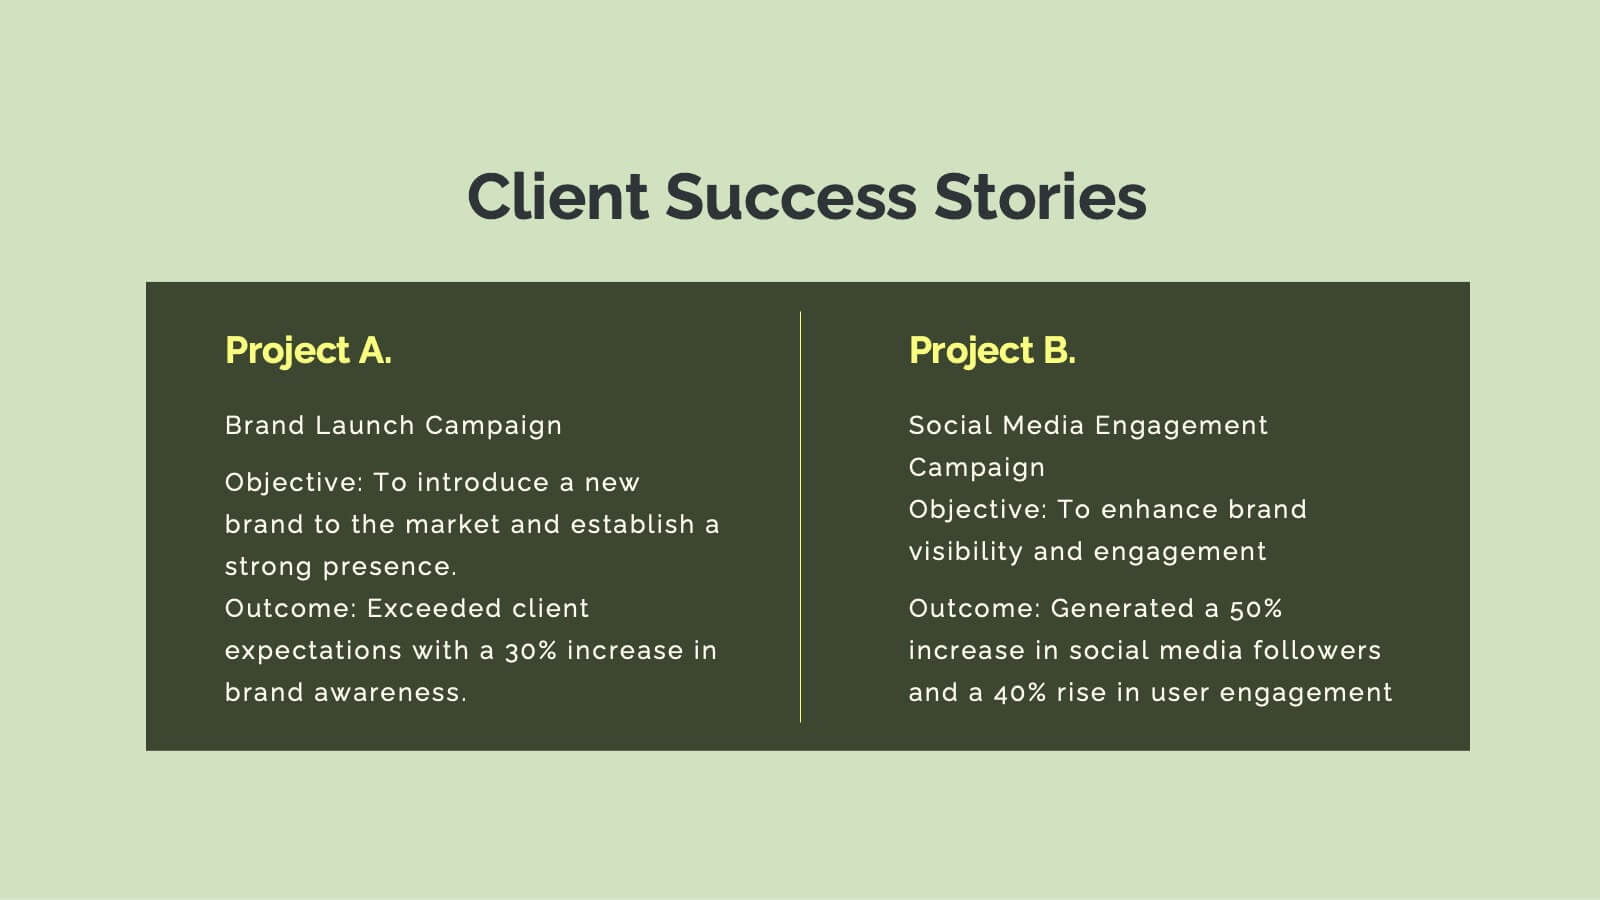
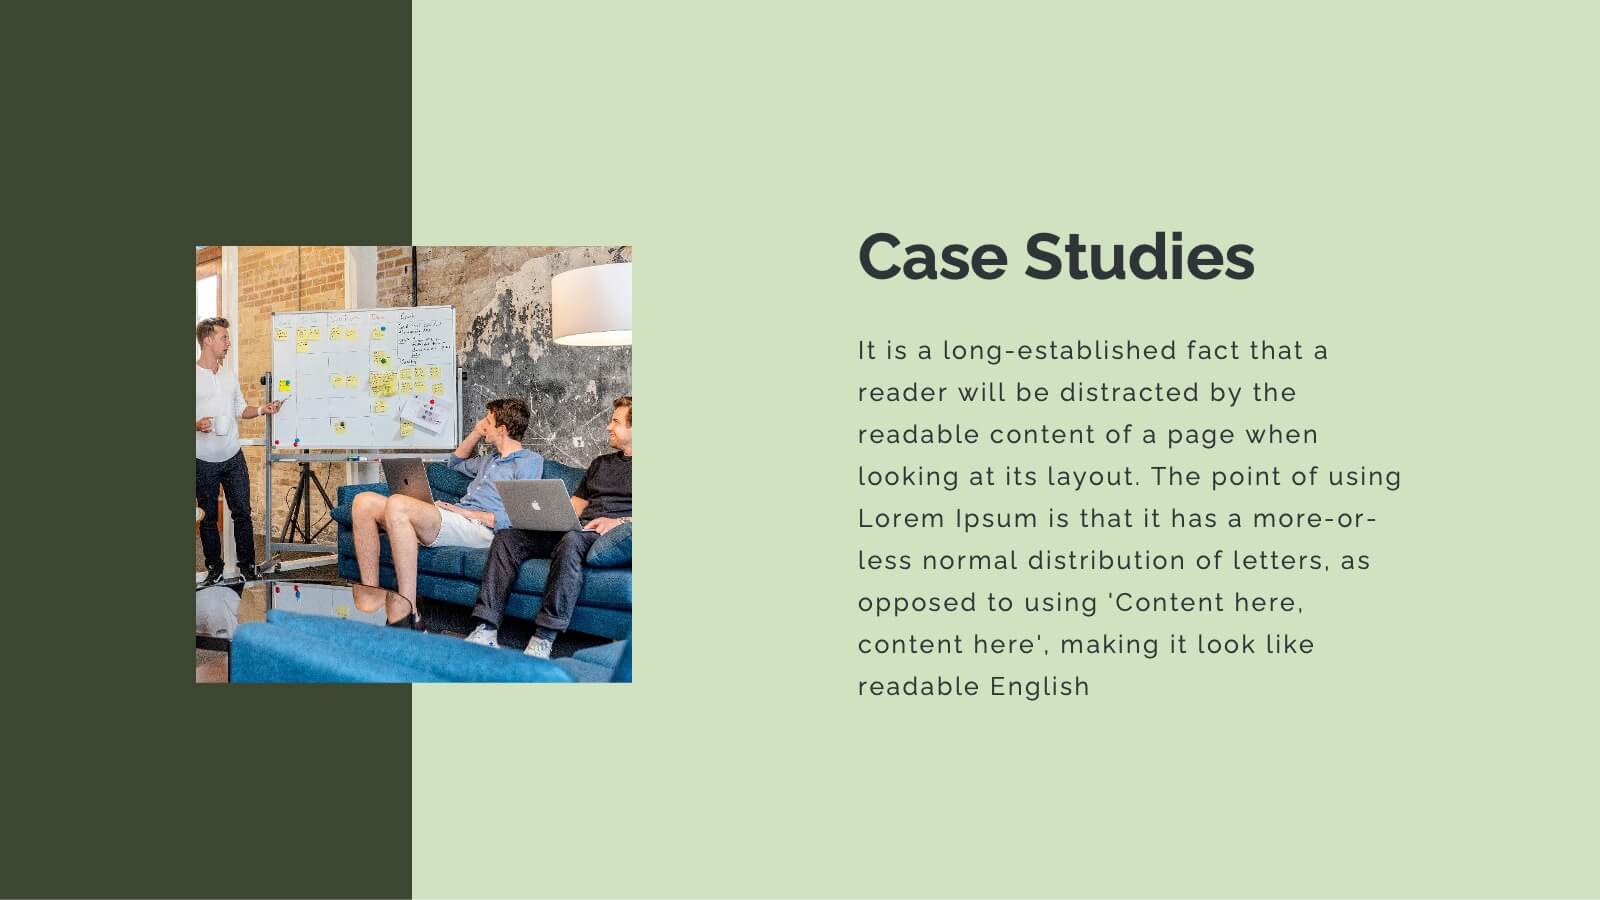
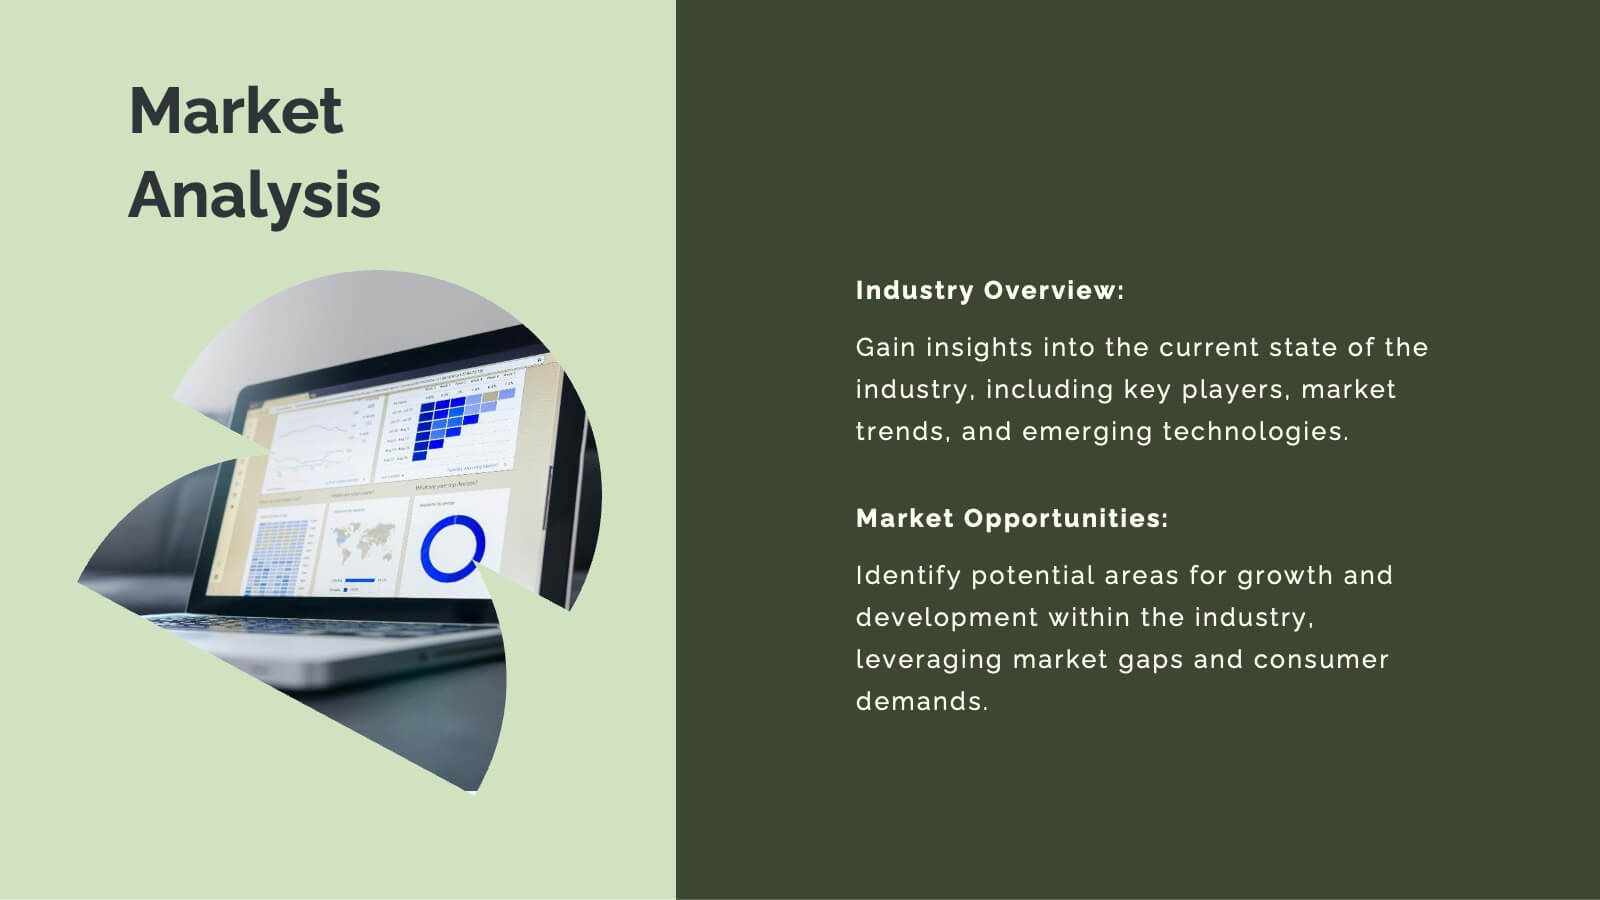
Elevate your advertising impact with this comprehensive agency proposal template. It’s meticulously designed to showcase your agency’s capabilities from strategic planning to creative execution, ensuring a persuasive presentation of services like market analysis, campaign strategies, and client success stories. Each slide is formatted to facilitate understanding and engagement, making it perfect for highlighting your team's expertise and unique approach. Compatible with major presentation platforms like PowerPoint, Google Slides, and Keynote, this template supports your efforts to secure new clients and projects seamlessly across various devices.


4 slides
Editable Cause and Effect Diagram Presentation
Bring clarity to every insight with a bold visual layout that makes connections between actions and outcomes easy to follow. This presentation helps you explain root causes, outline impacts, and guide decision-making with clean, structured graphics. Ideal for reports, planning, and analysis. Fully compatible with PowerPoint, Keynote, and Google Slides.


22 slides
Sky Drop Full-Service Agency Project Plan Presentation
Step into the world of strategic creativity with the Sky Drop Agency Project Plan template! Designed for modern agencies looking to impress clients and stakeholders, this template offers a sleek and professional design that highlights your agency's strengths, processes, and successes. With dedicated sections for mission and vision, team introduction, services, and client testimonials, this template provides a comprehensive overview of your agency's capabilities. It's perfect for showcasing case studies, market analysis, and future outlooks, helping you to build trust and establish credibility. Whether you're presenting a new project plan or updating clients on progress, this template ensures your information is communicated clearly and effectively. Fully customizable and compatible with PowerPoint, Keynote, and Google Slides, the Sky Drop template is your go-to for creating presentations that leave a lasting impact. Impress your audience and elevate your agency's brand with this powerful presentation tool!


6 slides
Vision-to-Execution Roadmap
Turn bold ideas into actionable plans with the Vision-to-Execution Roadmap Presentation. This circular, multi-phase layout helps you illustrate how strategic goals evolve into tangible results across five connected stages. Ideal for pitching initiatives, mapping transformation phases, or guiding teams from concept to completion. Fully customizable in PowerPoint, Keynote, and Google Slides.


8 slides
Social Media Engagement Report Presentation
Deliver impactful campaign reviews with the Social Media Engagement Report Presentation. This dynamic layout uses a megaphone visual to amplify your messaging and organize engagement data into four key segments. Perfect for tracking audience reactions, measuring reach, or presenting content performance. Compatible with PowerPoint, Keynote, and Google Slides for seamless customization.


6 slides
Pattern-Based Layouts Using Geometry
Present your process, timeline, or flow with clarity using the Pattern-Based Layouts Using Geometry Presentation. This clean, step-by-step format uses bold numbered icons and curved geometric blocks to guide viewers through five key stages. Ideal for sequential content, strategies, or workflows. Easily customizable in PowerPoint, Keynote, and Google Slides.


5 slides
Financial Credit Card Management Presentation
Present credit card processes, workflows, or customer engagement steps with this clean, step-by-step infographic layout. Featuring five clearly defined stages, icons, and space for key insights, it’s perfect for visualizing application journeys, fraud prevention, or usage optimization. Great for banks, fintech presentations, or financial coaching. Fully editable in PowerPoint, Keynote, and Google Slides.