


Features
- 4 Unique slides
- Fully editable and easy to edit in Microsoft Powerpoint, Keynote and Google Slides
- 16:9 widescreen layout
- Clean and professional designs
- Export to JPG, PDF or send by email


Do you have any questions?
Recommend


5 slides
Scrum Methodology for Product Development Presentation
Visualize each phase of your product development lifecycle using this Scrum methodology diagram. Highlight team roles, sprint cycles, and delivery steps with clear, color-coded sections. Ideal for Agile coaches, product managers, and tech teams. Fully editable in PowerPoint, Keynote, and Google Slides to align with your project planning needs.


6 slides
Environmental Scanning with PESTEL Model Presentation
Spot risks and opportunities early with the Environmental Scanning with PESTEL Model Presentation. Visually break down Political, Economic, Social, Technological, Environmental, and Legal factors using a modern, tree-style layout. Ideal for business forecasting, competitive analysis, or market entry reports. Easily customizable in PowerPoint, Canva, and Google Slides.


7 slides
Milestones Credit Card Infographic Presentation
A Milestones Infographic is a visual representation of significant events, accomplishments, or achievements in a project, business, or individual's life. This template include timelines, graphs, diagrams, and other visual elements to help convey important information. You can use this infographic to cover many different topics, including project management, business growth, personal achievements, or company history. This template is useful for businesses or individuals who want to showcase their accomplishments, highlight important dates or events, or just share progress updates.


23 slides
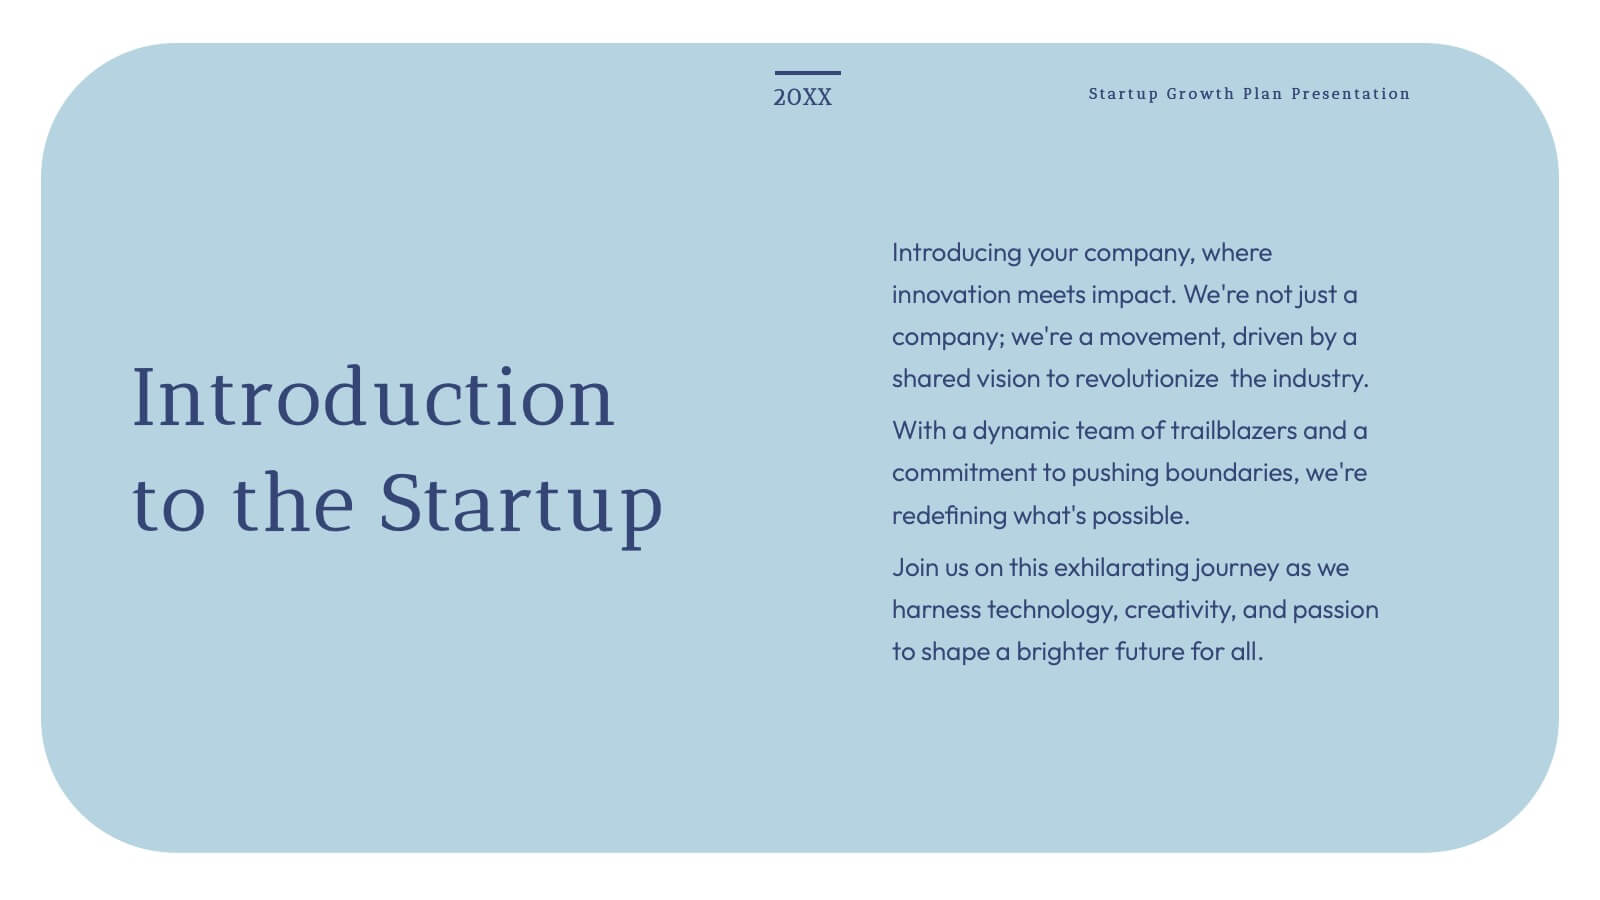
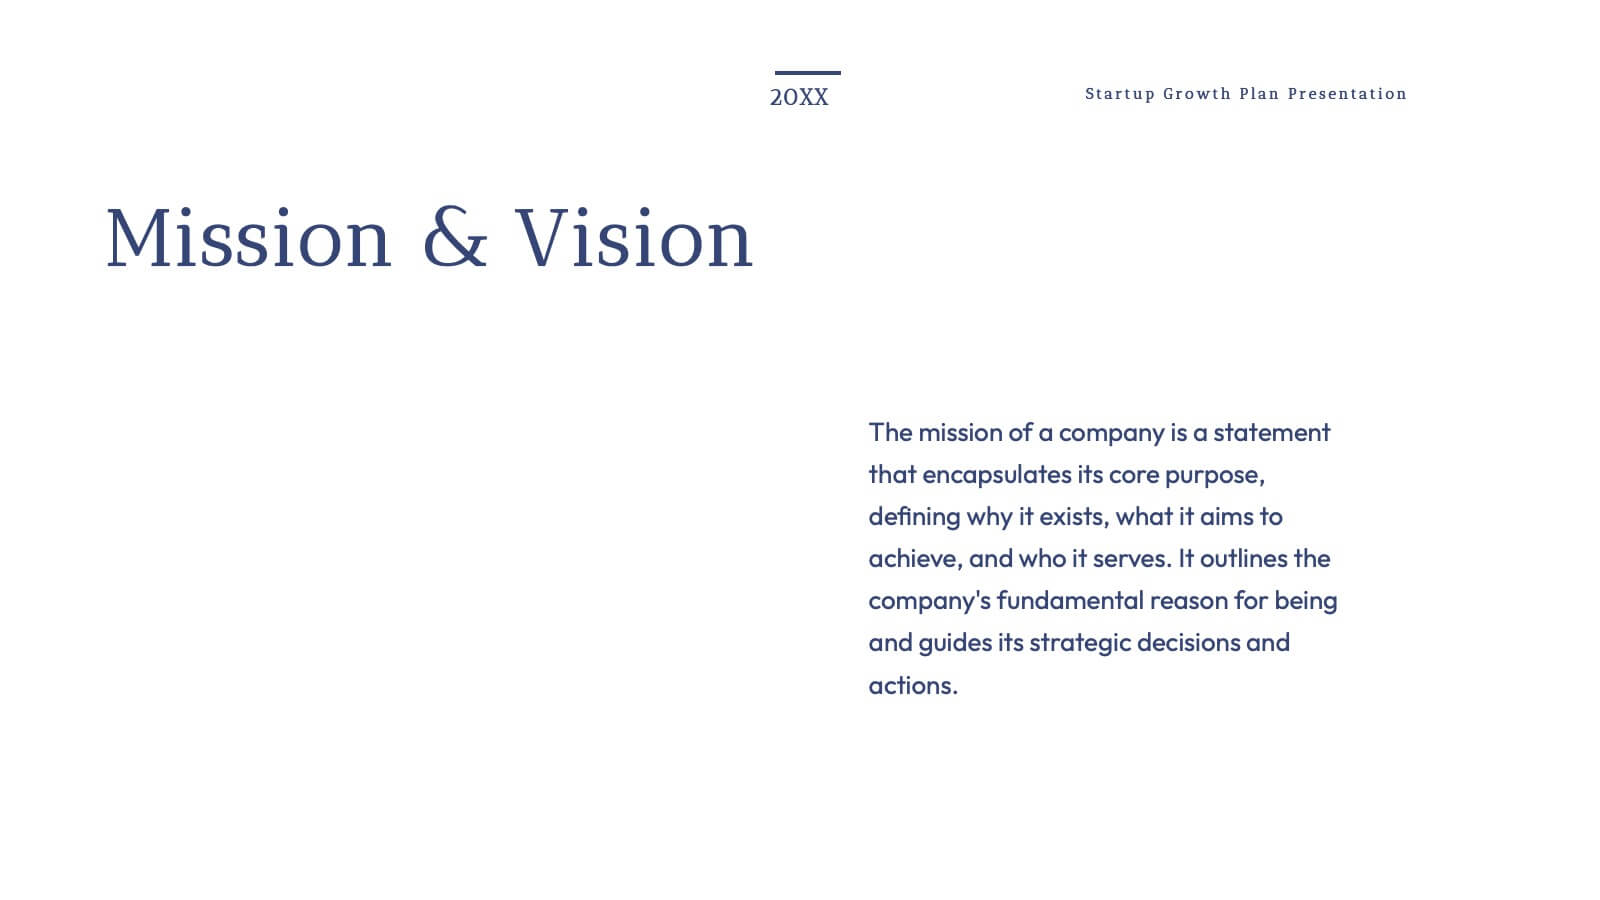
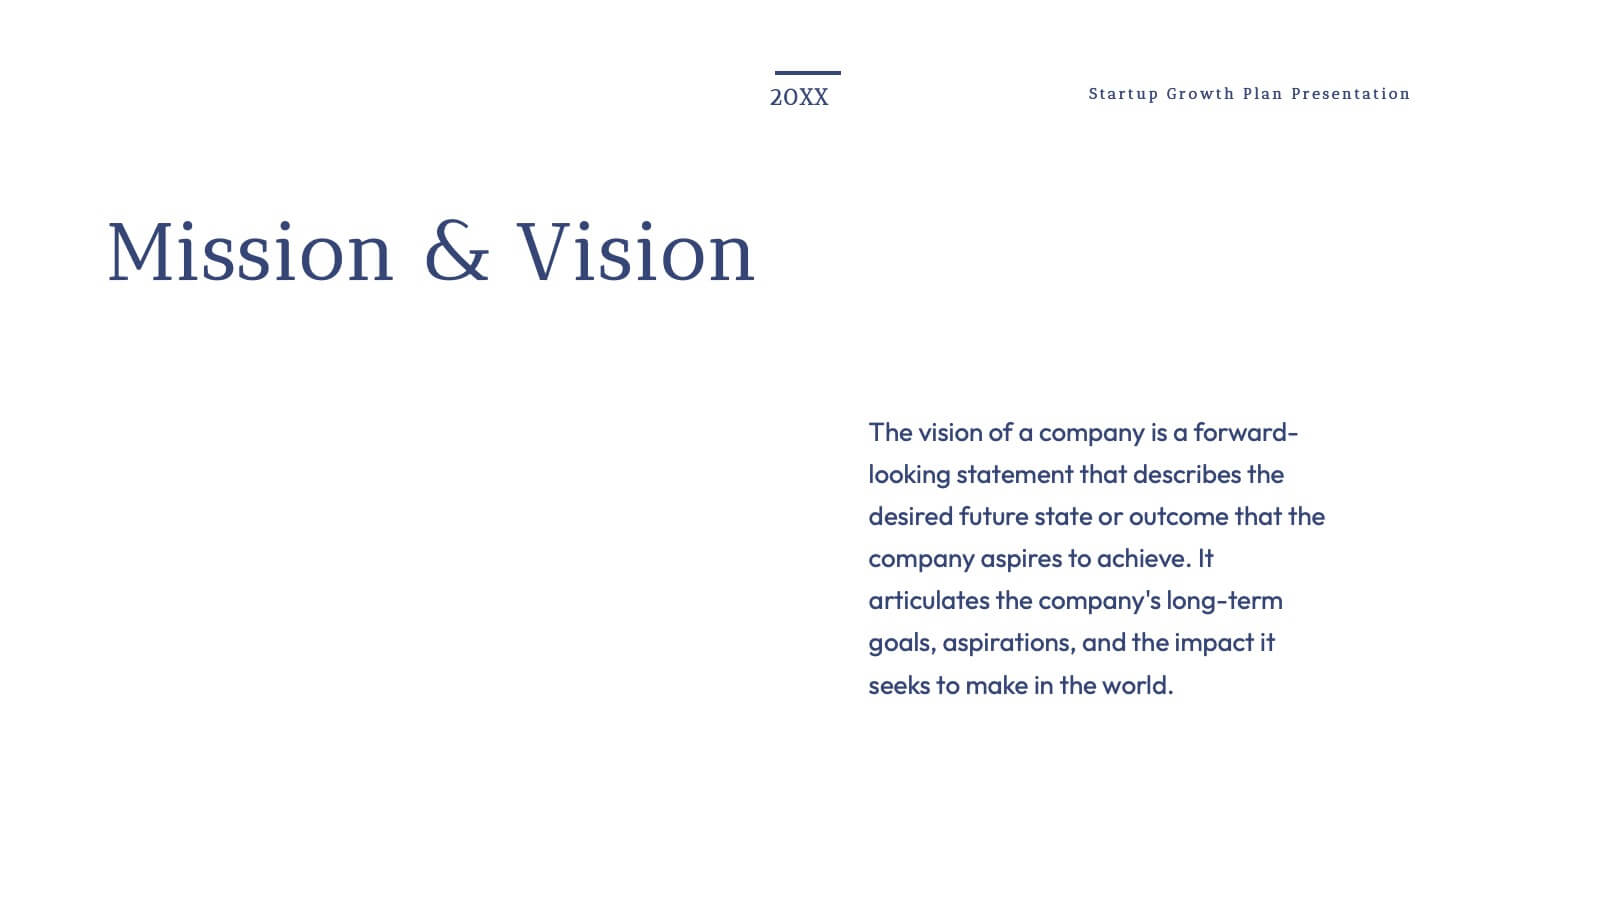
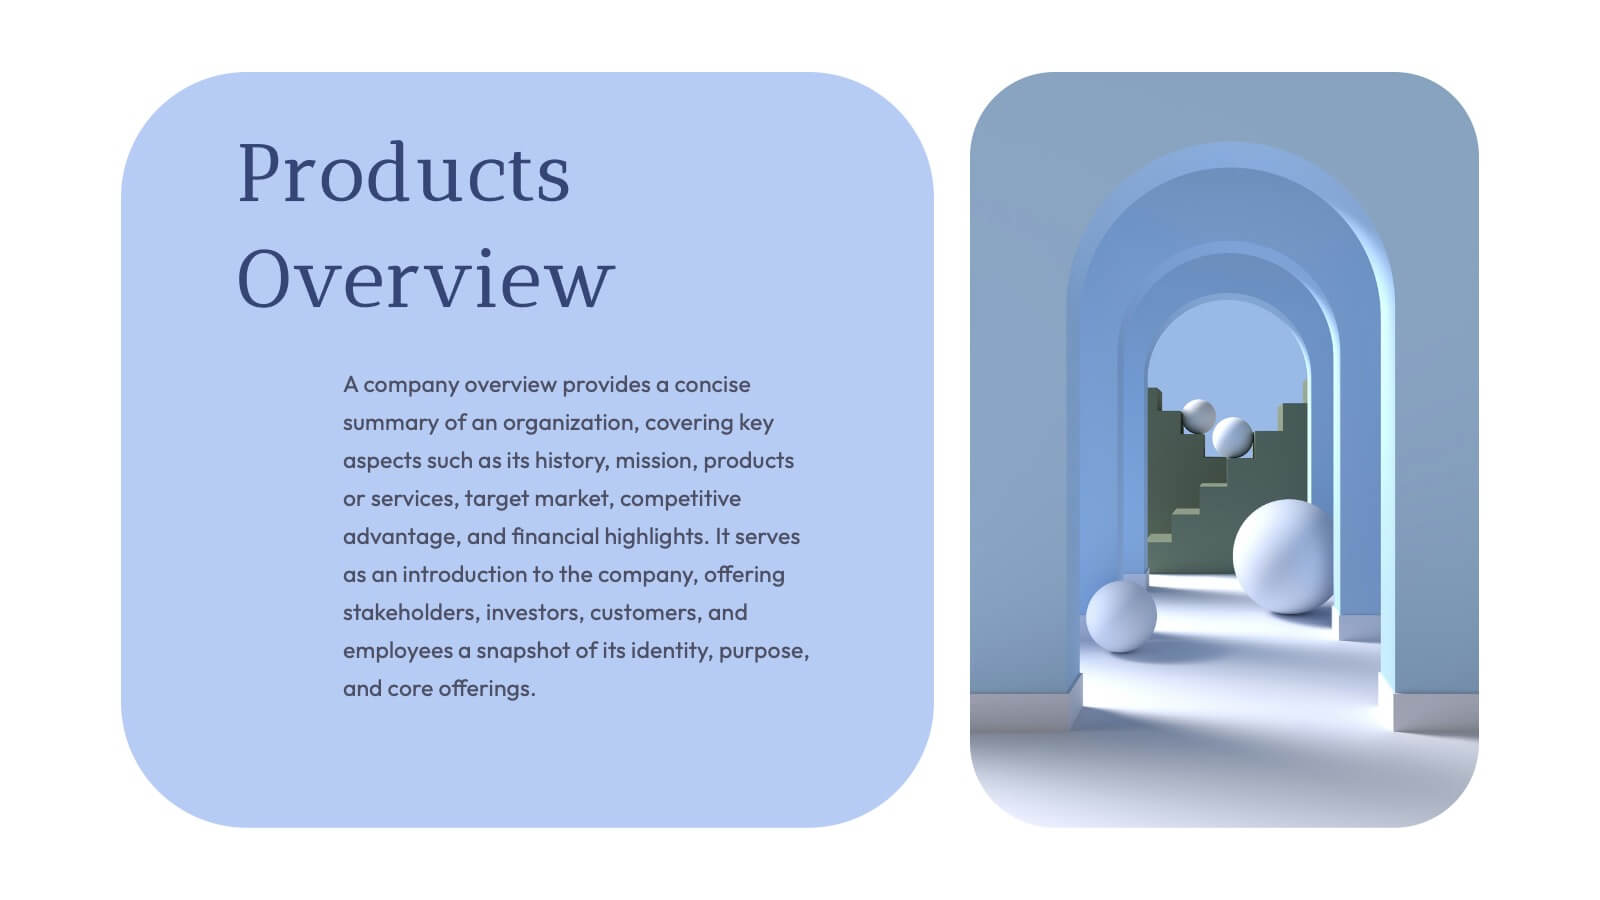
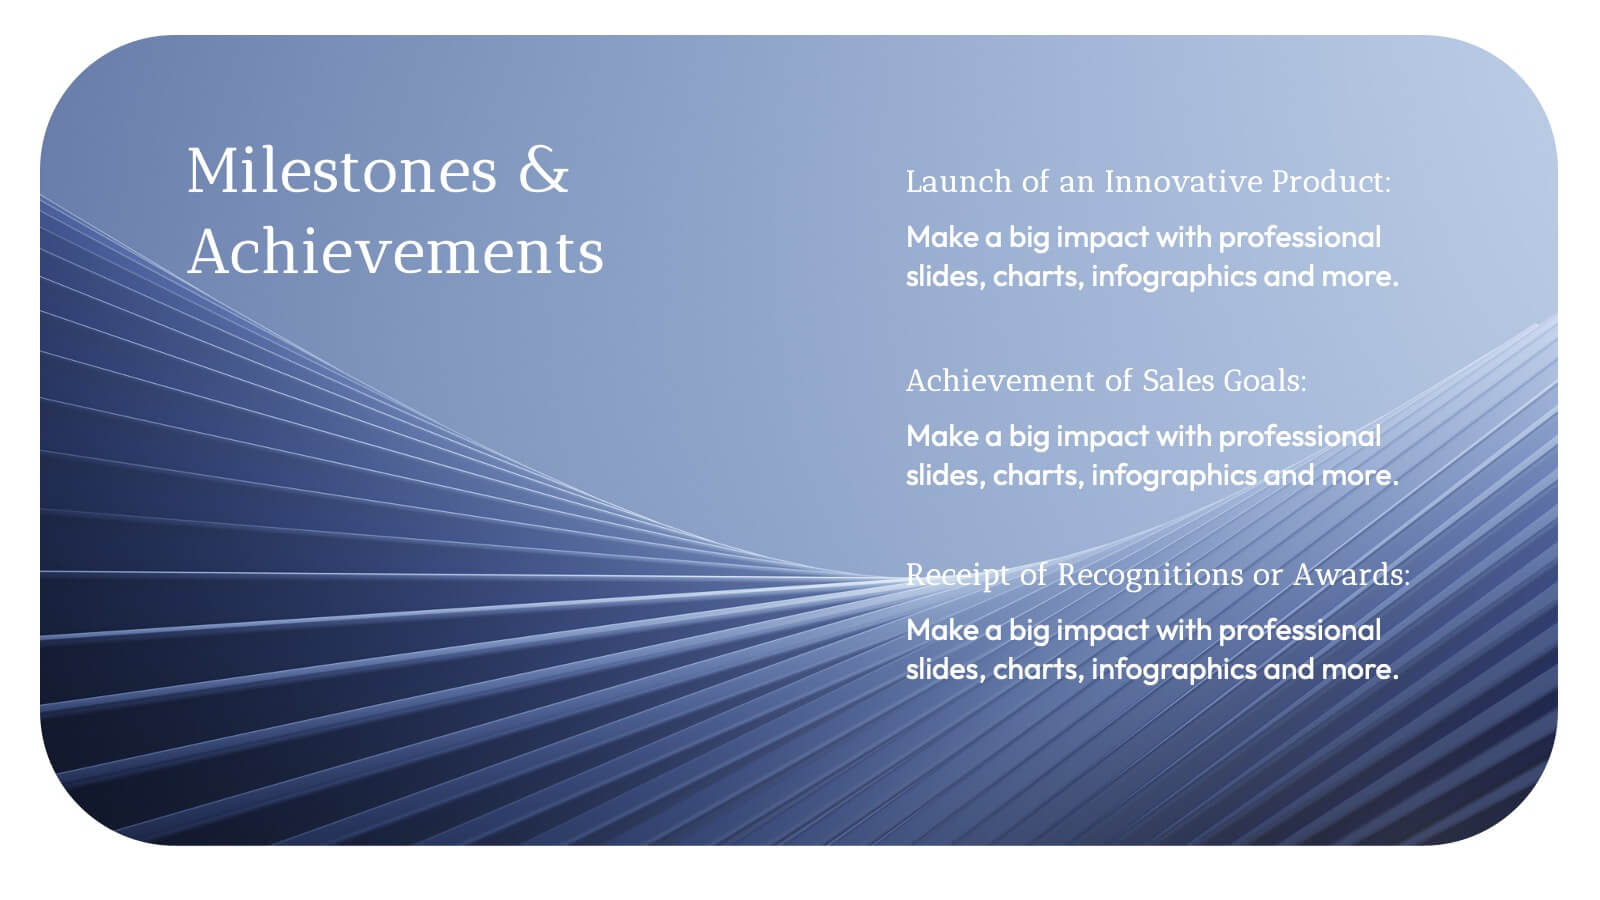
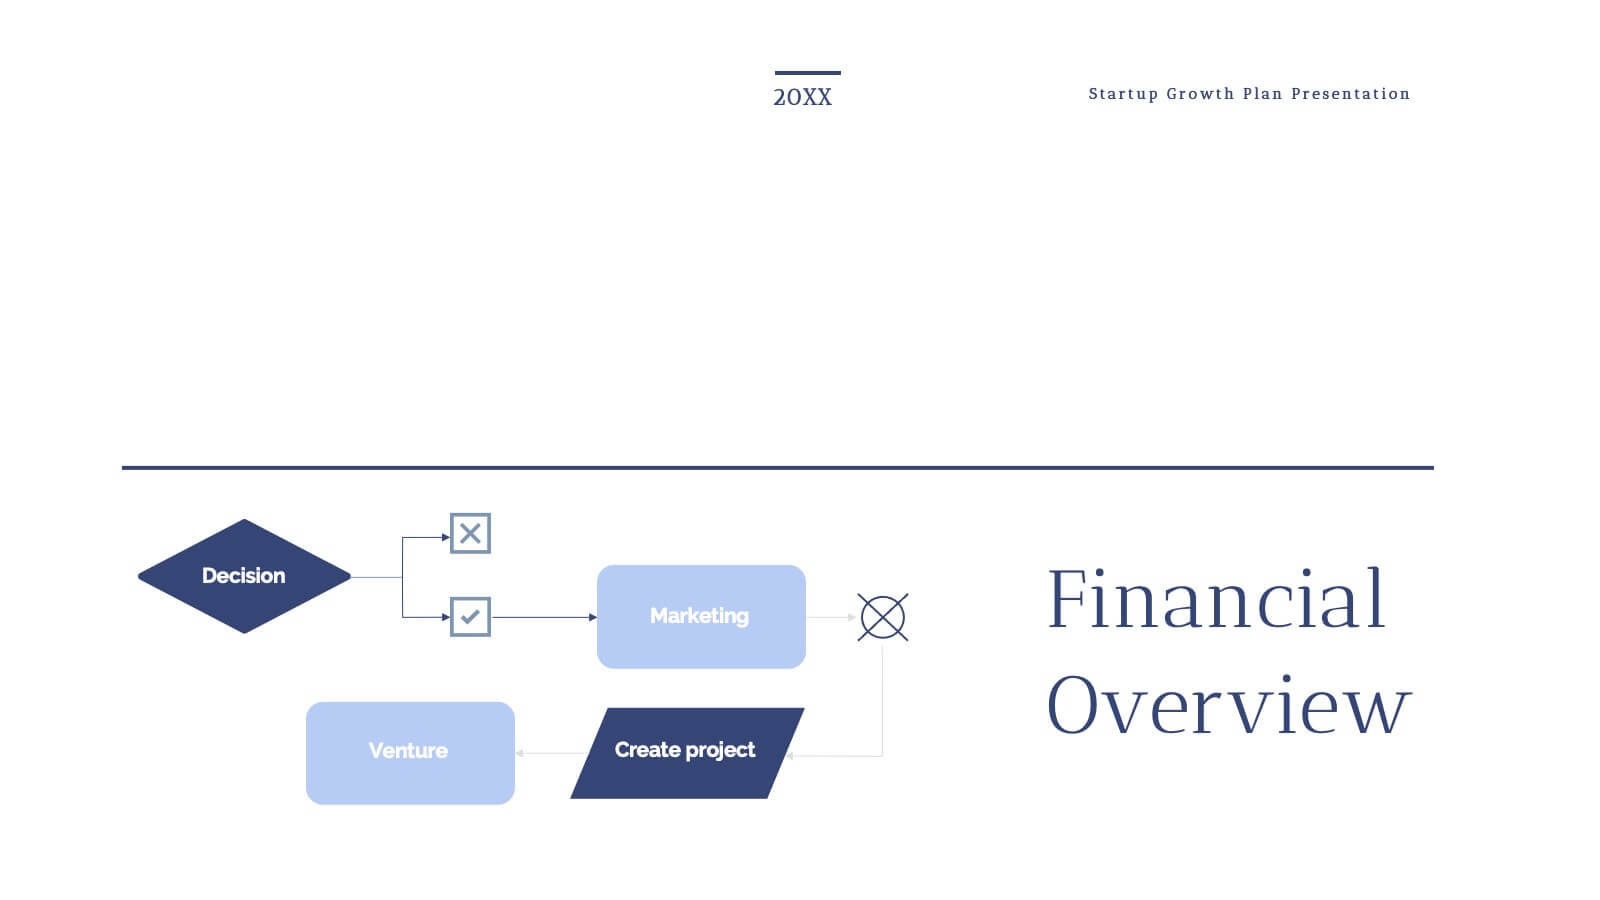
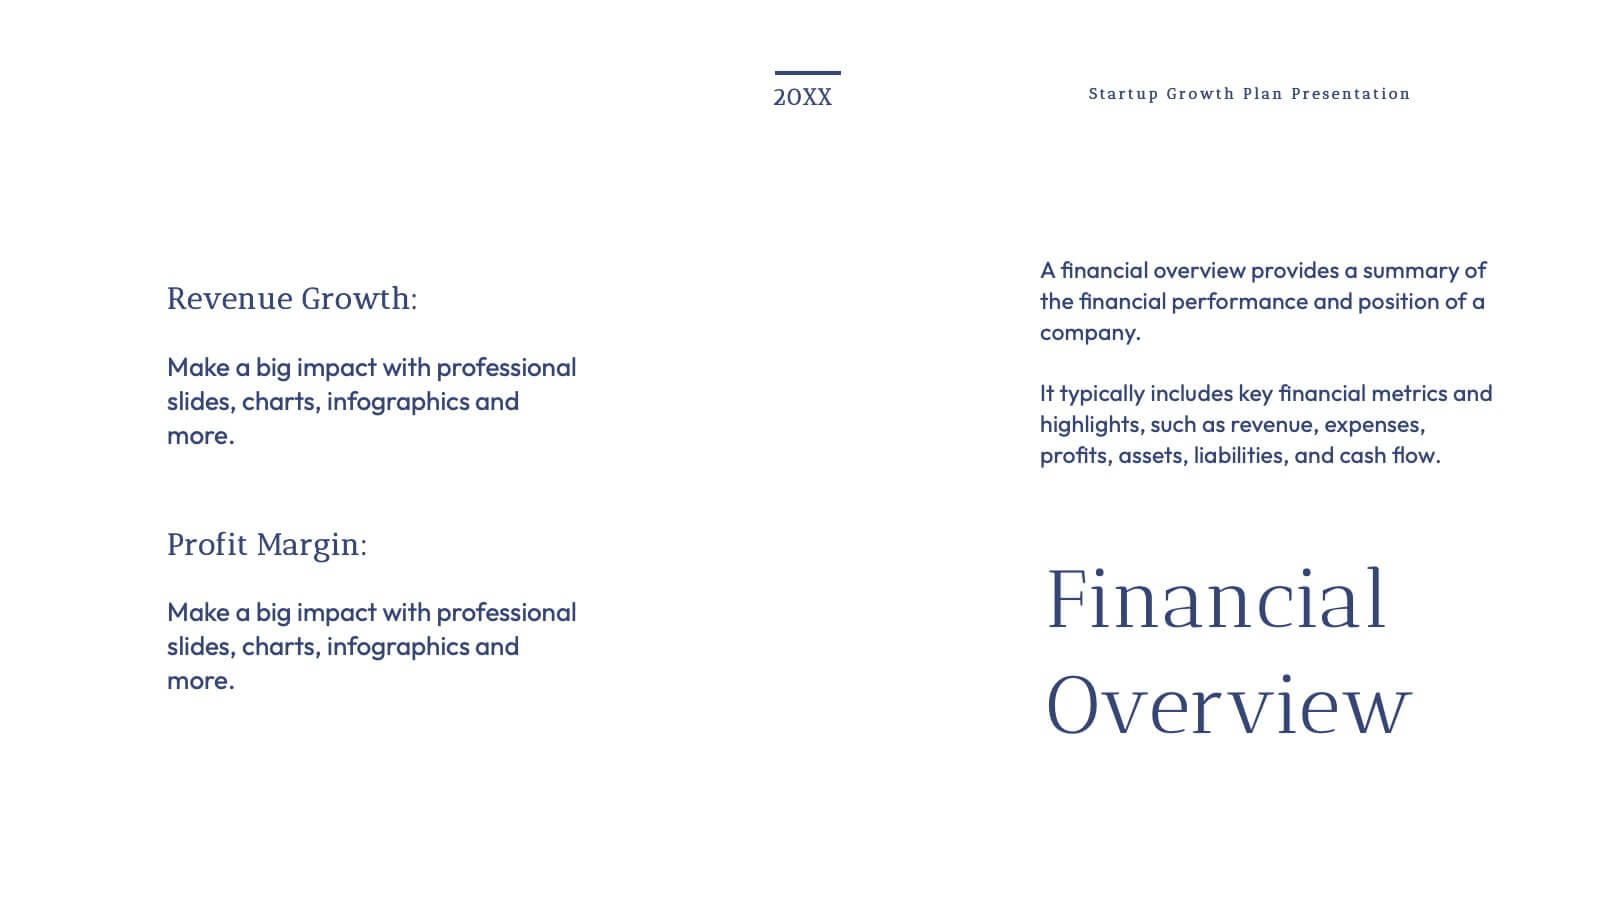
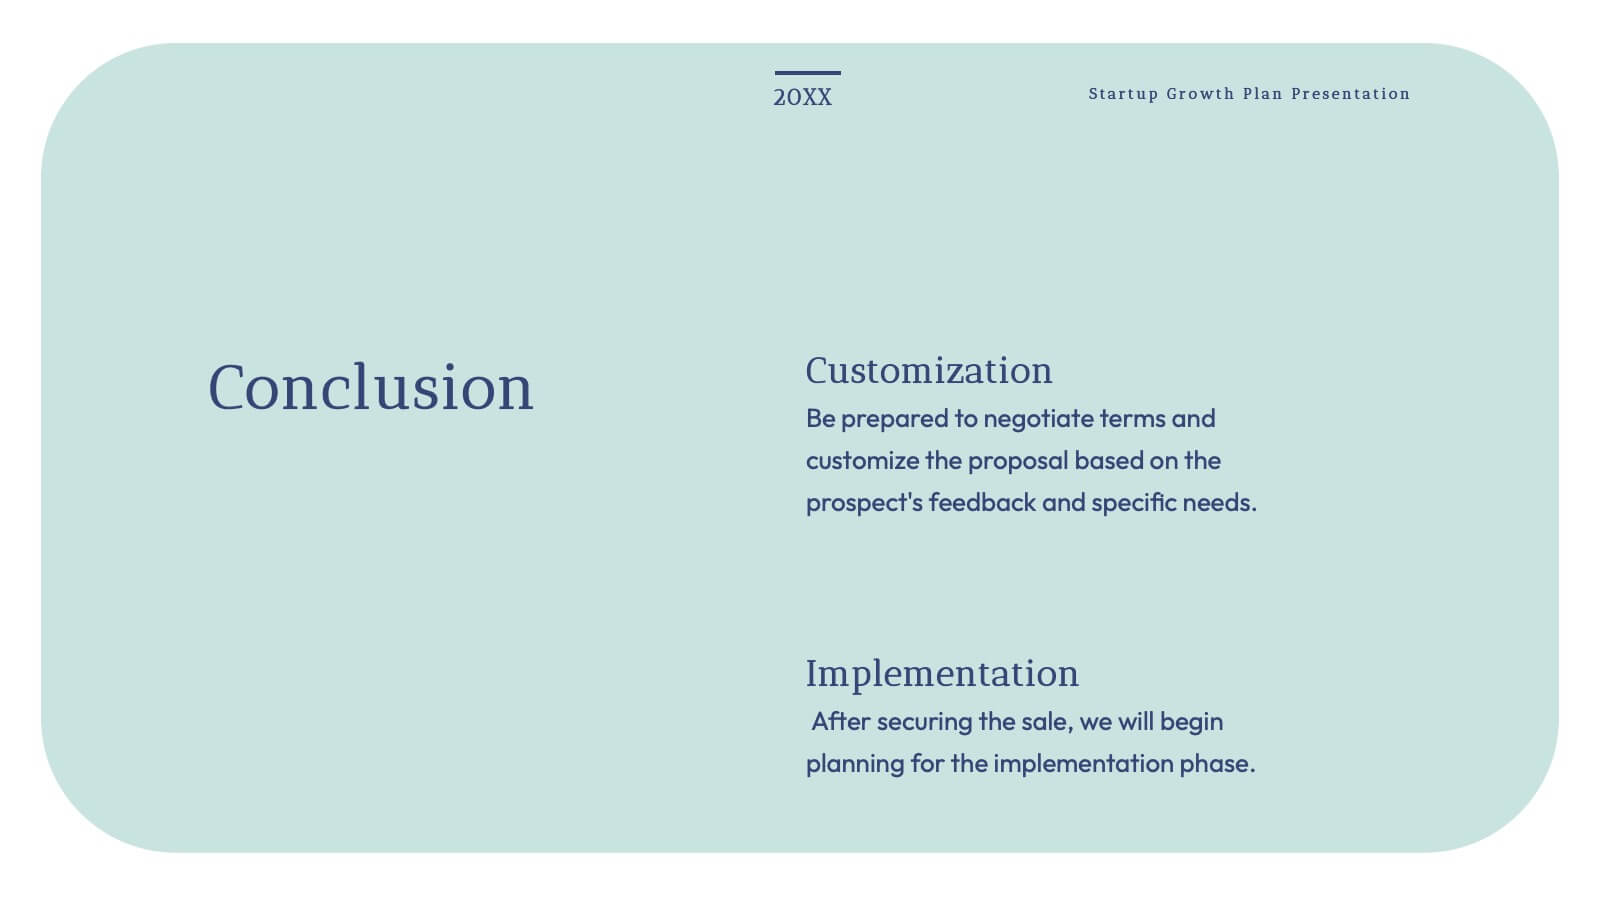
Grecian Startup Growth Plan Presentation
Elevate your pitch with this stunning Grecian-inspired presentation template, perfect for outlining your startup's growth plan! Showcase your business strategy, revenue projections, and scaling opportunities with a clean, elegant design that grabs attention. Impress investors and stakeholders with every slide. Compatible with PowerPoint, Keynote, and Google Slides for seamless customization.


5 slides
Risk Mitigation Strategies Presentation
Effectively identify, assess, and prevent risks before they escalate. This Risk Mitigation Strategies template offers a structured way to visualize potential risks, proactive responses, and resilience planning. Ideal for risk managers, business strategists, and decision-makers. Fully editable and compatible with PowerPoint, Keynote, and Google Slides for seamless integration into your workflow.


6 slides
North America Market Map Infographic
North America is the third largest continent in the world and home to over 50 countries, with a population of over 400 million. This infographic template is designed to show you where each country is located within North America, as well as its population, annual GDP per capita, and other important data points that make it unique. This template is the perfect tool for navigating the international market. This infographic map allows you to get a bird's eye view of how your business is performing across the region, and what areas need more attention. Fully customizable and compatible with Powerpoint, Keynote, and Google Slides.


2 slides
Office Interview Scenes Illustrations
Elevate your Interview experience with our office interview scenes illustrations pack! This is a burst of high-energy and lightheartedness that infuses the often nerve-wracking interview process with a touch of excitement and fun. These illustrations seamlessly fit into PowerPoint, Google Slides, and Keynote. Add a splash of color and playfulness to the serious nature of interviews, creating an environment where both interviewers and candidates can feel at ease!


5 slides
Step-by-Step Flow Diagram Presentation
Bring clarity to every stage of your process with a clean, easy-to-follow visual path that guides your audience step by step. This presentation helps simplify workflows, instructions, and project milestones in a structured, approachable layout. Fully compatible with PowerPoint, Keynote, and Google Slides.


5 slides
Iceberg Chart Template Infographics
Navigate the depths beneath the surface with the iceberg chart template infographics. This resource, bathed in varying shades of blue, captures the essence of uncovering hidden data, much like an iceberg reveals only a fraction of its mass above water. Professionals across diverse sectors, including business analysts and educators, will find value in this creative, ice-themed vertical template. It's especially beneficial for presentations aiming to explore beneath-the-surface dynamics, or unseen risks. The template is complete with customizable graphics, icons, and image placeholders, structured to visually break down complex concepts into digestible information.


6 slides
Porter’s Value Chain Analysis Presentation
Give your strategy story a powerful lift with a clean visual layout that makes every activity in your organization feel connected and purposeful. This presentation explains primary and support processes in a way that helps teams identify strengths, gaps, and opportunities for improvement. Fully compatible with PowerPoint, Keynote, and Google Slides.


6 slides
Community Network Infographic
A community network is a localized, often root-driven, communication infrastructure that connects individuals, organizations, and institutions within a specific geographical area or community. This Infographic template visually represents the connections, relationships, and interactions within a community, often focusing on its members, resources, and activities. This template is a powerful way to showcase the dynamics and vitality of a community. This highlights the central theme or purpose of the community at the center of the infographic. This is fully customizable and compatible with Powerpoint, Keynote, and Google Slides.


6 slides
Financial Forecasting and Numerical Analysis Presentation
Visualize your financial insights with clarity using this clean and modern bar chart template. Designed for presenting financial projections, budget analysis, and performance metrics, this slide breaks down six key categories for easy comparison. Ideal for financial reviews, business updates, or investment pitches. Fully editable in PowerPoint, Keynote, and Google Slides.


34 slides
Unicorn Startup
A Pitch Deck is a visual presentation typically used by startups or entrepreneurs to convey their business idea, product, or service to potential investors, partners, or other stakeholders. This template slide deck is designed to provide a compelling overview of the key elements of a business, and is designed to captivate your audience's attention and generate interest in your venture. This template is designed with a trendy and modern pink color palette, perfect for businesses with a feminine or youthful brand identity. It features a variety of customizable slides that can be tailored to showcase your startup's key information and unique value proposition.


4 slides
HR Management Strategy Presentation
An engaging, structured design that turns complex planning into a clear, visual story. This presentation guides audiences through essential strategic steps, helping teams understand goals, processes, and people-centered initiatives with ease. Clean icons and modern layouts keep every point focused and professional. Fully compatible with PowerPoint, Keynote, and Google Slides.


8 slides
Social Media Engagement Metrics
Track engagement with clarity using the Social Media Engagement Metrics Presentation. This layout features a smartphone mockup at the center, with four vertically stacked icons representing key engagement indicators. Surrounding the device, space is allocated for concise data insights or definitions labeled A through D. Perfect for presenting analytics like likes, shares, comments, and reach. Fully editable in PowerPoint, Keynote, and Google Slides.


4 slides
Financial Report Presentation
Enhance your financial presentations with our "Financial Report Presentation" template. Designed for clarity and visual impact, this infographic features a stylized financial bag icon segmented into color-coded sections, each representing a different financial metric such as revenue, expenses, profits, and investments. This creative visual structure allows for a clear and segmented display of your company's financial health, making complex data easily understandable. Ideal for financial analysts, corporate presentations, and investor meetings, this template ensures key financial insights are communicated effectively and efficiently. Compatible with PowerPoint, Keynote, and Google Slides, it's an essential tool for delivering detailed and precise financial reports.


6 slides
Threat and Mitigation Bowtie Model
Break down complex threats and responses with the Threat and Mitigation Bowtie Model Presentation. This infographic visualizes the relationship between root causes, a central hazard event, and its potential consequences—alongside the controls that mitigate them. Clean, editable layouts and multiple visual states let you emphasize either side of the bowtie. Ideal for risk assessments, business continuity planning, and safety presentations. Compatible with PowerPoint, Keynote, and Google Slides.