


Features
- 5 Unique slides
- Fully editable and easy to edit in Microsoft Powerpoint, Keynote and Google Slides
- 16:9 widescreen layout
- Clean and professional designs
- Export to JPG, PDF or send by email


Do you have any questions?
Recommend


5 slides
Music Eras Infographics
Music history is often divided into distinct eras or periods based on the characteristics and predominant styles of music during specific time periods. These infographic templates are designed to present a chronological overview of significant musical periods, highlighting their characteristics, key composers, notable genres, and major developments. These templates serves as a comprehensive visual guide to help audiences understand the evolution of music throughout history. This template provides a captivating overview of the major music eras, allowing viewers to appreciate the distinct characteristics and contributions of each period.


7 slides
Processed Food Infographic
Indulge in the intricate world of processed foods with our meticulously crafted infographic. Garnished in a palate of clean white and bold red, this template offers a delectable insight into how our everyday foods transition from raw ingredients to the final product on supermarket shelves. Compatible with Powerpoint, Keynote, and Google Slides, our template offers detailed graphics, intuitive icons, and straightforward image placeholders that dive deep into the realm of processed foods. This is a must-have for nutritionists, dieticians, food bloggers, or any individual keen on educating others about the nuances of processed foods in our daily diet.


26 slides
Quantum Computing Presentation
Step into the future of technology with this fascinating presentation on quantum computing. Covering key concepts like quantum bits, superposition, entanglement, and real-world applications, this template helps simplify complex ideas for any audience. Fully customizable and compatible with PowerPoint, Keynote, and Google Slides for a seamless and insightful presentation experience.


6 slides
Progressive Work From Home Infographics
The "Progressive Work From Home" infographic template is an essential tool for today's evolving workplace. Compatible with PowerPoint, Keynote, and Google Slides, this template is designed for managers, team leaders, and organizations embracing the remote work model. This innovative template features essential elements of remote working, including tools for virtual collaboration, productivity metrics, and strategies for maintaining team cohesion. It's crafted to help you effectively communicate the benefits and best practices of remote work, making it invaluable for presentations aimed at optimizing work-from-home policies and procedures. The design is sleek and modern, with a color scheme that is both professional and uplifting. It embodies the flexibility and efficiency of remote work, making your presentation not just informative but also inspiring. Whether you're discussing remote work strategies with your team, presenting to management, or conducting a workshop, this template will ensure your message is clear, concise, and impactful.


7 slides
Breast Cancer Stages Infographic
The Breast Cancer Stages infographic template is designed to educate and inform about the different stages of breast cancer in a visually engaging and clear manner. The template, compatible with PowerPoint, Google Slides, and Keynote, features a variety of diagram styles such as percentage charts, stage progressions, and anatomical illustrations. It uses a soft color palette of pinks and whites, which is sympathetic to the subject matter. Each slide is carefully constructed to convey essential information about the stages of breast cancer, recommended screenings, and treatment methods. This template is an excellent resource for healthcare professionals, and advocacy groups looking to raise awareness and provide education on breast cancer.


6 slides
Internal Communication Framework Presentation
Foster stronger collaboration with this visual internal communication framework template. Ideal for showcasing how information flows within departments, this layout helps clarify messaging channels, responsibilities, and feedback loops. Whether you're streamlining communication strategies or presenting team structures, it’s fully editable and works seamlessly with PowerPoint, Keynote, and Google Slides.


6 slides
Wellness Program and Health Strategy Presentation
Bring your strategy to life with this clean and creative visual! This presentation template uses a six-part flower design to help you showcase your wellness goals, health strategies, or program pillars with clarity and balance. It’s fully editable and works perfectly in PowerPoint, Keynote, and Google Slides for flexible customization.


20 slides
Windsong Sales Proposal Presentation
Craft a persuasive sales proposal with this sleek and professional template. Perfectly suited for communicating your value proposition, this design includes slides for introductions, company overviews, and a detailed service summary. Address critical business factors with sections for target markets, competitive analysis, and clearly defined sales objectives. Highlight your sales process, showcase the team's expertise, and build trust through customer testimonials. Dedicated slides for pricing strategies, promotions, and discounts allow you to present a compelling financial offer. Wrap up with an actionable next steps plan and a feedback section to reinforce client engagement. Fully customizable and compatible with PowerPoint, Google Slides, and Keynote, this template combines modern design with functional layouts to ensure your proposal stands out. Ideal for creating a lasting impression.


7 slides
KPI Software Dashboard Infographic
Maximize the effectiveness of your performance analysis with our KPI Software Dashboard infographic, optimized for use in Powerpoint, Keynote, and Google Slides. This dynamic infographic is an indispensable tool for business analysts, project managers, and data-driven professionals seeking to present key performance indicators (KPIs) in an insightful and engaging manner. Our KPI Software Dashboard infographic offers a clear, visual representation of critical data points that influence business decisions. With its diverse array of charts, graphs, and meters, it provides an at-a-glance overview of company performance across various metrics. The design is tailored to enhance readability and comprehension, allowing your audience to quickly grasp complex data trends and patterns. Whether you're reviewing sales figures, monitoring customer satisfaction, or tracking project progress, this infographic is designed to streamline the presentation of your data. The compatibility with popular presentation platforms ensures a smooth integration into your slide deck, making it a breeze to communicate the insights that matter. Utilize this infographic to turn your KPI data into compelling narratives that drive strategic business actions.


7 slides
Side-by-Side Feature Comparison Presentation
Clearly showcase differences across multiple categories with this Side-by-Side Feature Comparison Presentation. Designed with a visual grid system and bold colors, it's perfect for highlighting product or service variations at a glance. Fully customizable in PowerPoint, Keynote, and Google Slides.


13 slides
Simple Sales Proposal Presentation
This proposal template provides a streamlined approach for presenting sales strategies and solutions. Starting with a visually striking cover slide, it sets the scene for an engaging pitch. The template meticulously organizes content from the initial problem identification to the presentation of real numbers that underscore the proposal's validity. Each section, from the elucidation of the problem to the detailed solutions and real-world case studies, is laid out for maximum impact and understanding. Personable touches are incorporated through the 'Meet Our Team' segment, bolstering the proposal with credibility. The template culminates with a strong call to action, urging the audience to seize the collaborative opportunity, and is rounded off with a polite 'Thank You' to leave a lasting impression. This template is a boon for sales professionals seeking to communicate their value proposition with clarity and persuasiveness.


21 slides
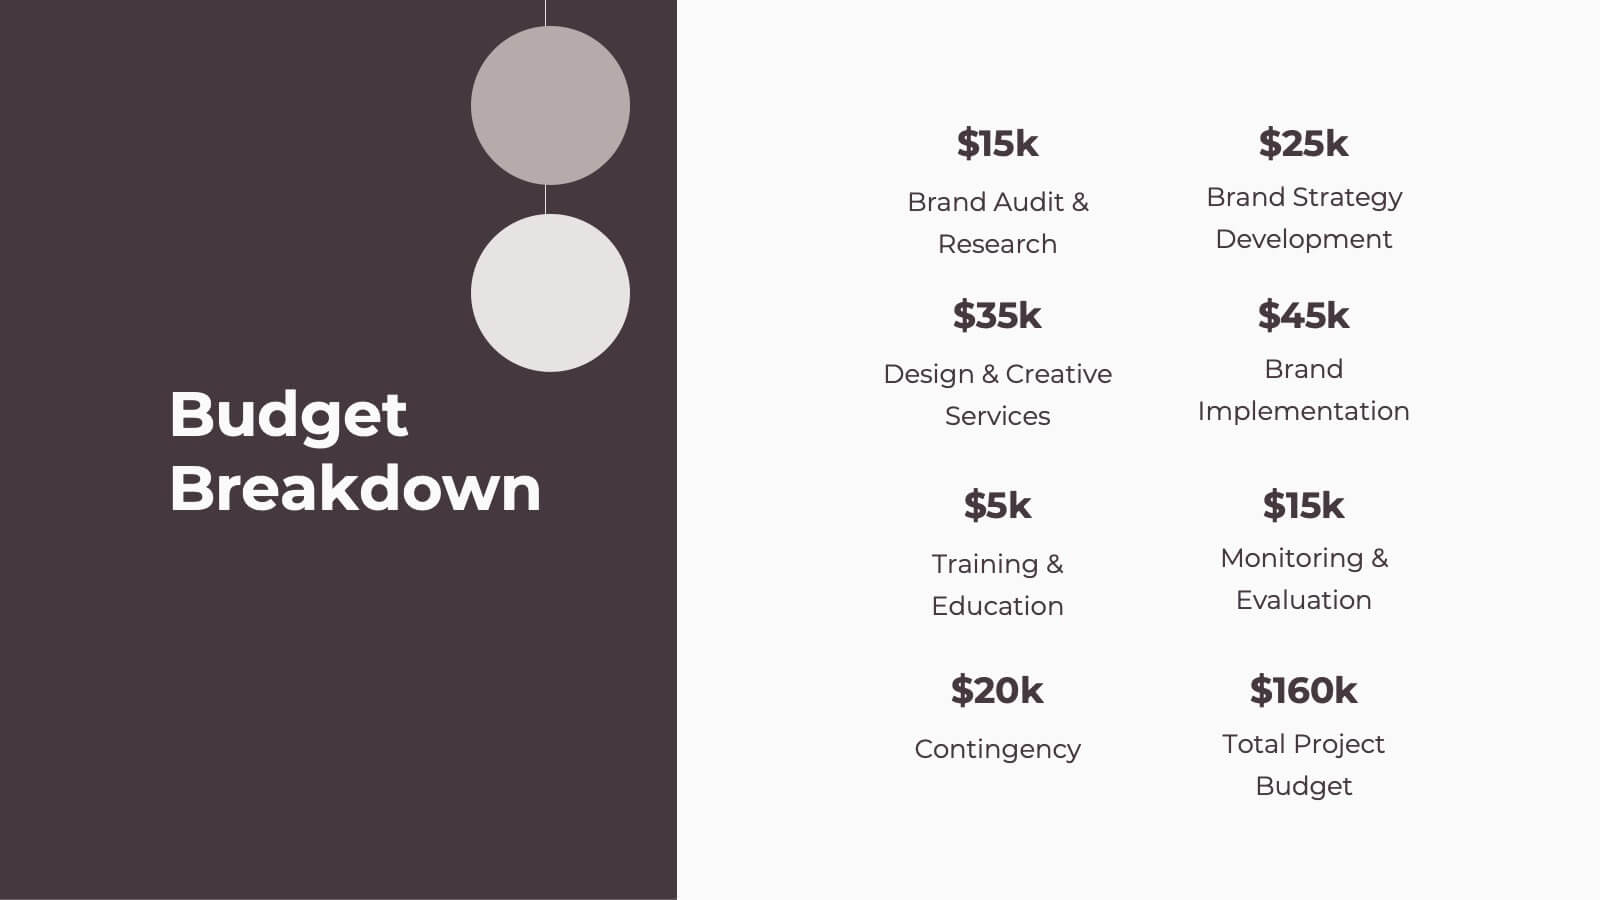
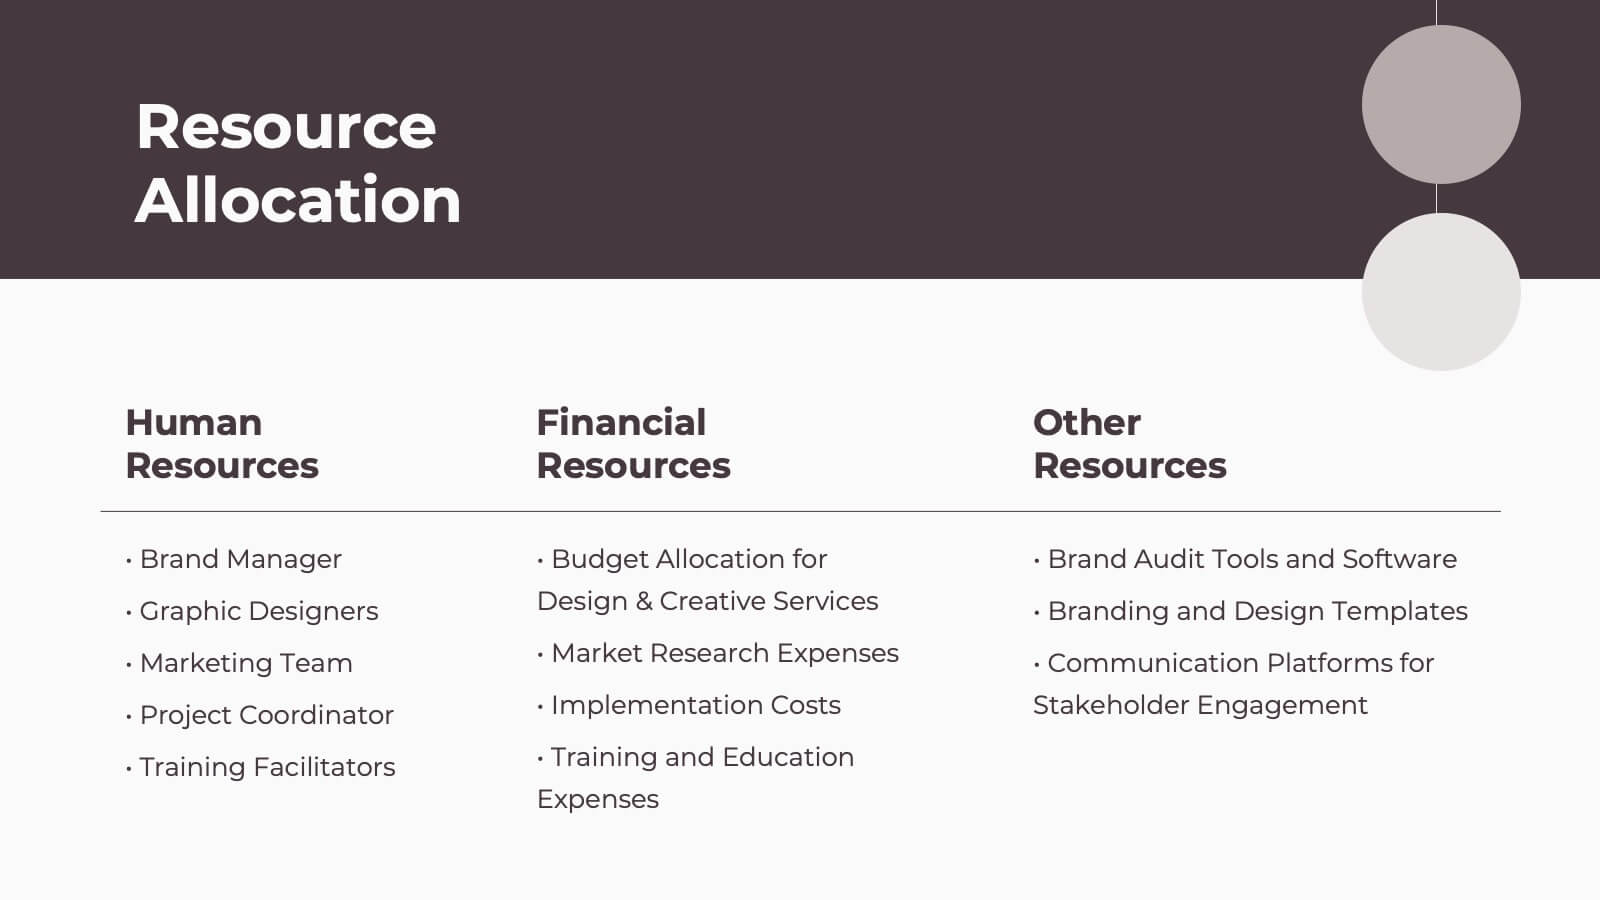
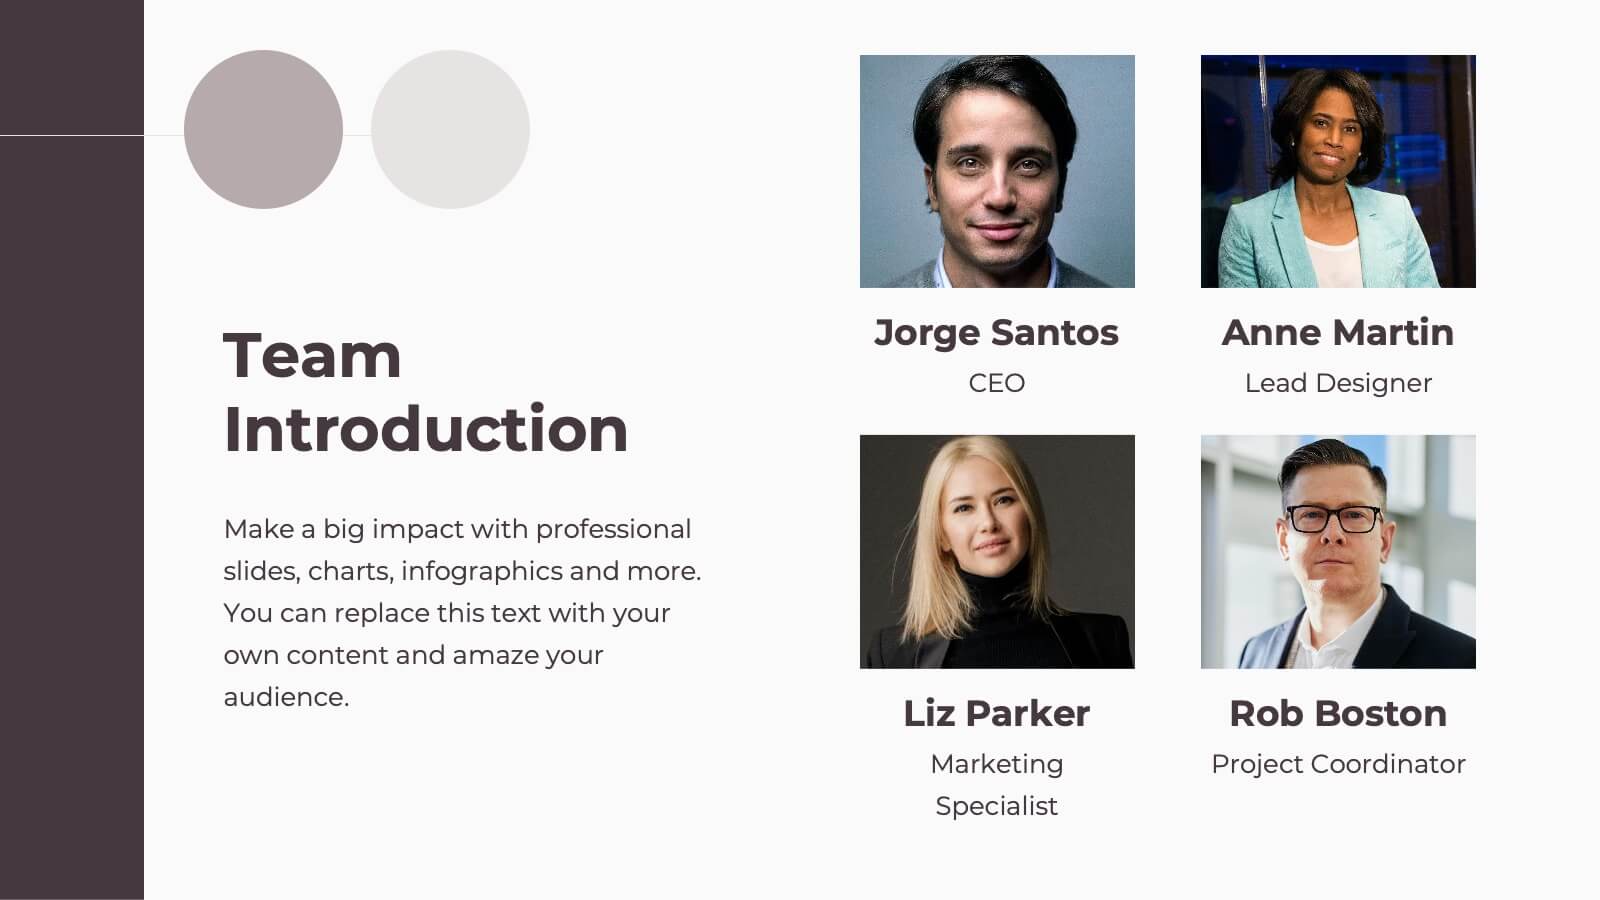
Spectrum Project Timeline Presentation
Plan and execute your projects with precision using this detailed project plan template! Perfect for outlining objectives, timelines, and resource allocation. Ideal for project managers and teams aiming to ensure successful project delivery. Compatible with PowerPoint, Keynote, and Google Slides, this template keeps your project organized, clear, and on track. Ensure project success!


6 slides
Business Flow Chart Design Presentation
Bring clarity and momentum to your process with a clean, visual layout that turns complex steps into an easy-to-follow flow. This presentation helps teams map stages, responsibilities, and progress with confidence, making it perfect for planning, strategy, and operations. Fully compatible with PowerPoint, Keynote, and Google Slides.


7 slides
South America Population Infographic Presentation
A South America map infographic is a visual representation of the continent of South America, highlighting its geography, population, culture, history, and other relevant information. Use this template as a graphic representation of South America that combines text, data, and images in an informative way. This infographic can be designed in different styles and formats, including political maps, physical maps, topographic maps, population density maps, and climate maps. You can also include information about major cities, landmarks, natural resources, and cultural traditions.

18 slides
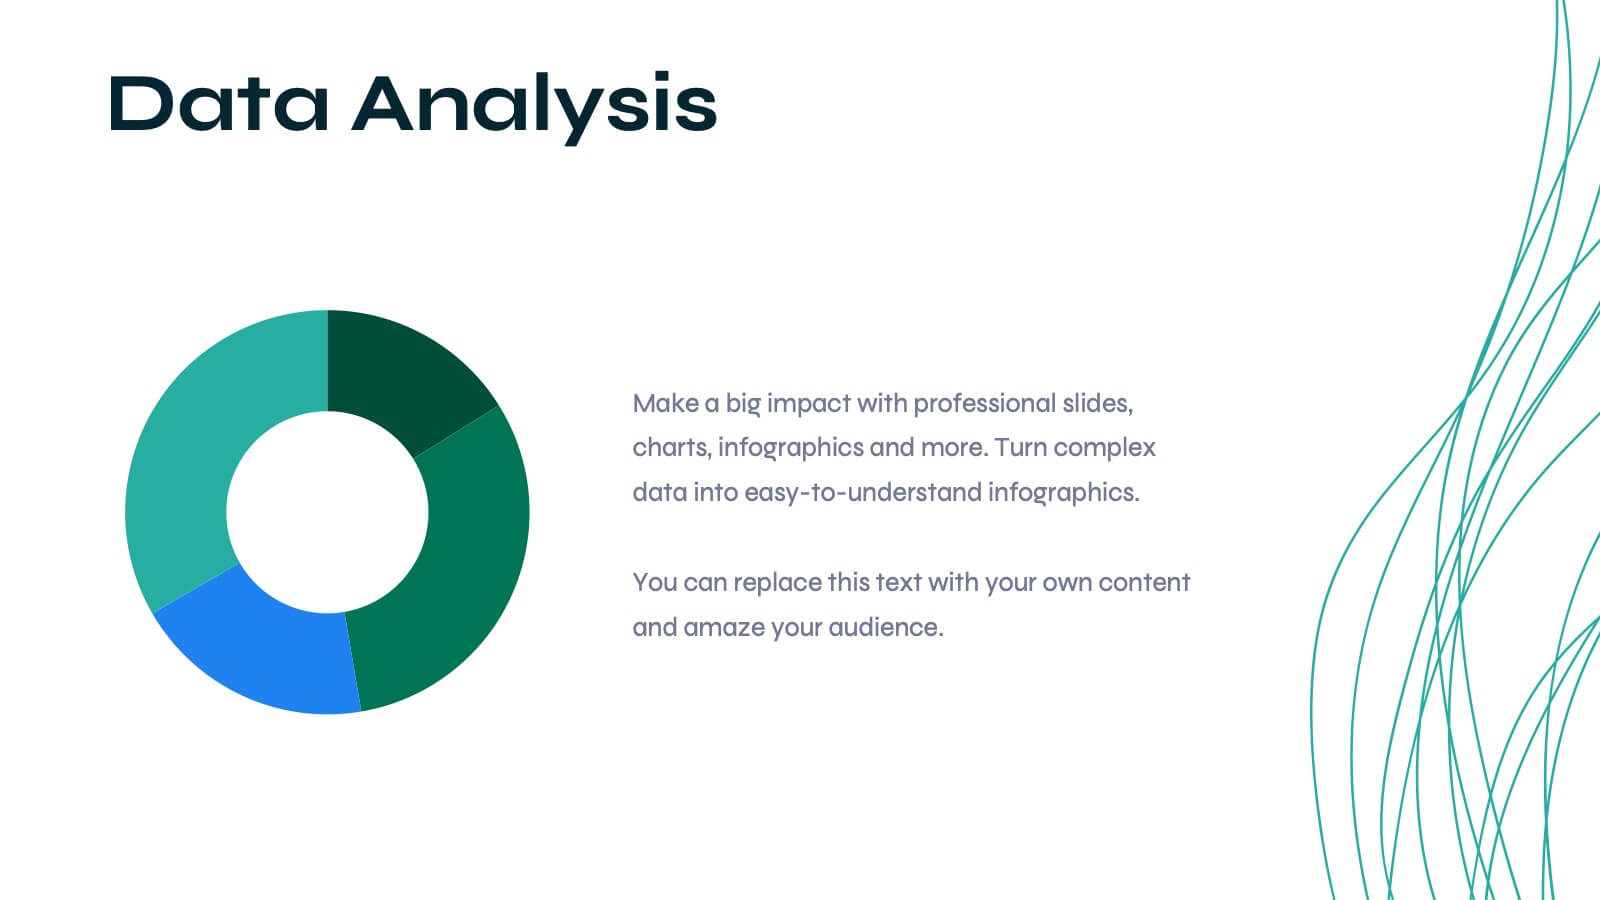
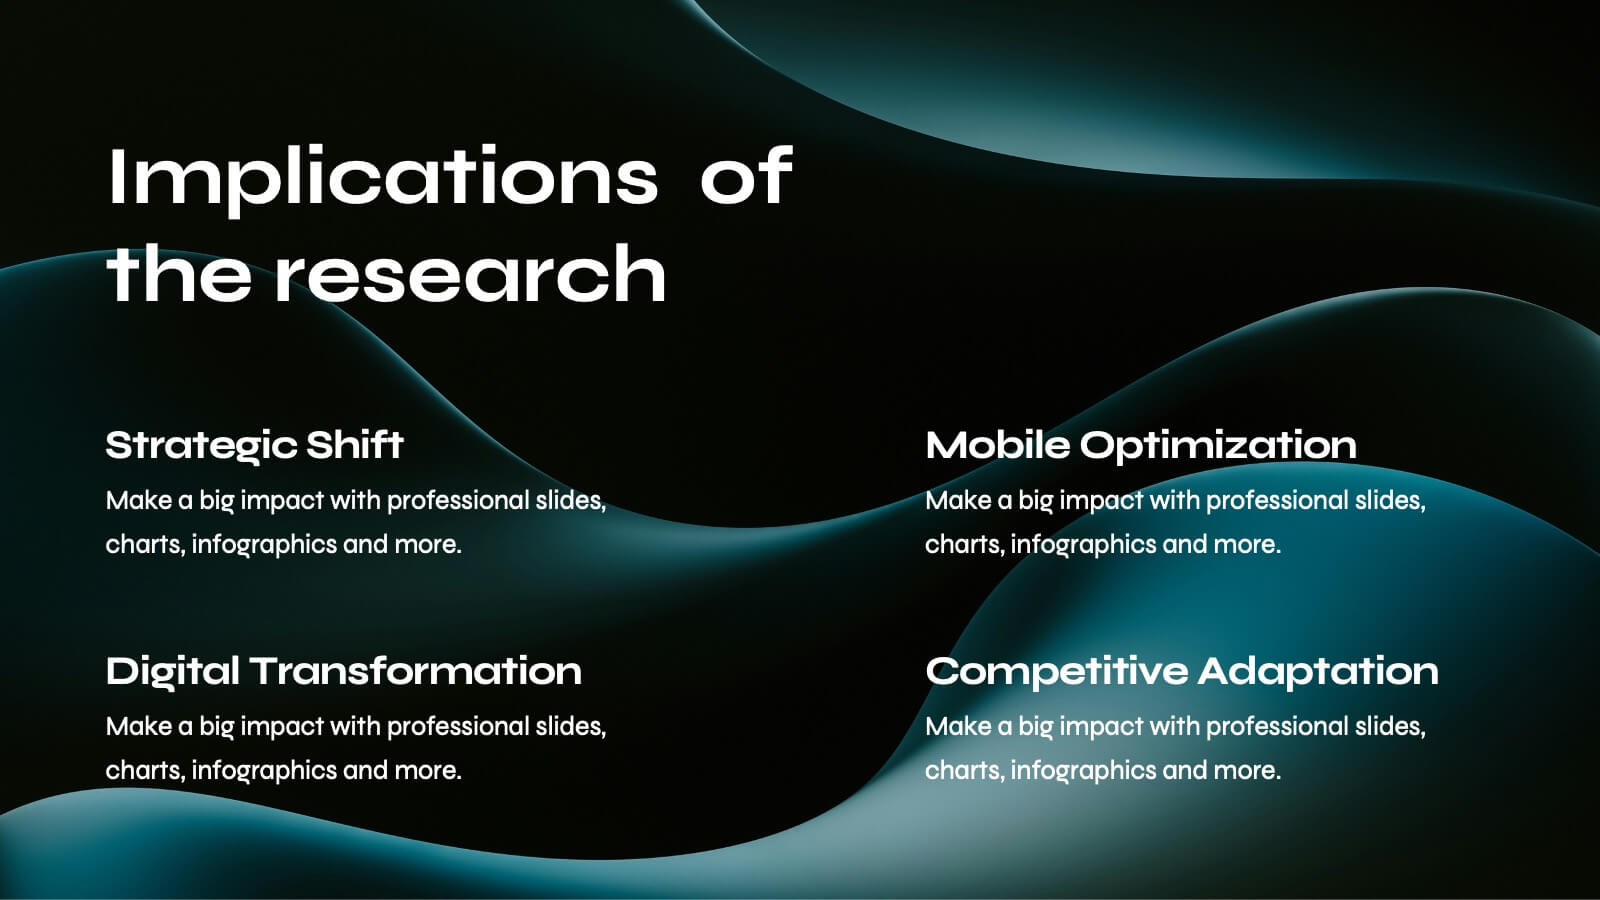
Pinnacle Academic Research Report Presentation
Present your academic research with style and precision using this comprehensive template. It covers everything from research objectives to key findings and recommendations. Perfect for making your data clear and engaging. Compatible with PowerPoint, Keynote, and Google Slides, it ensures your research is presented professionally and effectively.


7 slides
Finance in Business Infographic Presentation
Finance is an essential component of any economy, and it plays a crucial role in enabling businesses, individuals, and governments to manage their resources effectively. Use this template to help others understand the basics of finance in a simple manner. Finance is very broad, this template contains everything you need to keep track of your spending and earning. This has been designed to help you deliver informative Infographics that convey the main points of your topic. It is compatible with PowerPoint, Keynote and Google Slides, so you can easily change the text, add images, and change colors.


7 slides
Gap Analysis Skills Infographic
Gap analysis in a skills context is a process of evaluating the difference or "gap" between the current skills and competencies of an individual or a team and the desired or required skills for a particular role, project, or goal. This infographic template is a crucial tool for personal and professional development, talent management, and strategic planning within organizations. This captivating visual is designed to help individuals and organizations bridge the skills gap effectively. This infographic serves as a compass, guiding you through the essential steps needed to identify, analyze, and close the skills gaps within your organization.