


Features
- 4 Unique slides
- Fully editable and easy to edit in Microsoft Powerpoint, Keynote and Google Slides
- 16:9 widescreen layout
- Clean and professional designs
- Export to JPG, PDF or send by email


Do you have any questions?
Recommend


22 slides
Galileo Advertising Agency Proposal Presentation
Present your advertising agency’s capabilities with a proposal template designed to captivate and convince. This sleek and professional layout is perfect for agencies looking to showcase their services, team expertise, and strategic approach to clients. Highlight key sections such as your mission, client success stories, market analysis, and creative process, ensuring every detail is covered. Dive into campaign execution plans, resource allocation, and testimonials to build trust and credibility. Visualize your strategy development with data-driven slides and impactful case study layouts. Fully customizable in PowerPoint, Google Slides, and Keynote, this template is tailored for seamless editing to reflect your agency’s branding. The clean design, bold accents, and structured content make it ideal for pitches, client proposals, or business development meetings. Take your presentations to the next level and leave a lasting impression on potential clients.


20 slides
Scriptorium Design Portfolio Presentation
Showcase your creative work with a sophisticated design portfolio presentation template tailored for designers and creators. This template includes clean, minimalist slides to highlight your introduction, portfolio overview, design philosophy, and style. Showcase featured projects with dedicated project highlight slides, complete with client testimonials and awards for added credibility. With sections for your design process, services, pricing, and blog integration, this template provides a professional framework for sharing your creative journey. The editable layout ensures seamless customization to reflect your unique brand, making it suitable for freelancers, agencies, or design teams. Compatible with PowerPoint, Google Slides, and Keynote, this versatile template offers an elegant way to communicate your expertise and leave a lasting impression on clients or stakeholders. Tailor it to your needs and take your portfolio presentations to the next level!


4 slides
Business Gap Analysis Framework
Visually bridge the gap between current and desired performance with this impactful Business Gap Analysis slide. Featuring a creative cliff and bridge design with editable text sections, it's ideal for strategic planning, performance improvement, and operational reviews. Fully compatible with PowerPoint, Keynote, and Google Slides.


7 slides
College Statistics Infographic Presentation
A College Statistics Infographic is a visual representation of key data and statistics related to a college. This template can provide a quick and easy-to-understand overview of various aspects of the institution, such as enrollment figures, graduation rates, student demographics, and academic performance metrics. Featured are icons, illustrations, diagrams, and other design elements to enhance the visual appeal of this infographic and make it more engaging for your viewers. This template can be a useful tool for students, teachers, and others interested in learning more about a college.


8 slides
Australia and Pacific Map Presentation
Bring your regional data to life with a crisp, modern layout that highlights key insights across Australia and the Pacific islands. Perfect for displaying geographic trends, business reach, or market segmentation, this map design keeps your message clear and engaging. Fully compatible with PowerPoint, Keynote, and Google Slides.


7 slides
Construction Gantt Chart Infographic
A Gantt chart is a project management tool that shows the timeline and dependencies of your tasks. This infographic is a visual representation of the Gantt chart, and it will help you understand this important project management tool. This template is designed to help you plan and manage your tasks in a fun and engaging way. It's a great way to get the entire team on board with the project, and it's also a great way to make sure everyone is on track and hitting their goals. The chart is a great way to see at a glance what tasks need to happen, when they need to happen, and how long each task will take.


6 slides
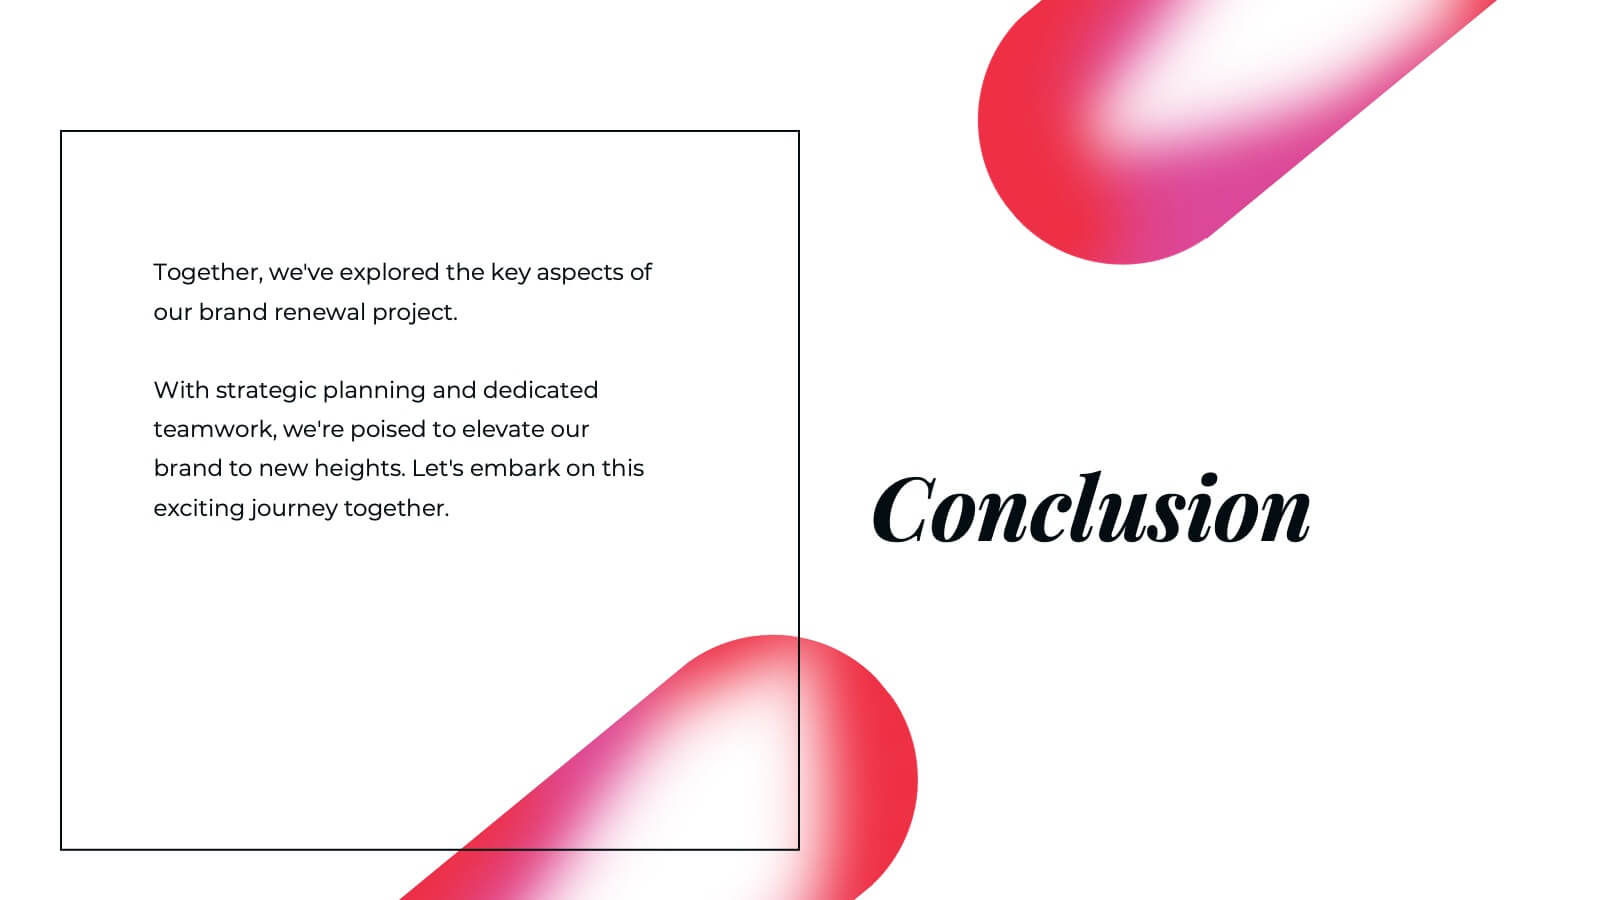
Key Conclusion Summary in Presentation
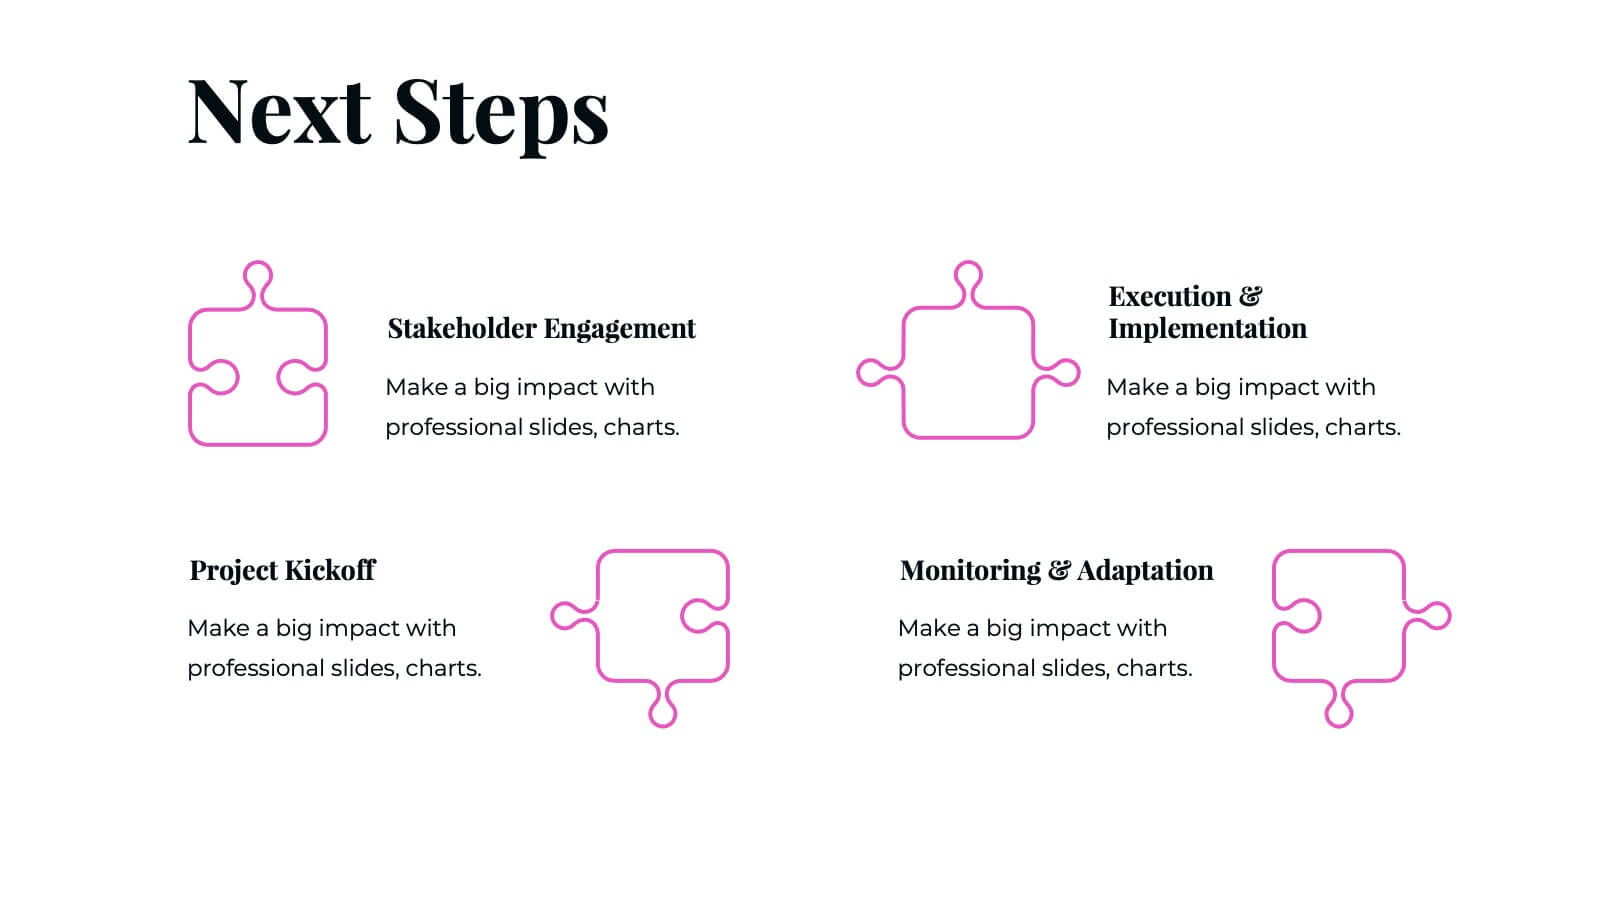
Conclude your presentation with clarity using this visually structured summary slide. Highlight five key takeaways through a linear roadmap with numbered sections and icons for quick reference. Perfect for final thoughts, progress recaps, or strategic conclusions. Fully editable in PowerPoint, Keynote, and Google Slides to suit your presentation needs.


6 slides
Work From Home Opportunities Infographic
Work-from-home opportunities refer to job positions, projects, or tasks that allow individuals to work remotely from their own homes or any other location outside of a traditional office setting. This infographic template is a visual representation that provides information about different types of remote job opportunities and the benefits of working from home. This template can be divided into sections, to highlight specific categories of remote jobs. The images and icons are included to convey the idea of working from home, such as a home office setup or a person working on a laptop. This is compatible with Powerpoint, Keynote, and Google Slides.


3 slides
Future of Aviation Technologies Presentation
Soar into the future of flight with this sleek, data-driven layout that visualizes progress and innovation in aviation. Perfect for showcasing new technologies, sustainability efforts, or industry growth trends, it balances clarity and impact. Fully customizable and compatible with PowerPoint, Keynote, and Google Slides for effortless presentation design.


4 slides
4-Quadrant RACI Chart Slide Presentation
Bring structure and clarity to your workflow with a bold, pyramid-style layout that makes responsibilities instantly understandable. This presentation helps teams outline who leads, supports, approves, and informs across key tasks, turning complex processes into a clean visual map. Fully editable and compatible with PowerPoint, Keynote, and Google Slides.


6 slides
Profit vs Cost Analysis Presentation
Make your numbers tell a story of balance and success with this clean, data-driven presentation design. Perfect for comparing expenses and gains, it helps showcase business efficiency, growth, and decision-making clarity. Fully customizable and compatible with PowerPoint, Keynote, and Google Slides for a professional and seamless presentation experience.


6 slides
Sales Strategy 30-60-90 Day Plan Presentation
Drive sales success with this structured 30-60-90 day strategy template! Designed to help sales teams and professionals set clear objectives, track progress, and optimize performance, this layout ensures a smooth transition from planning to execution. Fully customizable and compatible with PowerPoint, Keynote, and Google Slides for seamless presentations.


7 slides
Marketing Funnel Infographic
Chart your customers' journey with our marketing funnel infographic. Set on a pristine white canvas, enriched with the zest of orange, the insight of purple, the trust of blue, and the growth of green, this template vividly illustrates the stages of a customer's progression towards a purchase. Adorned with clear infographics, emblematic icons, and tailored image placeholders, it offers a panoramic view of conversion pathways. Expertly devised for Powerpoint, Keynote, or Google Slides. A prized possession for marketing professionals, digital strategists, business consultants, or any brand striving for conversion optimization.


8 slides
Data-Driven Market Segmentation
Visualize customer insights with clarity using the Data-Driven Market Segmentation Presentation. This dynamic circular infographic displays four key segments, each with percentage labels and curved connectors pointing to detailed descriptions. Ideal for marketing analysts, product strategists, or data-driven teams aiming to present behavioral, demographic, or purchasing trends. The sleek, radial layout makes comparisons intuitive and engaging. Fully editable in PowerPoint, Keynote, and Google Slides—customize colors, icons, and data points to match your brand and message.


22 slides
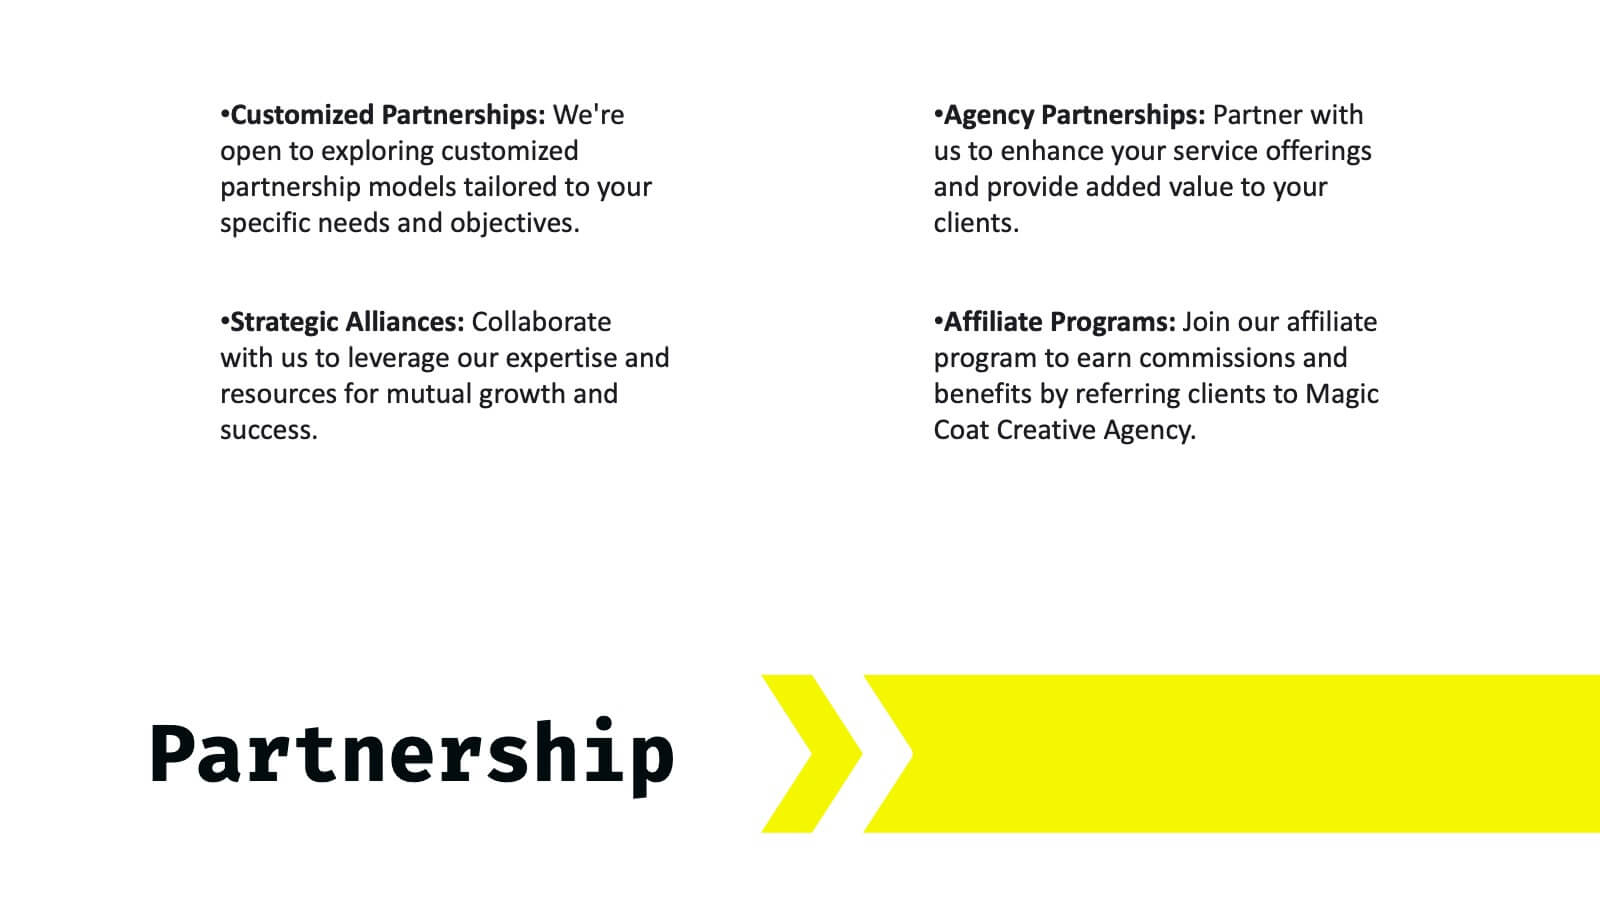
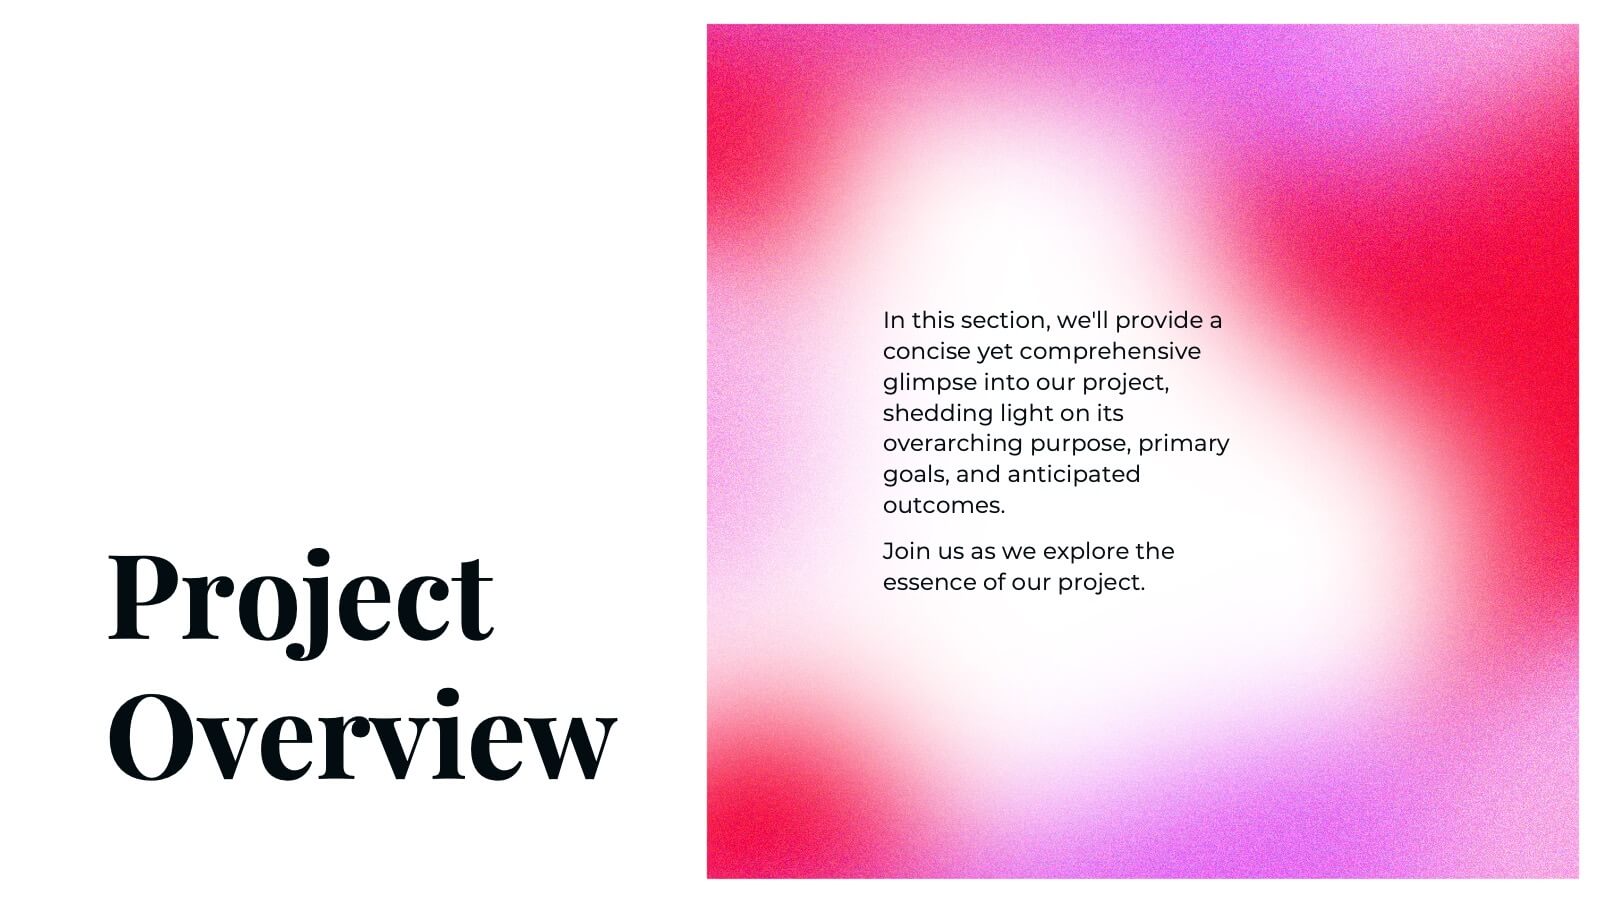
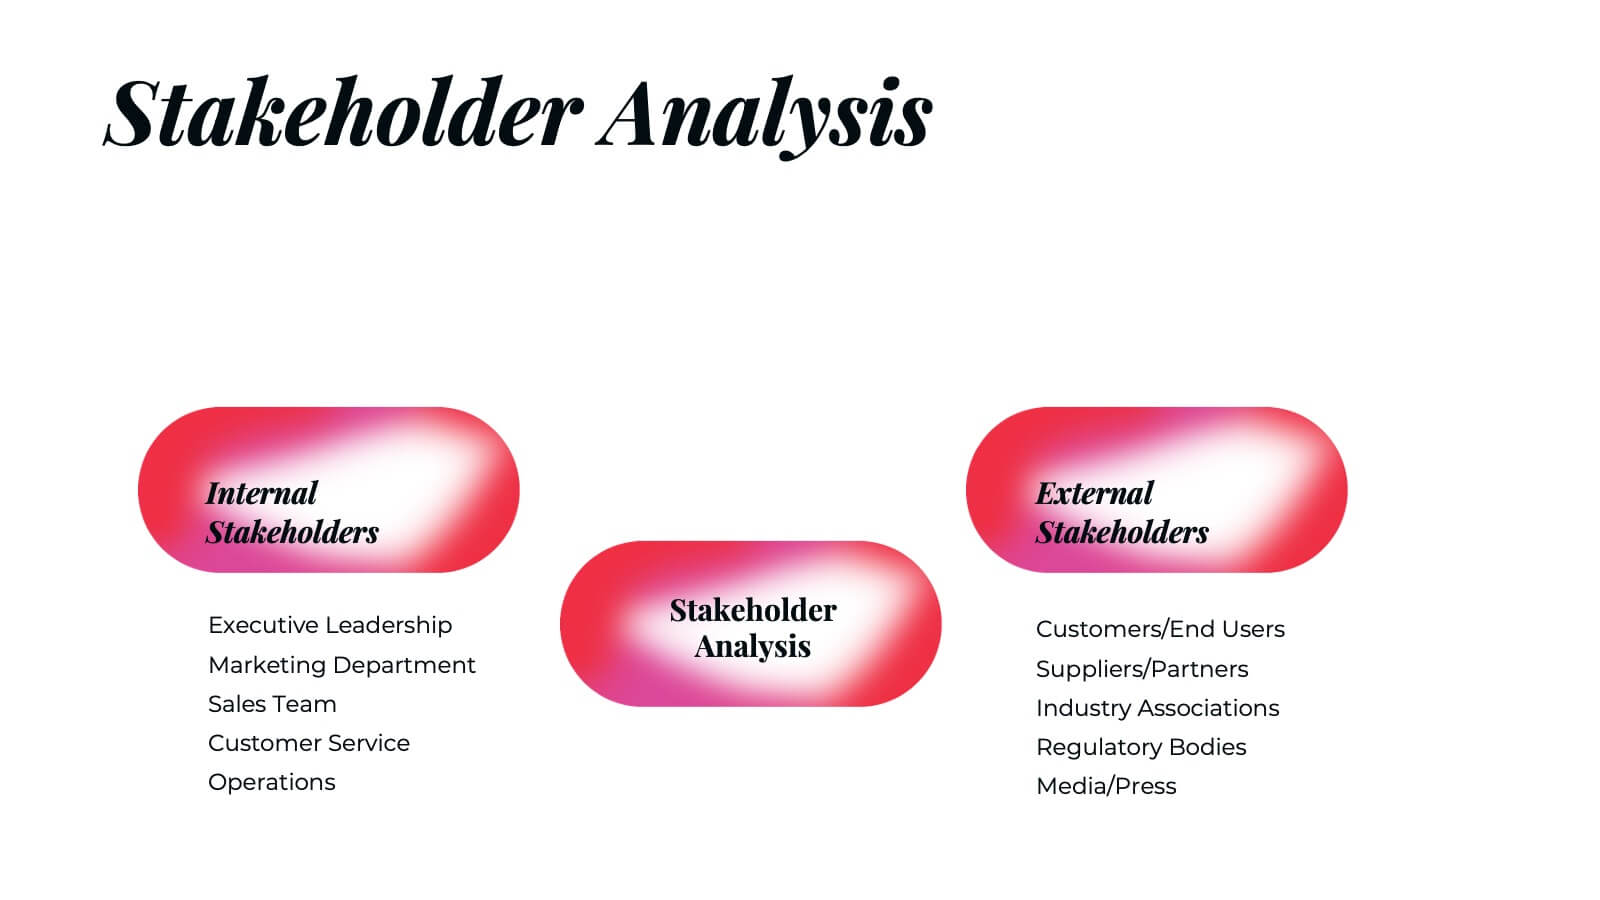
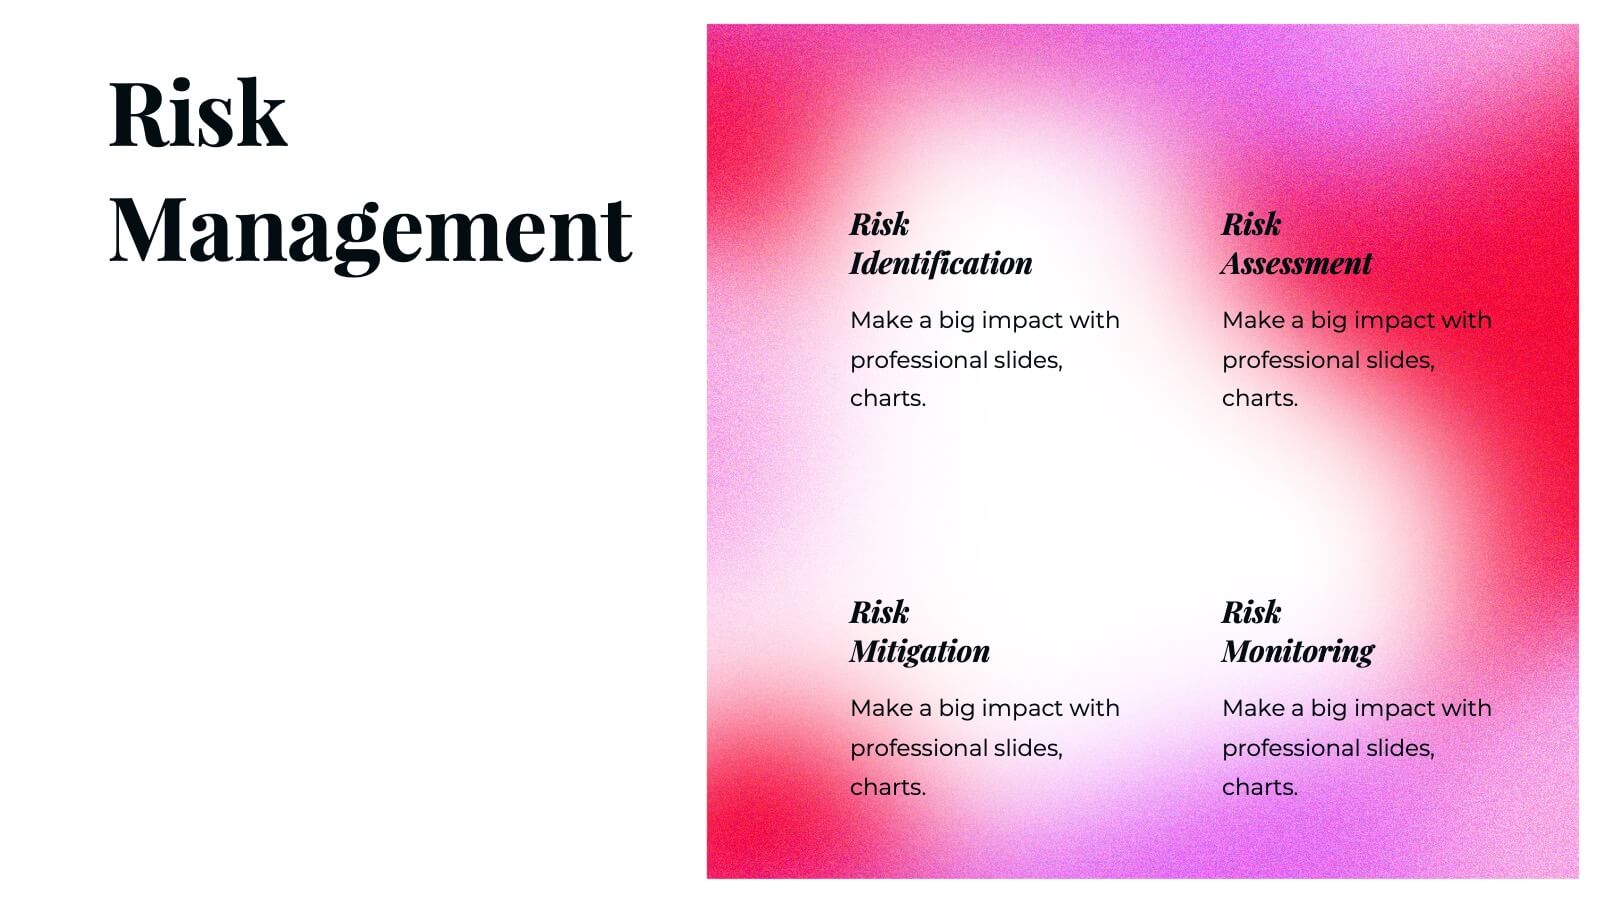
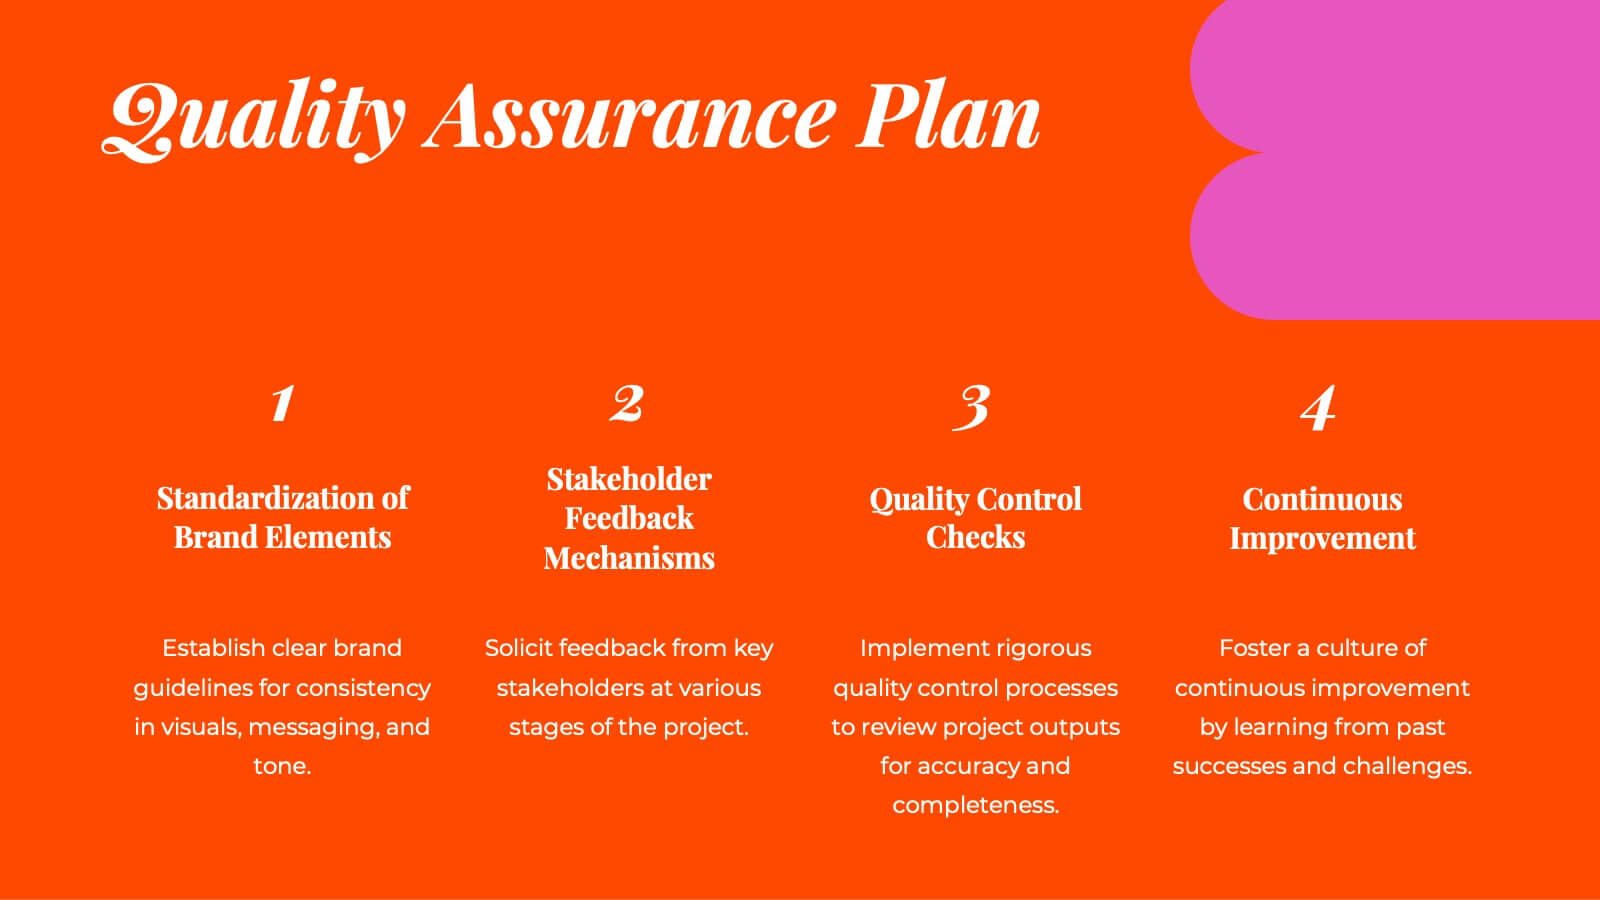
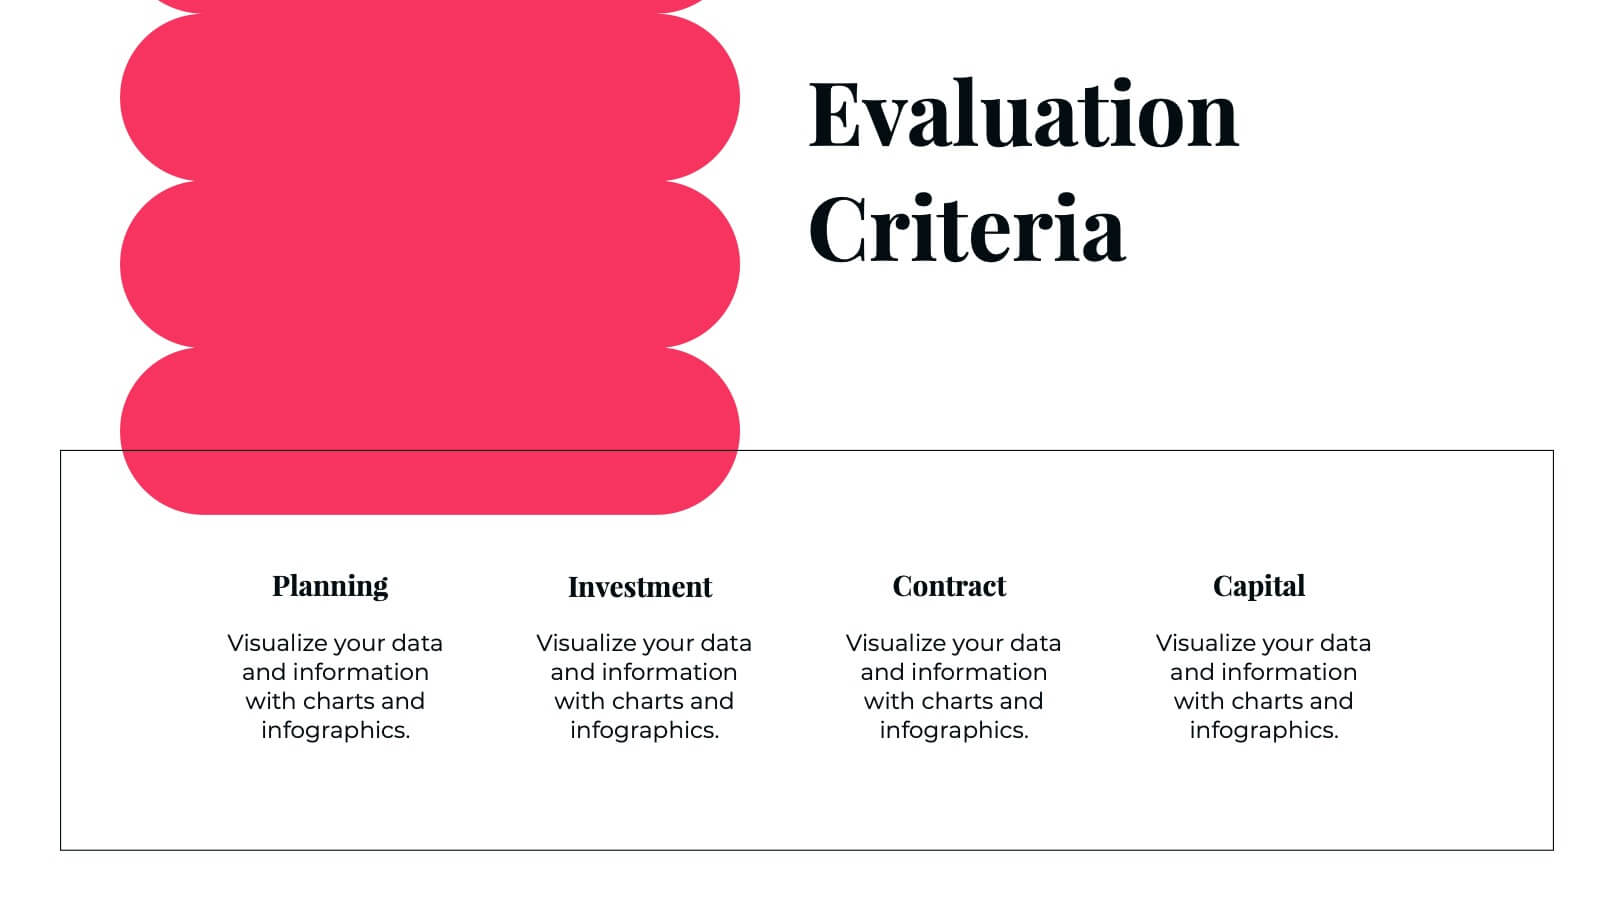
Moonstone Detailed Project Execution Plan Presentation
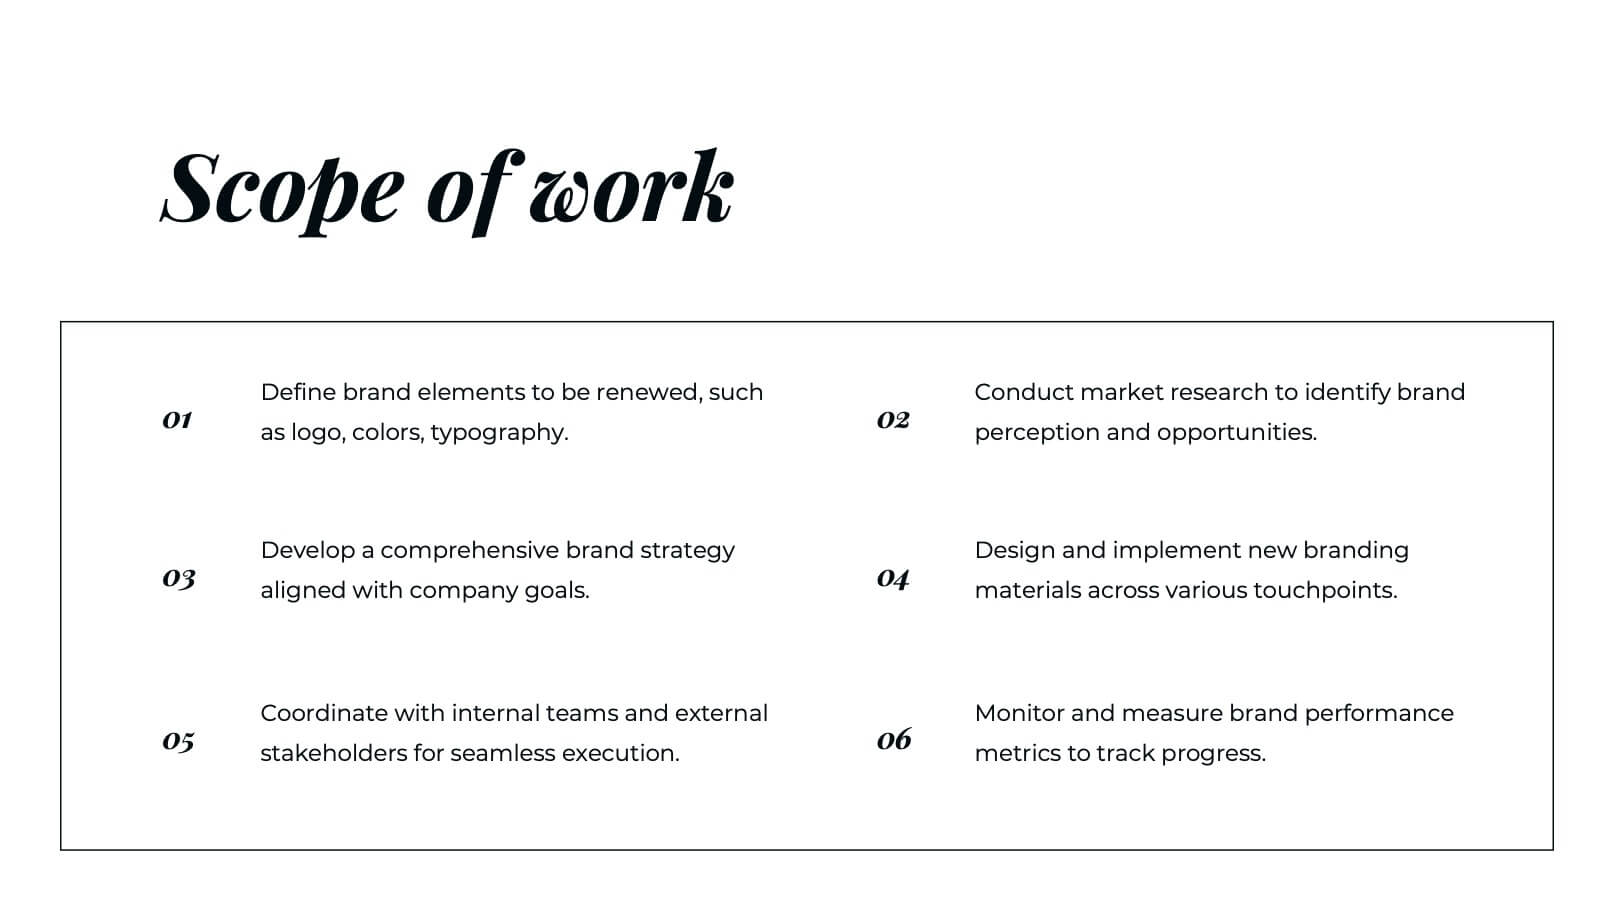
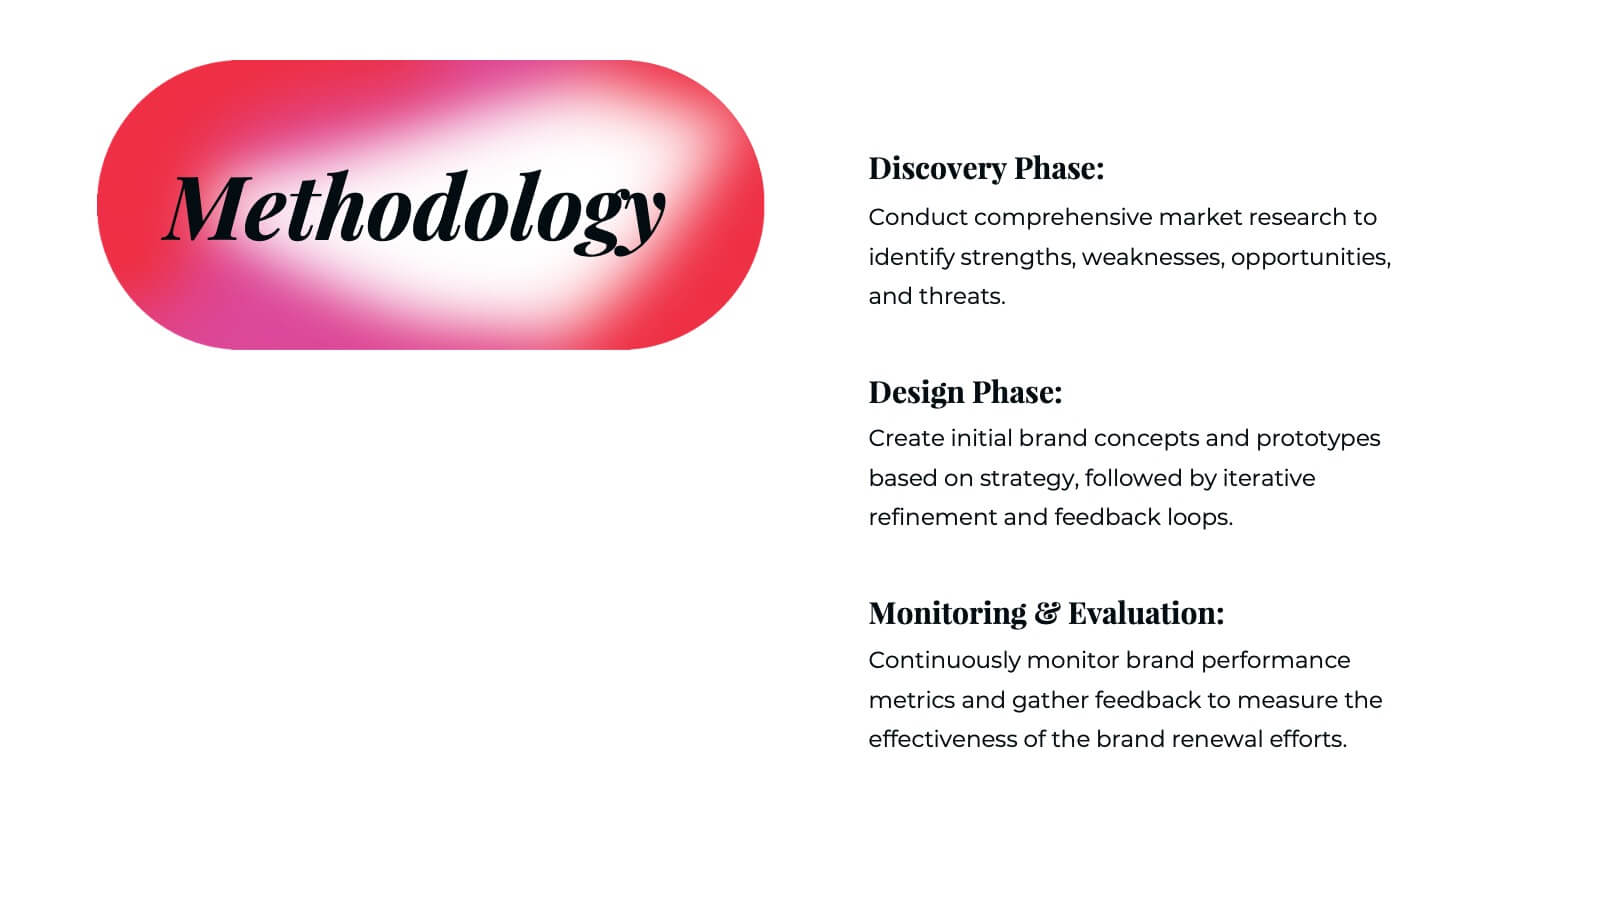
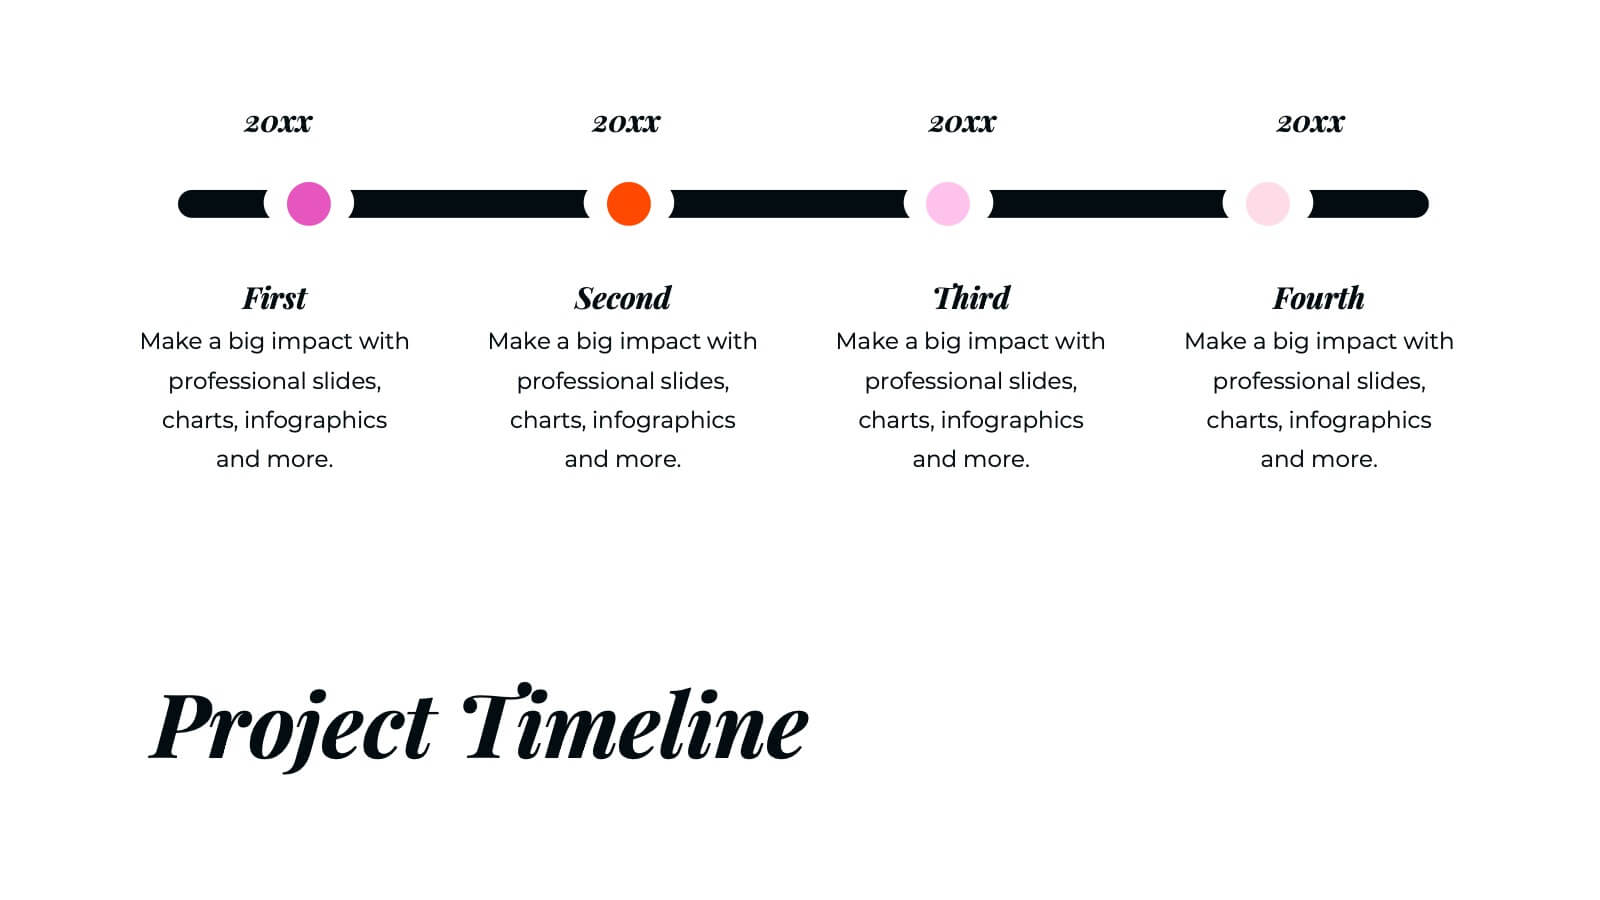
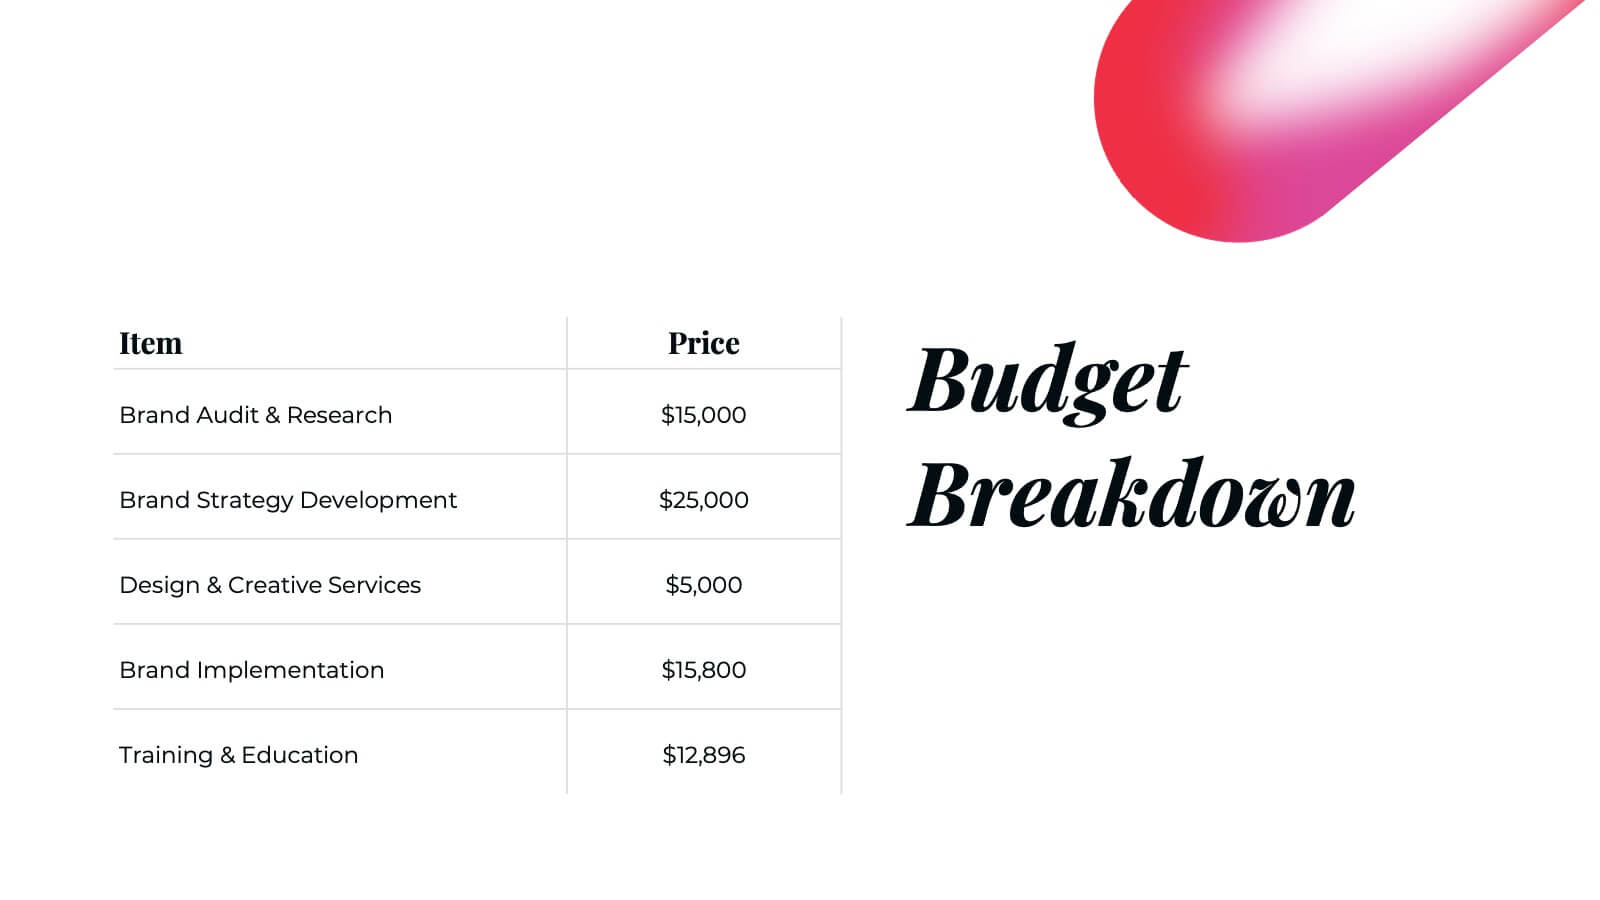
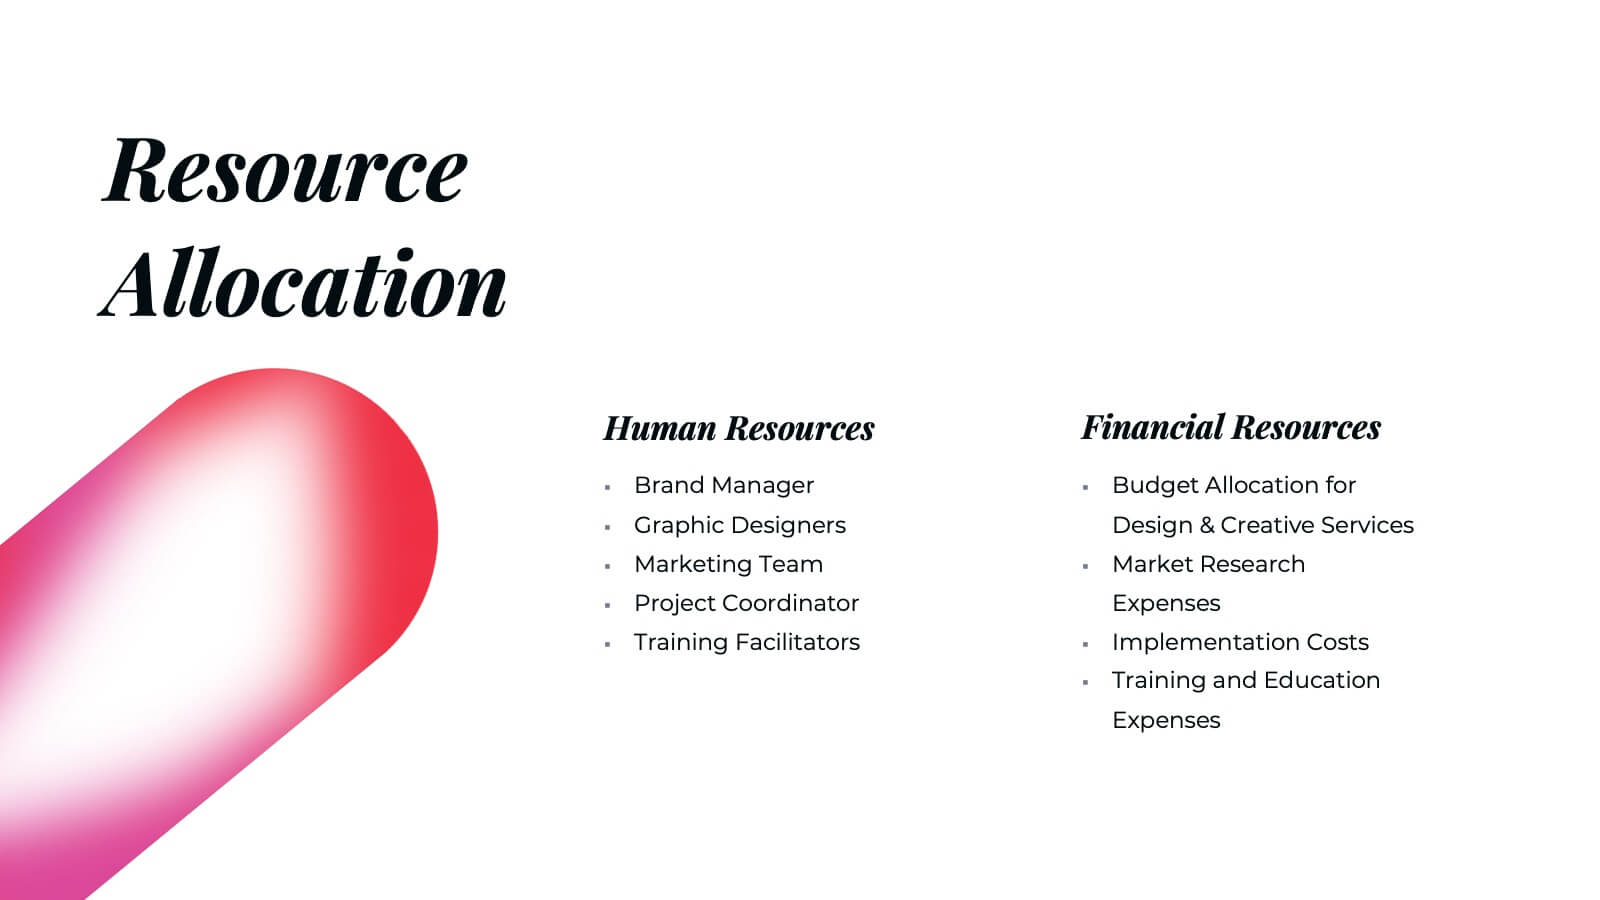
Create a compelling project execution plan with this vibrant and well-structured presentation template! Covering every key aspect from problem statements and objectives to risk management and quality assurance, this template provides a clear roadmap for your project. It’s perfect for organizing timelines, budget breakdowns, and stakeholder analysis. Compatible with PowerPoint, Keynote, and Google Slides for smooth presentations.


5 slides
USA Resources Map Infographics
A USA resources map is a visual representation of the natural resources found in different regions of the United States. This presentation template showcases the diverse natural resources found across the United States. It provides an overview of different types of resources, including minerals, energy sources, agricultural products, and more, allowing viewers to understand the richness and distribution of resources in the country. This can provide valuable information for industries, researchers, and students to understand the distribution and utilization of natural resources across the country.
5 slides
Key Milestone Tracker for Projects Presentation
Track project progress and celebrate wins with the Key Milestone Tracker for Projects Presentation. This template features a vertical flow of trophy icons embedded in hexagons, each representing a major milestone. Ideal for showcasing achievements, timelines, or key phases in a project lifecycle. Fully customizable and compatible with PowerPoint, Keynote, and Google Slides.