


Features
- 8 Unique slides
- Fully editable and easy to edit in Microsoft Powerpoint, Keynote and Google Slides
- 16:9 widescreen layout
- Clean and professional designs
- Export to JPG, PDF or send by email


Do you have any questions?
Recommend


12 slides
Understanding Digital Currencies Presentation
Simplify the complexity of crypto ecosystems with the Understanding Digital Currencies presentation template. Designed around a wallet-style visual, this layout highlights key features of various cryptocurrencies using six labeled touchpoints. Perfect for introducing Bitcoin, Ethereum, altcoins, and digital wallets in educational, financial, or blockchain-related presentations. Ideal for crypto educators, fintech startups, and investment analysts. Compatible with PowerPoint, Keynote, and Google Slides.


4 slides
Financial KPI Analysis Presentation
Present key financial metrics with clarity using the Financial KPI Analysis slide. This layout highlights four essential indicators—MRR, Customer Count, Gross Profit Margin, and NPM—each with colorful data blocks and corresponding mini charts. A dynamic line graph and column chart provide deeper insight into monthly and categorical performance. Fully editable in PowerPoint, Keynote, and Google Slides for streamlined reporting.


26 slides
Customer Service Bold Presentation
Step into a world where every interaction is more than a service; it's an experience, artfully portrayed in a dynamic series highlighting the essence of customer relations. This vibrant presentation is a bold statement in customer service excellence, where each slide is a burst of sunshine in hues of optimism, communicating the core principles of attentiveness and care. The visuals are a striking blend of modern design and functional aesthetics, spotlighting the human touch that underlies the digital interactions of today's customer-centric landscapes. From the empathetic smiles of service agents to the infographic elucidation of response strategies, the narrative captures the spirit of connection between brand and consumer. It's a testament to the seamless melding of efficiency and warmth, showcasing the art of turning every customer journey into a tale of satisfaction and loyalty. This is the celebration of customer service—not just as a duty, but as a craft, where every detail contributes to a masterpiece of memorable experiences.


4 slides
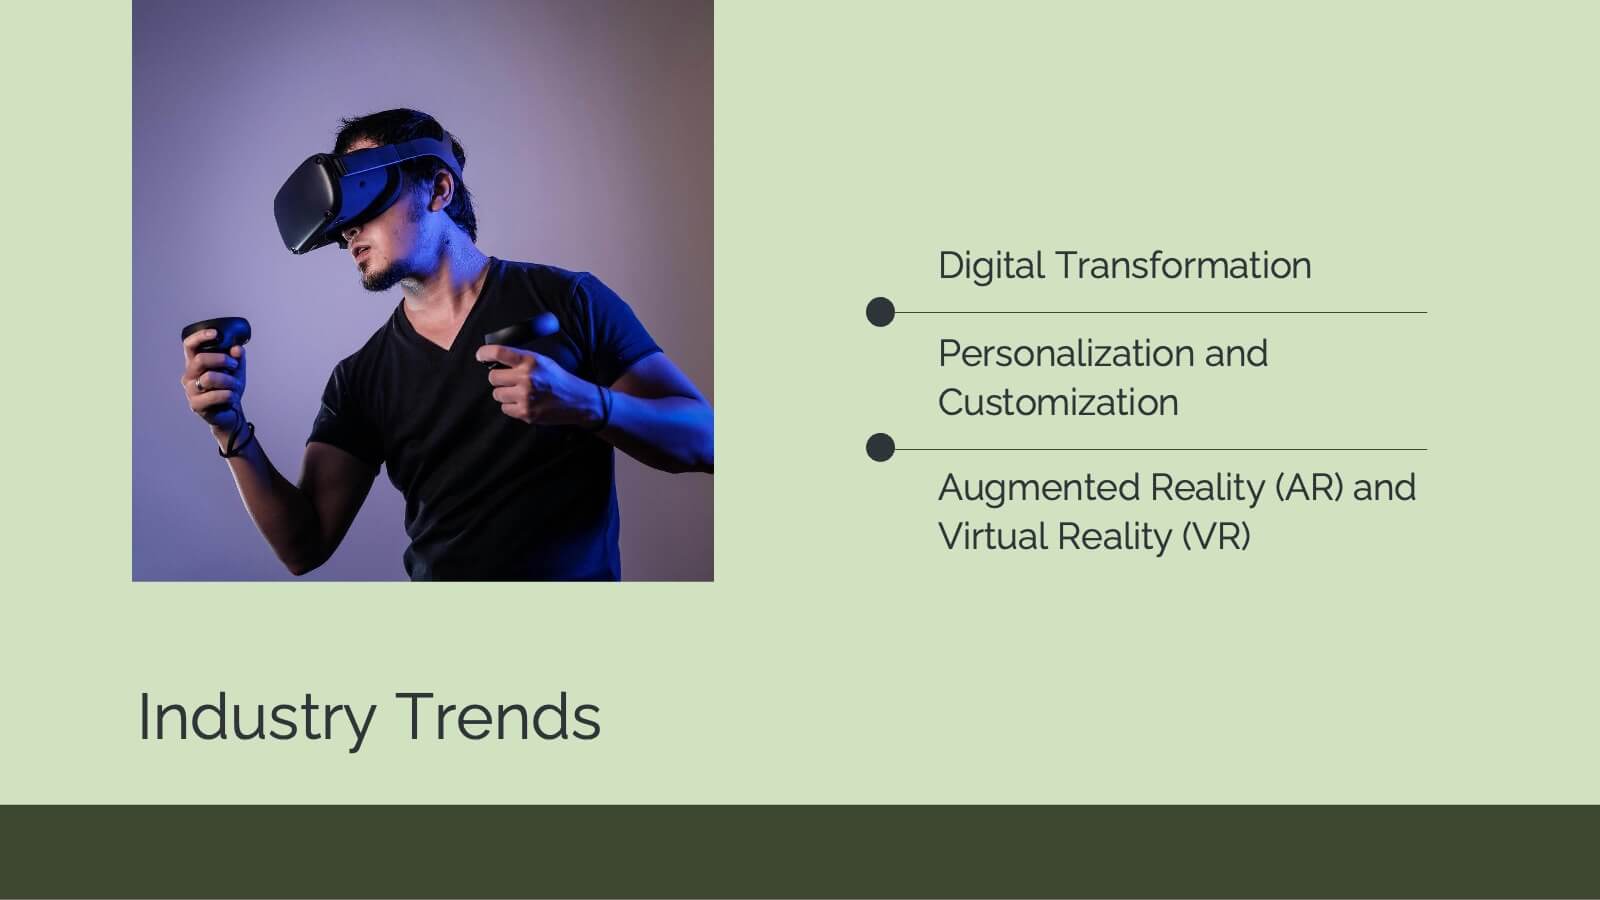
Business Introduction Slide Template Presentation
Present your business strategy, concept, or value proposition with clarity using this introduction slide. Featuring a photo placeholder and three clean content sections, it's perfect for pitching ideas or onboarding teams. Fully editable in Canva, PowerPoint, or Google Slides for a professional and polished presentation every time.


23 slides
Journey Product Roadmap Presentation
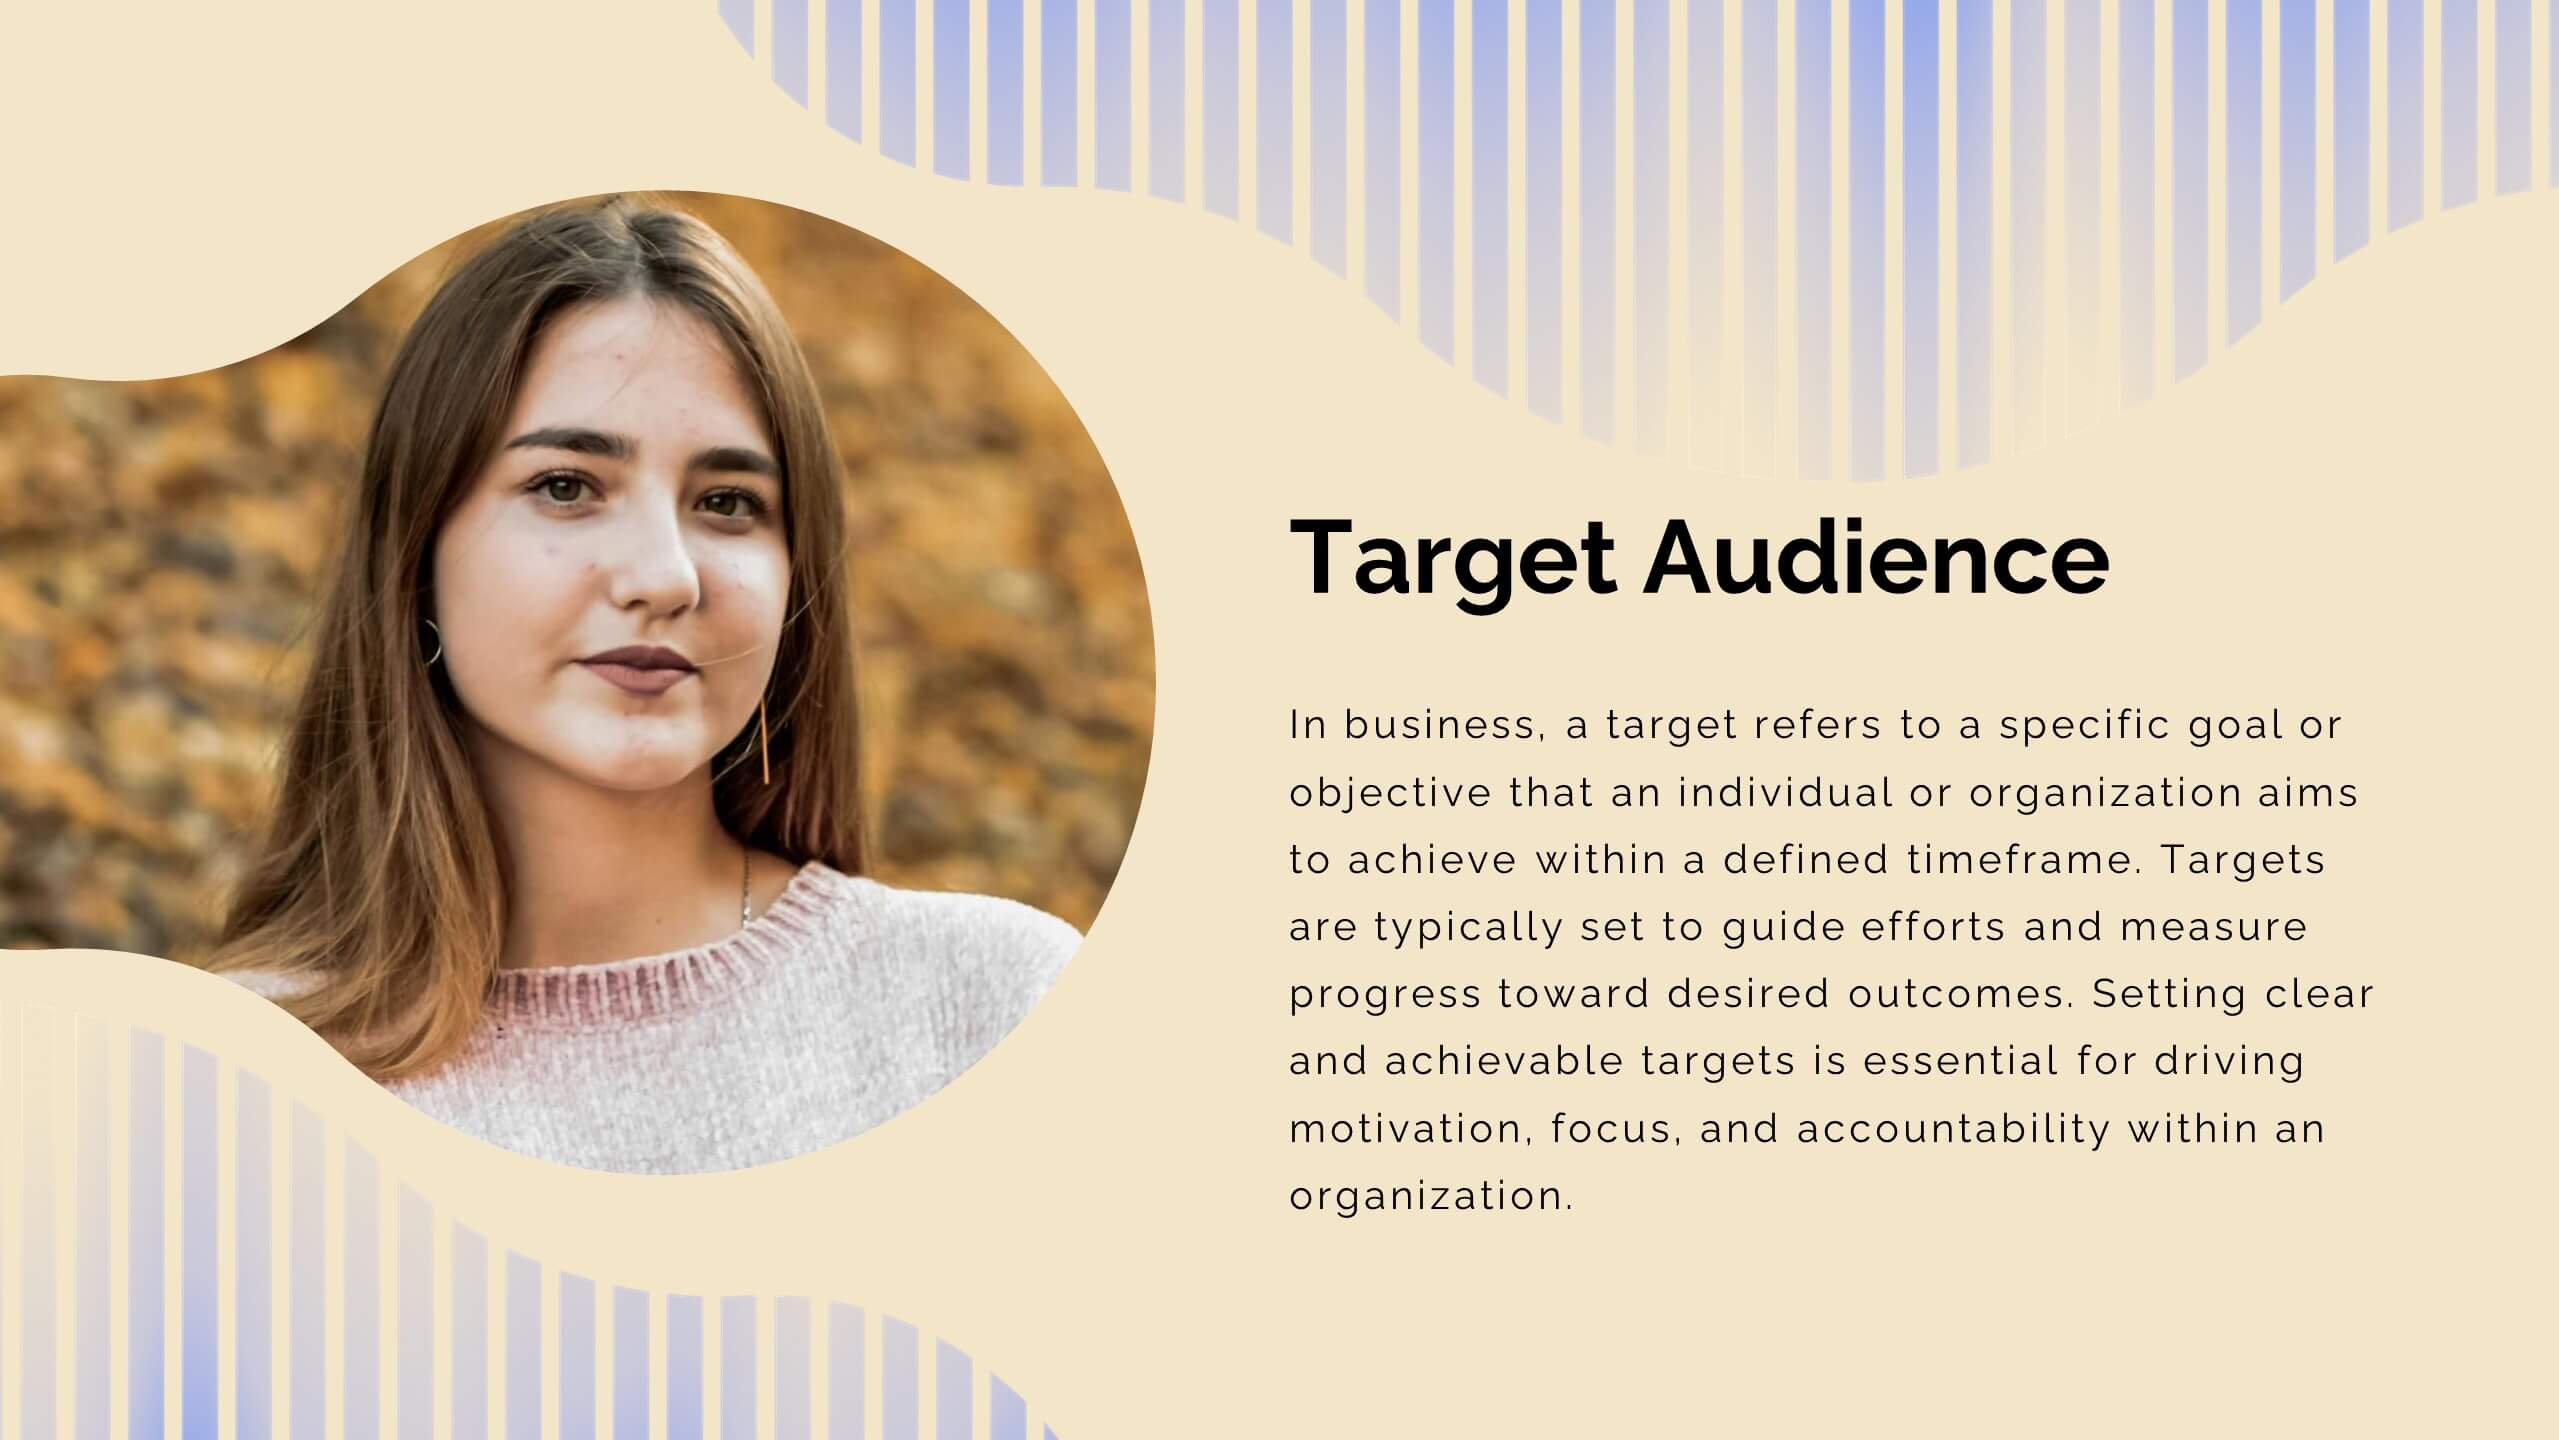
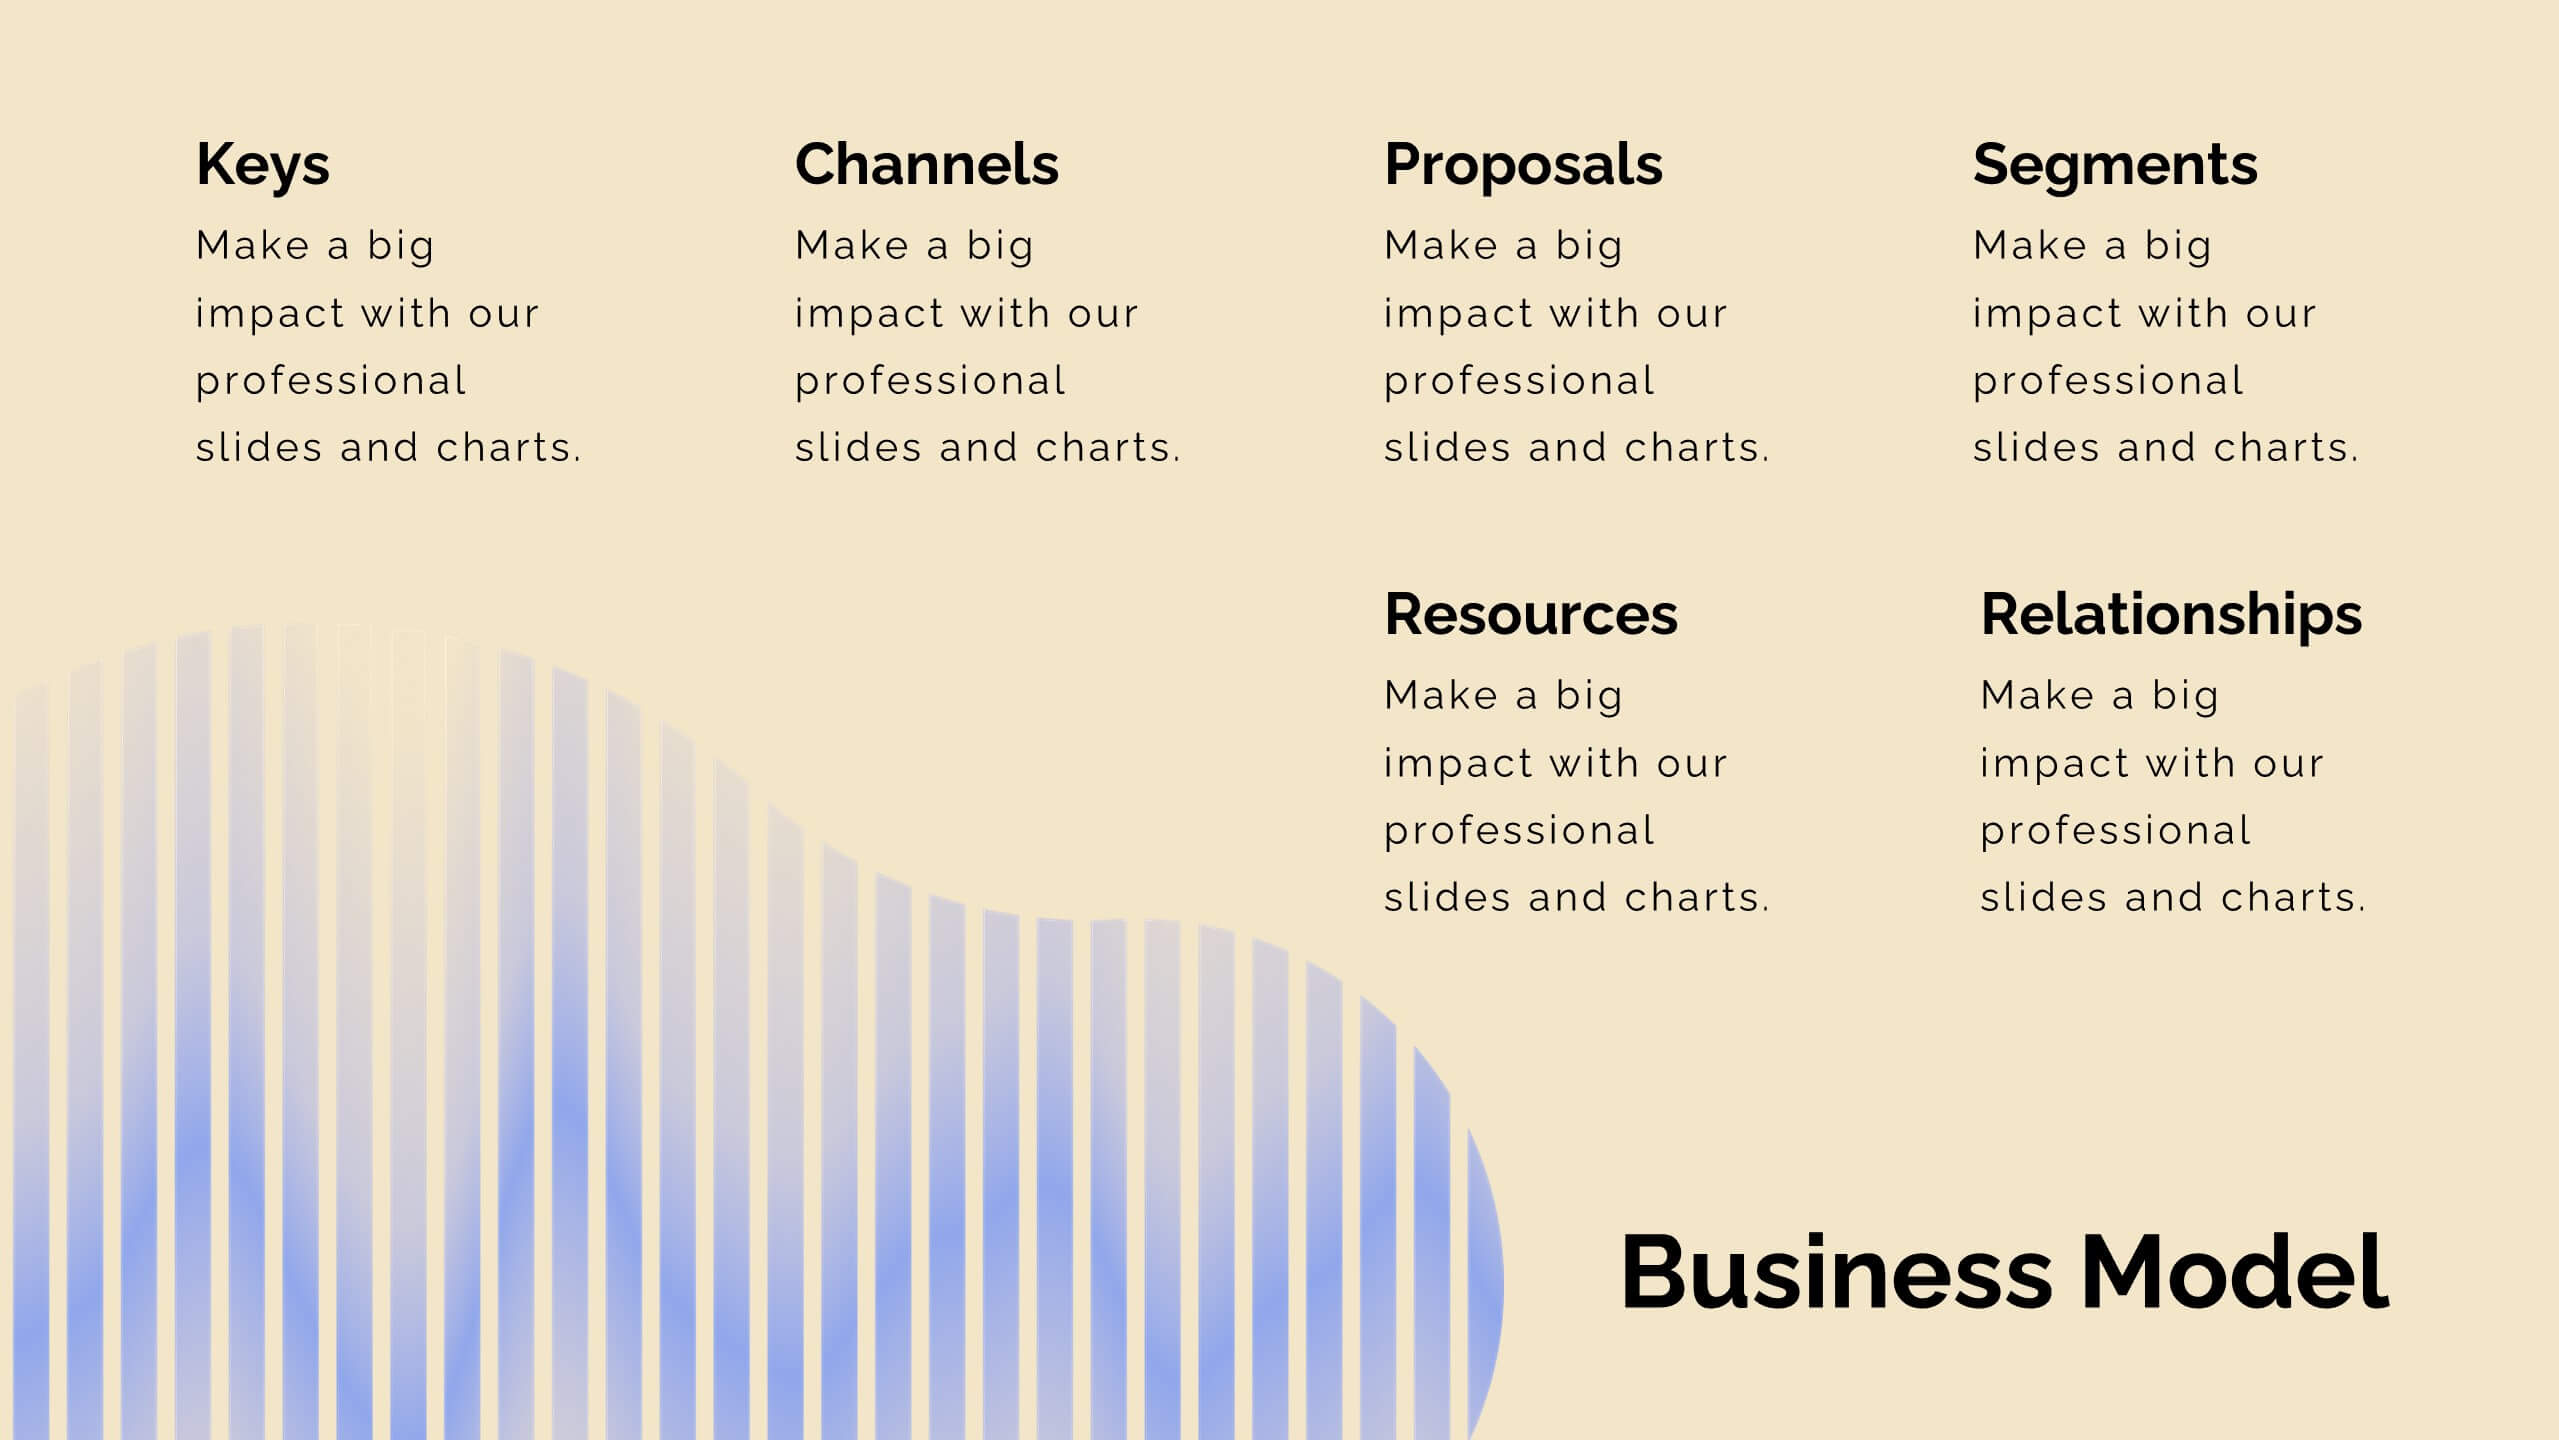
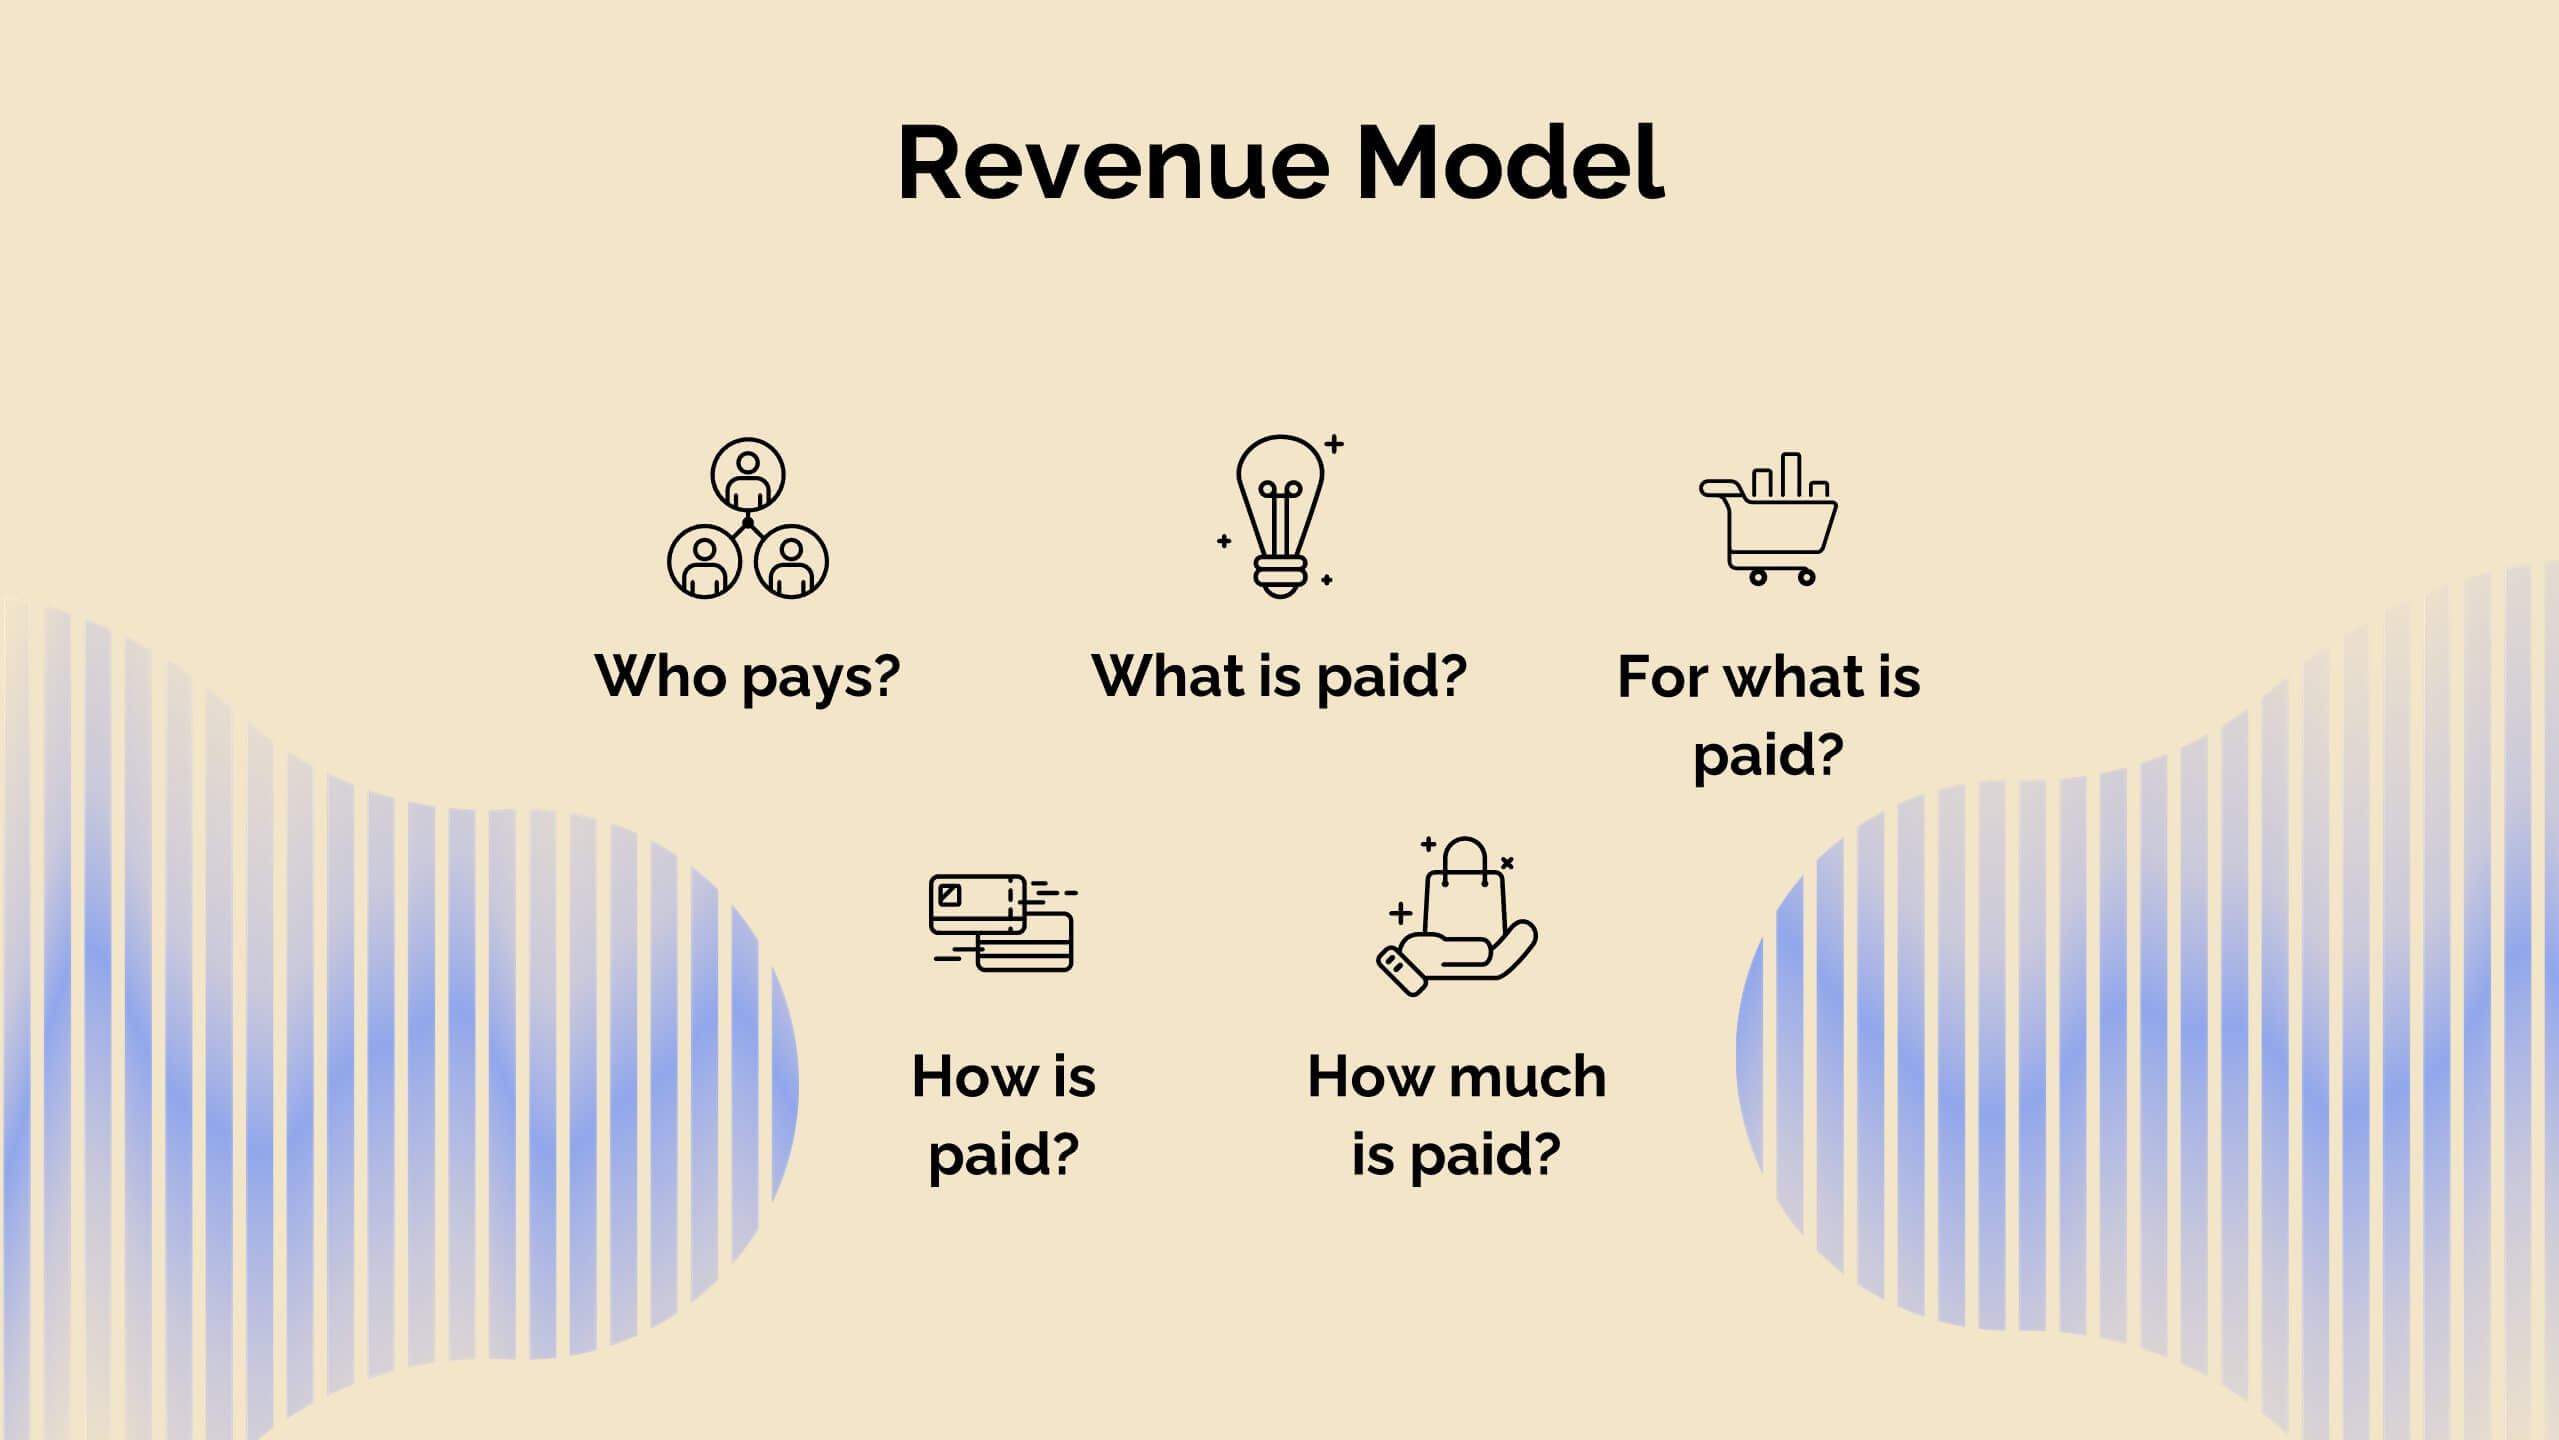
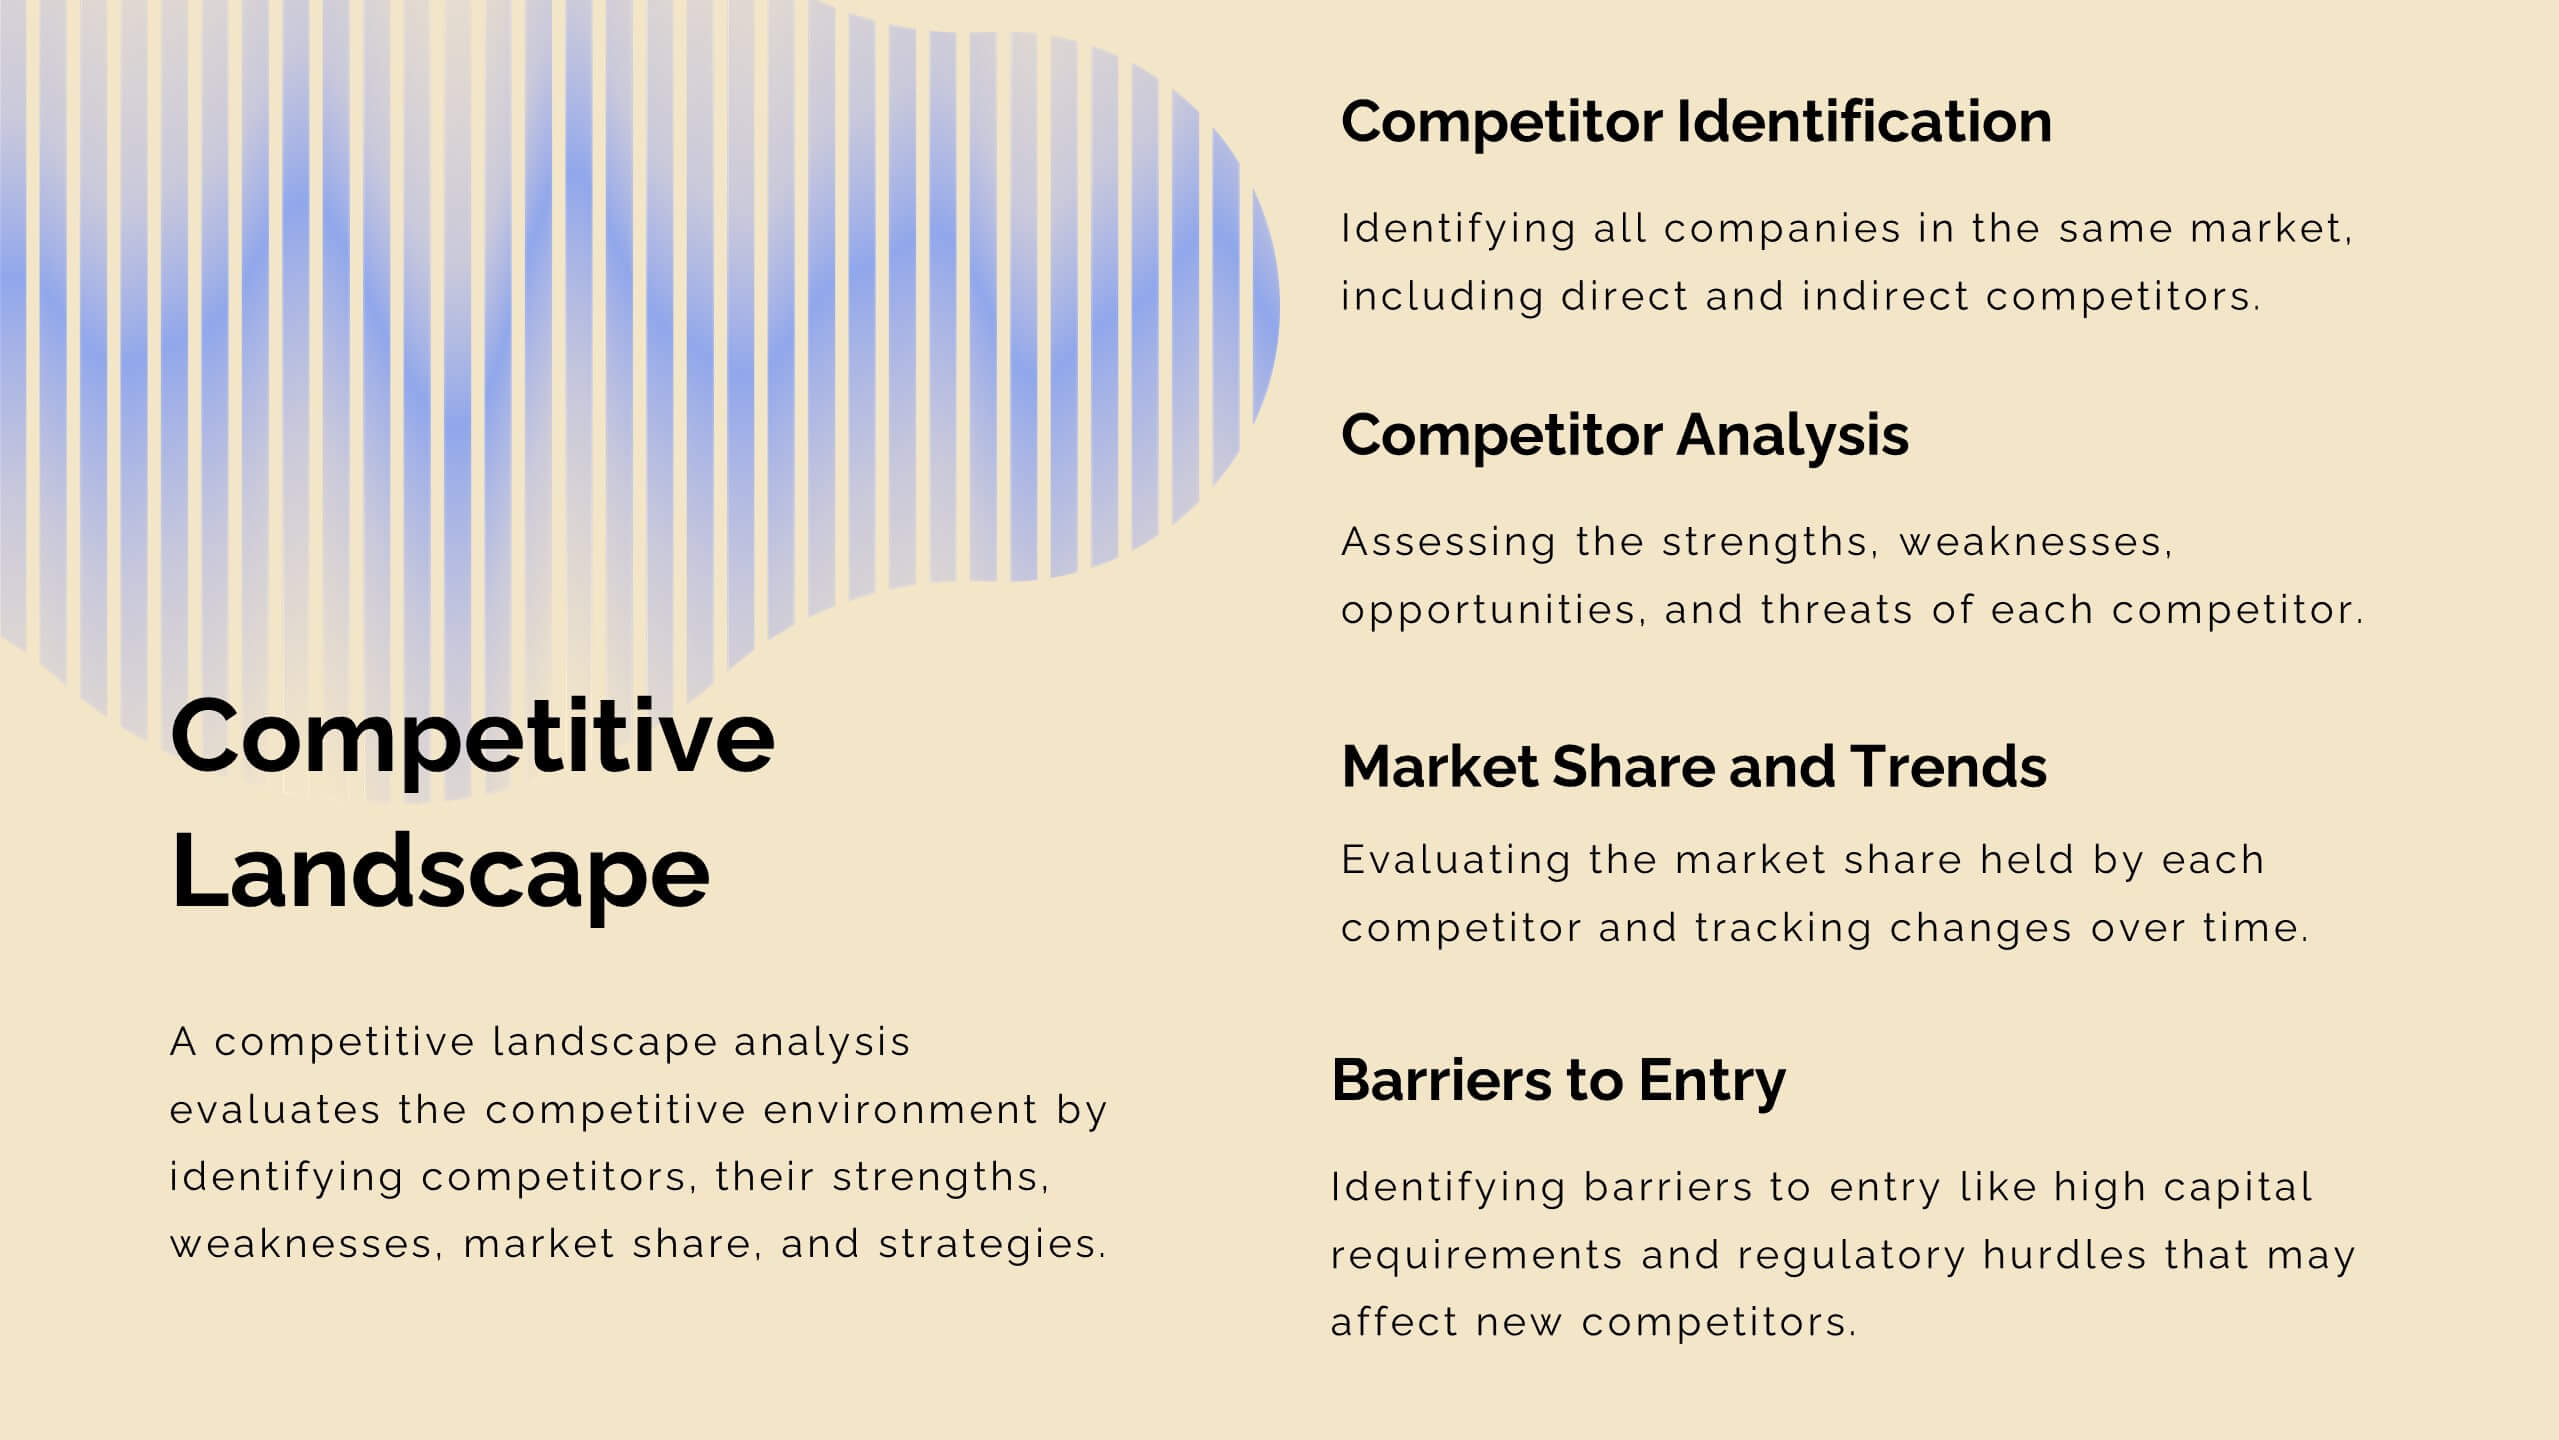
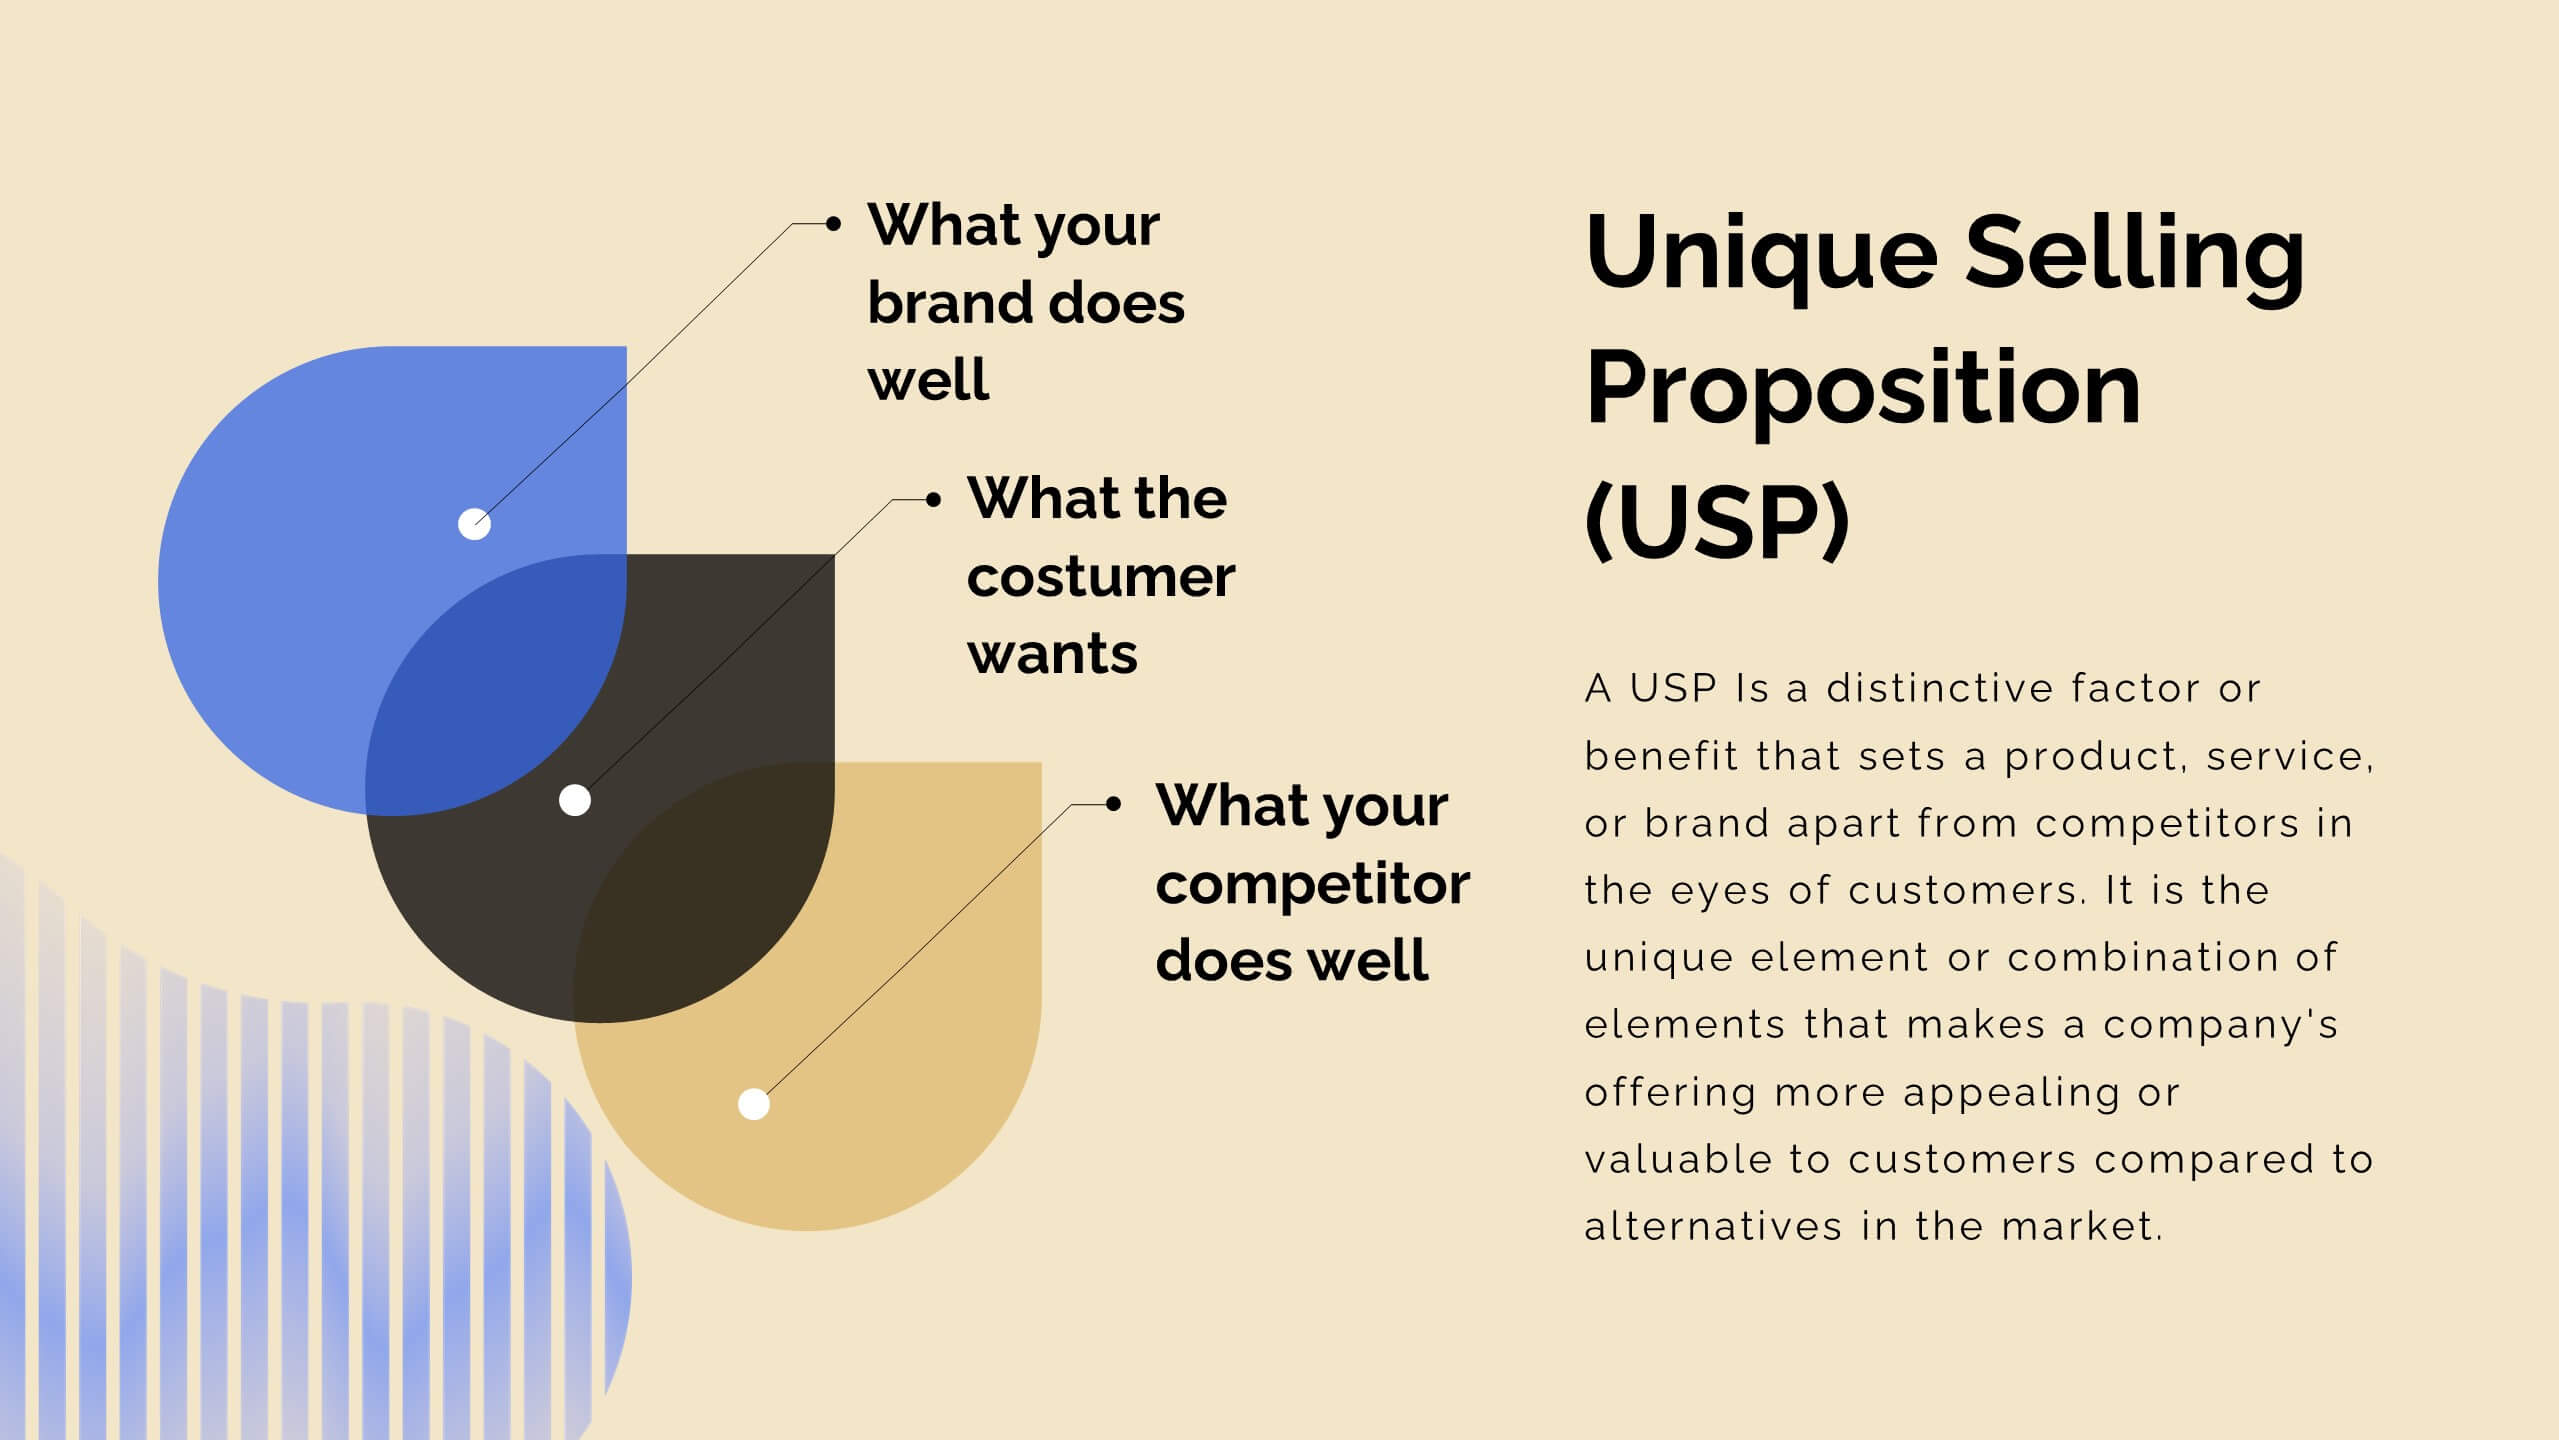
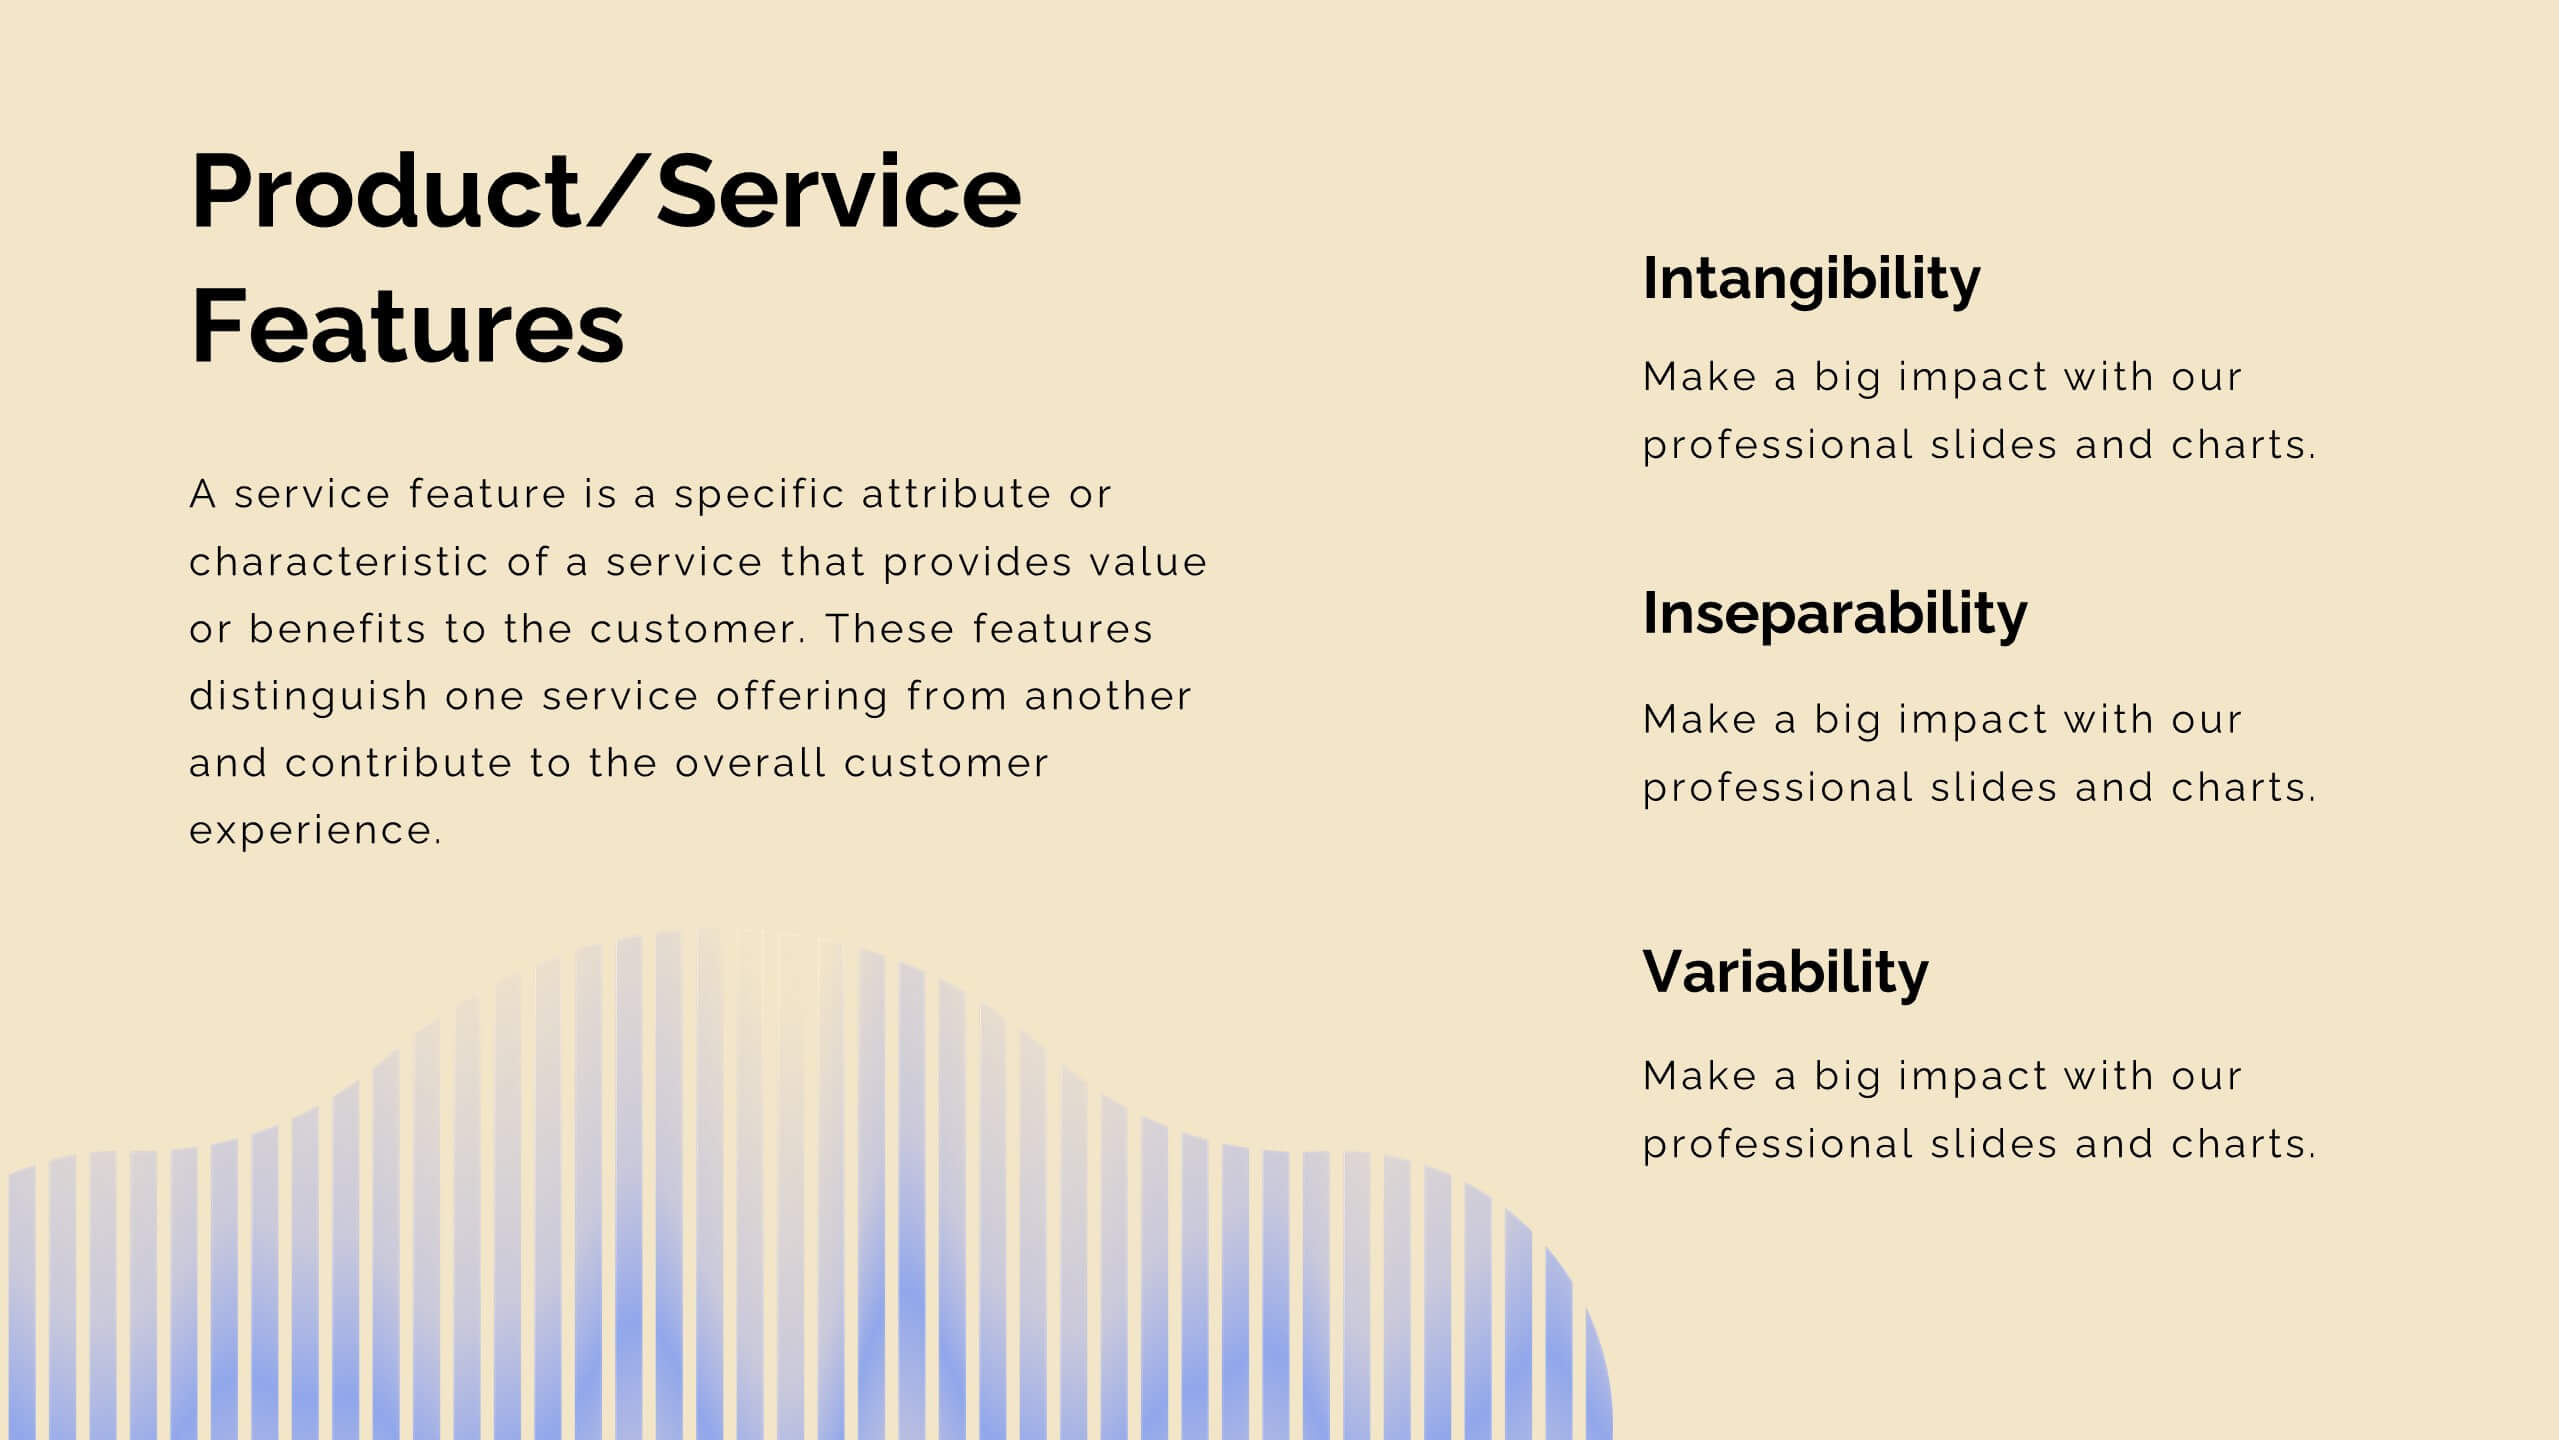
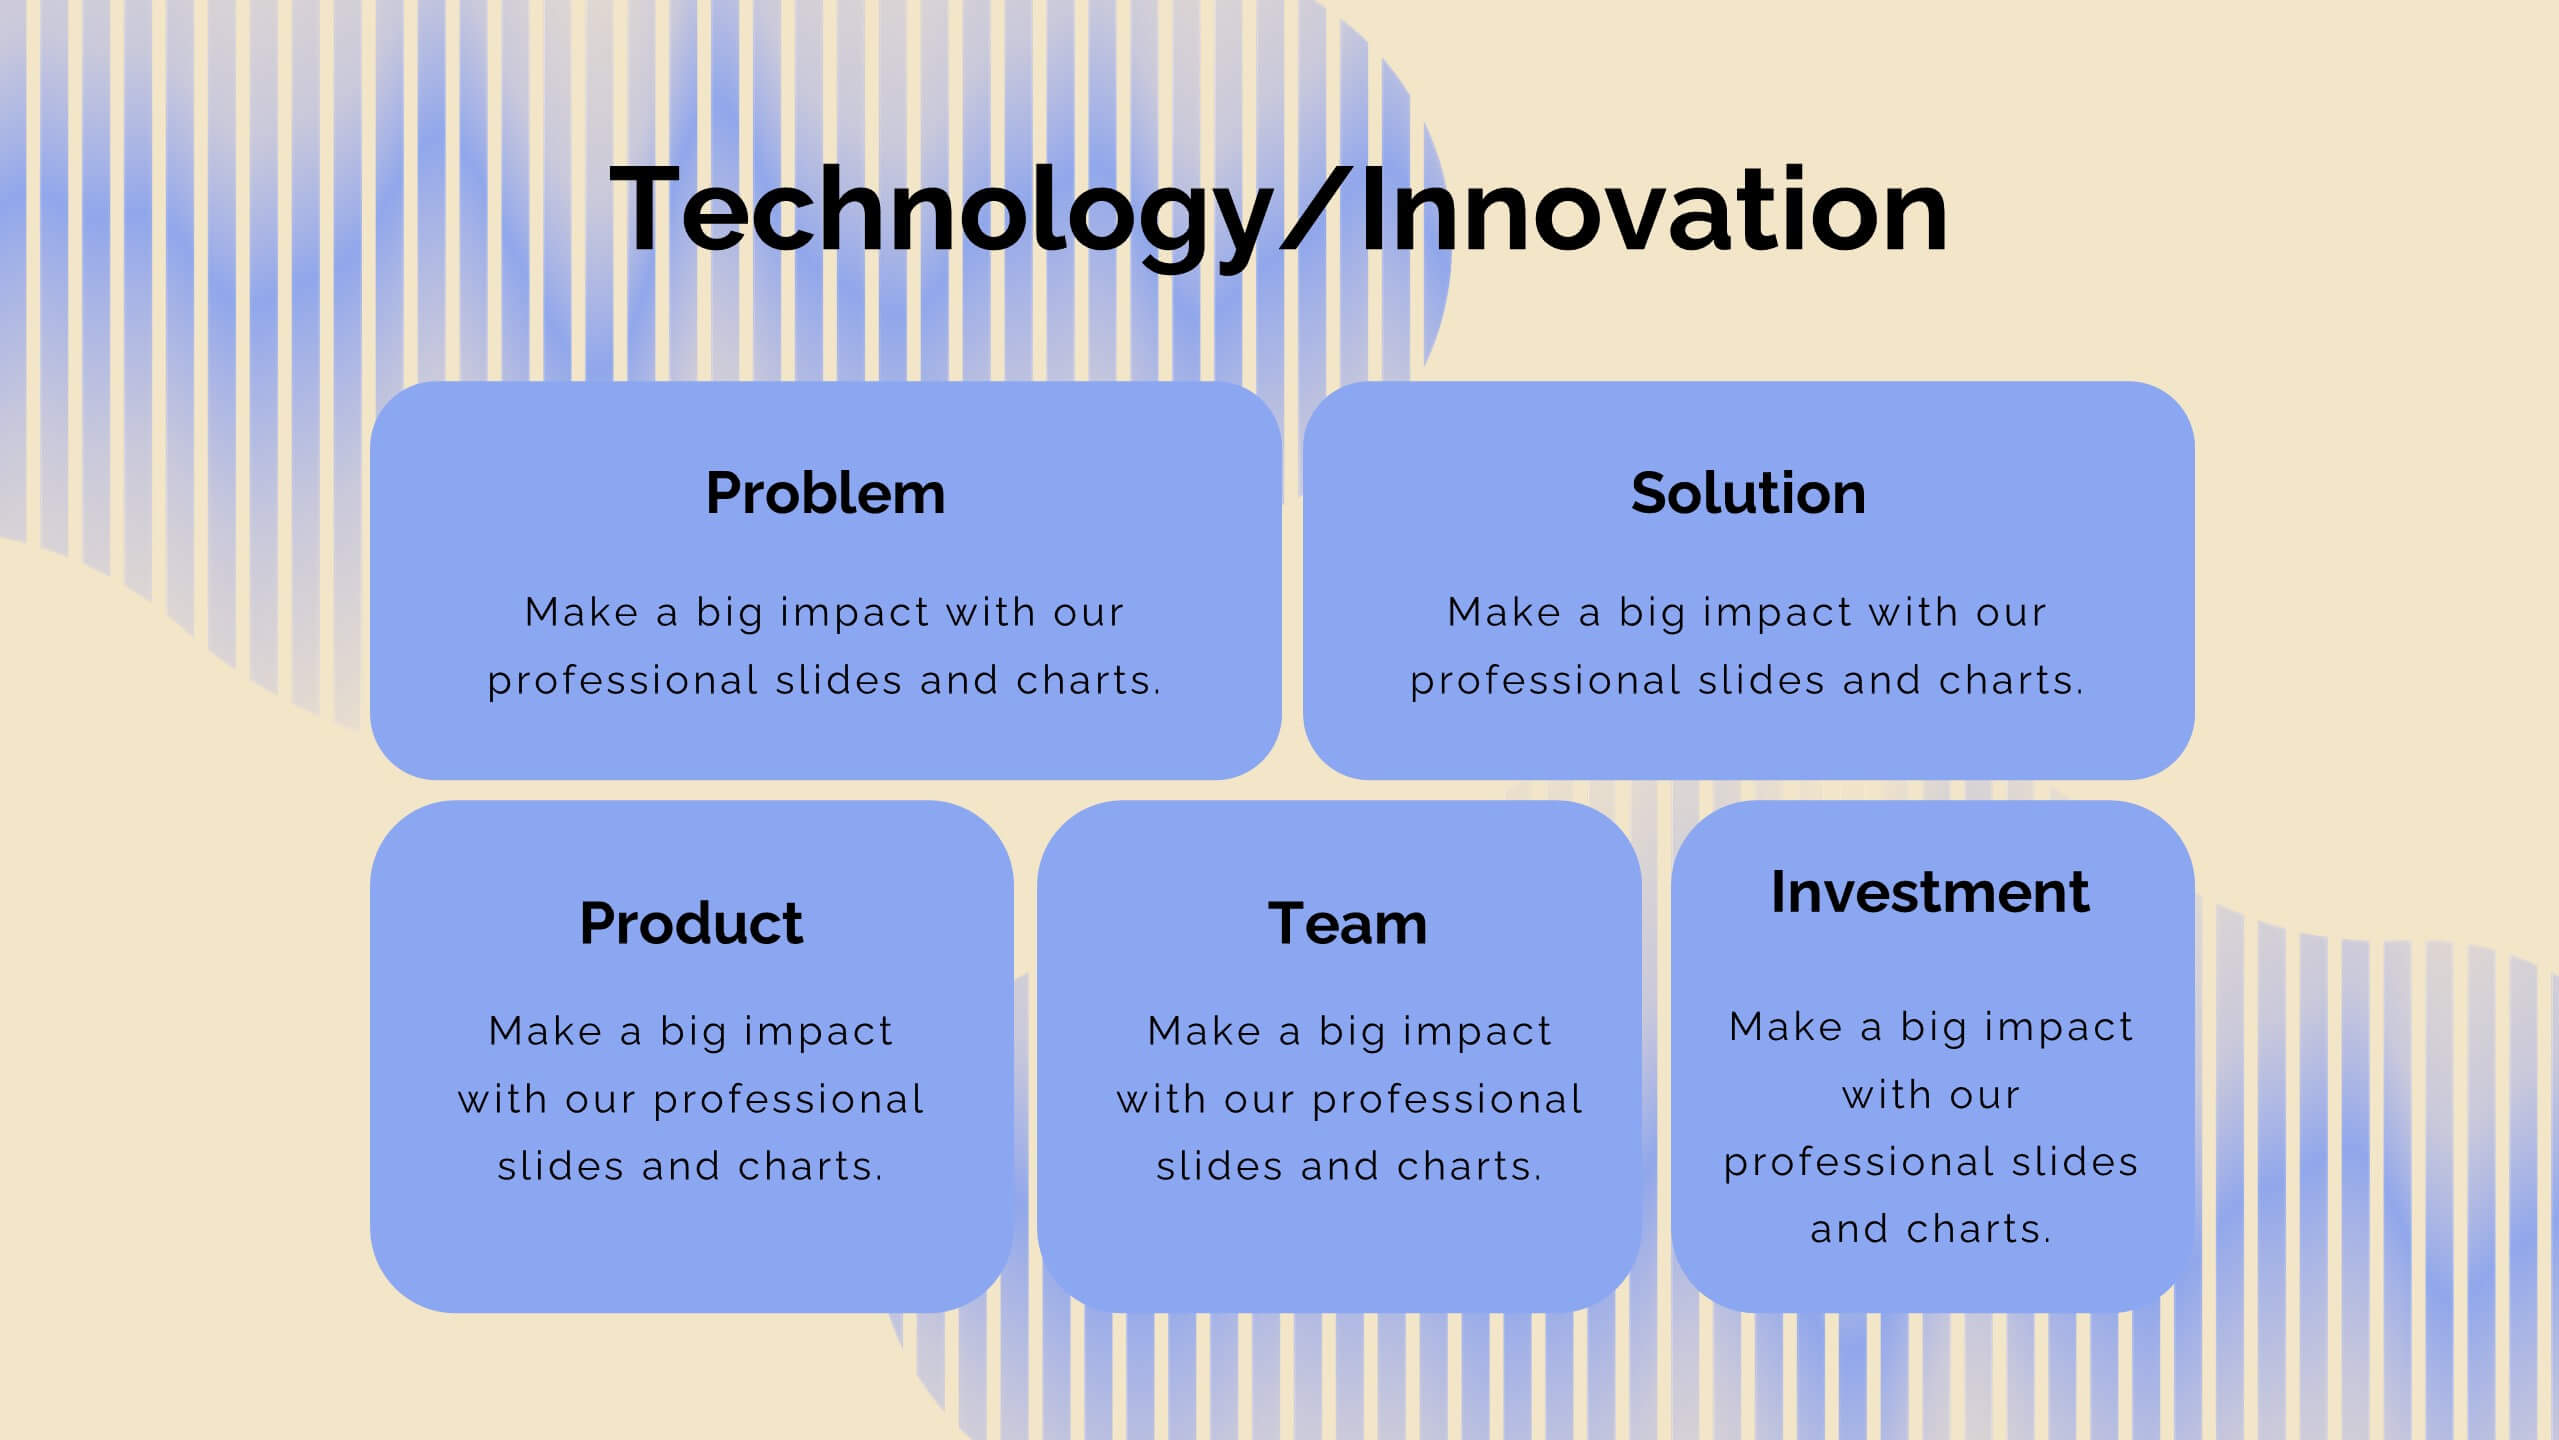
Embark on a seamless journey through your product’s lifecycle with this comprehensive roadmap template! Perfect for illustrating key milestones, business models, and market opportunities, it’s your go-to for clear and engaging presentations. Dive into competitive analysis, showcase your unique selling proposition, and outline your growth projections with style. Compatible with PowerPoint, Keynote, and Google Slides.


8 slides
Blue Ocean Strategy Business Model Presentation
Chart unexplored market territories with our Blue Ocean Strategy Business Model template! This dynamic presentation tool, designed to simplify complex business strategies, illustrates the pivotal elements of cost reduction and value innovation to unlock new buyer value. Compatible with PowerPoint, Keynote, and Google Slides, it's ideal for strategists aiming to create uncontested market spaces and make competition irrelevant. Perfect for workshops, business meetings, or strategy sessions.


6 slides
Stock Market Trends and Charts Presentation
Turn financial data into a story that’s easy to follow with this clean, professional layout designed to highlight market growth, patterns, and investment insights. Ideal for analysts and educators, it combines charts with sleek visuals. Fully compatible with PowerPoint, Keynote, and Google Slides for effortless customization.


4 slides
Data Science and AI Big Data
Visualize the core relationship between AI, data science, and analytics using this interconnected circular diagram. Ideal for tech professionals, researchers, and AI educators to explain data-driven processes clearly. Fully editable in PowerPoint, Keynote, and Google Slides for seamless customization.


5 slides
Corporate Goal Alignment and Execution Presentation
Drive strategic clarity with this streamlined Corporate Goal Alignment and Execution slide. This template visually connects key initiatives with execution pathways and end goals, using a funnel-style layout that highlights the flow from strategic inputs to measurable outcomes. Perfect for aligning teams, reporting progress, or visualizing OKRs. Fully customizable in PowerPoint, Keynote, and Google Slides.


7 slides
IT Architecture Solution Infographic
Enhance your presentations with our IT Architecture Solution infographic, tailored for optimal clarity in Powerpoint, Keynote, and Google Slides. This infographic offers a comprehensive visual tool to simplify complex IT structures, ideal for professionals aiming to articulate intricate systems with ease. Its design facilitates a clear understanding of hierarchical IT frameworks, making it perfect for educational environments, business meetings, and tech conferences. Our IT Architecture Solution infographic is crafted to aid in the seamless conveyance of IT strategies and structures. The intuitive layout provides a straightforward narrative to IT infrastructure, ensuring your audience grasps technical details without feeling overwhelmed. This infographic is a must-have for anyone presenting IT concepts, delivering a balanced combination of simplicity and detail that caters to both novice and expert levels. With compatibility across various presentation platforms, this infographic integrates smoothly into your existing slides, enhancing your ability to communicate effectively in the digital age. Elevate your IT presentations with this essential visual aid.


4 slides
AIDA Marketing Model Presentation
Optimize your marketing strategy with this AIDA Marketing Model Presentation template. Featuring a visually appealing funnel diagram, this template clearly outlines the Attention, Interest, Desire, and Action stages of customer engagement. Ideal for marketers, sales professionals, and business analysts. Fully customizable and compatible with PowerPoint, Keynote, and Google Slides.


23 slides
Tempest Design Portfolio Presentation
Elevate your creative showcase with the Tempest Design Portfolio Presentation template! This beautifully crafted layout is designed to highlight your best work in a sophisticated and professional manner. The subtle earthy tones and minimalist design create a perfect backdrop for presenting your projects, from the initial concept to the final execution. Whether you're an individual designer or a creative agency, this template allows you to elegantly present your portfolio, philosophy, and style, making a powerful impact on your audience. Each slide is thoughtfully designed to emphasize your achievements, client testimonials, and services offered, ensuring that your work shines through with clarity and style. Ideal for client presentations, creative pitches, or showcasing your portfolio online, this template is fully compatible with PowerPoint, Keynote, and Google Slides. Make your design story unforgettable with the Tempest template, and let your creativity speak volumes!


11 slides
Company Team Meeting Presentation
Bring your team together with our dynamic Company Team Meeting presentation template. Designed for clarity and engagement, this template sets the stage for productive discussions, from weekly roundups to strategic planning sessions. It begins with a vibrant cover slide that sets an upbeat tone for the meeting, followed by a clear agenda to keep your discussion on track. With slides tailored for talking points, updates, upcoming events, and deadlines, it helps you streamline the flow of information. The template includes sections for announcements and feedback, encouraging open dialogue. Ground rules are laid out to foster a respectful and collaborative environment, while the progress and challenges slides are perfect for a transparent review of the company's status and addressing any hurdles head-on with practical solutions. This template, adaptable to PowerPoint, Keynote, and Google Slides, not only captures attention with its colorful design but also reinforces team cohesion and focus on common goals. Use it to energize your team meetings and ensure everyone leaves aligned and motivated.

21 slides
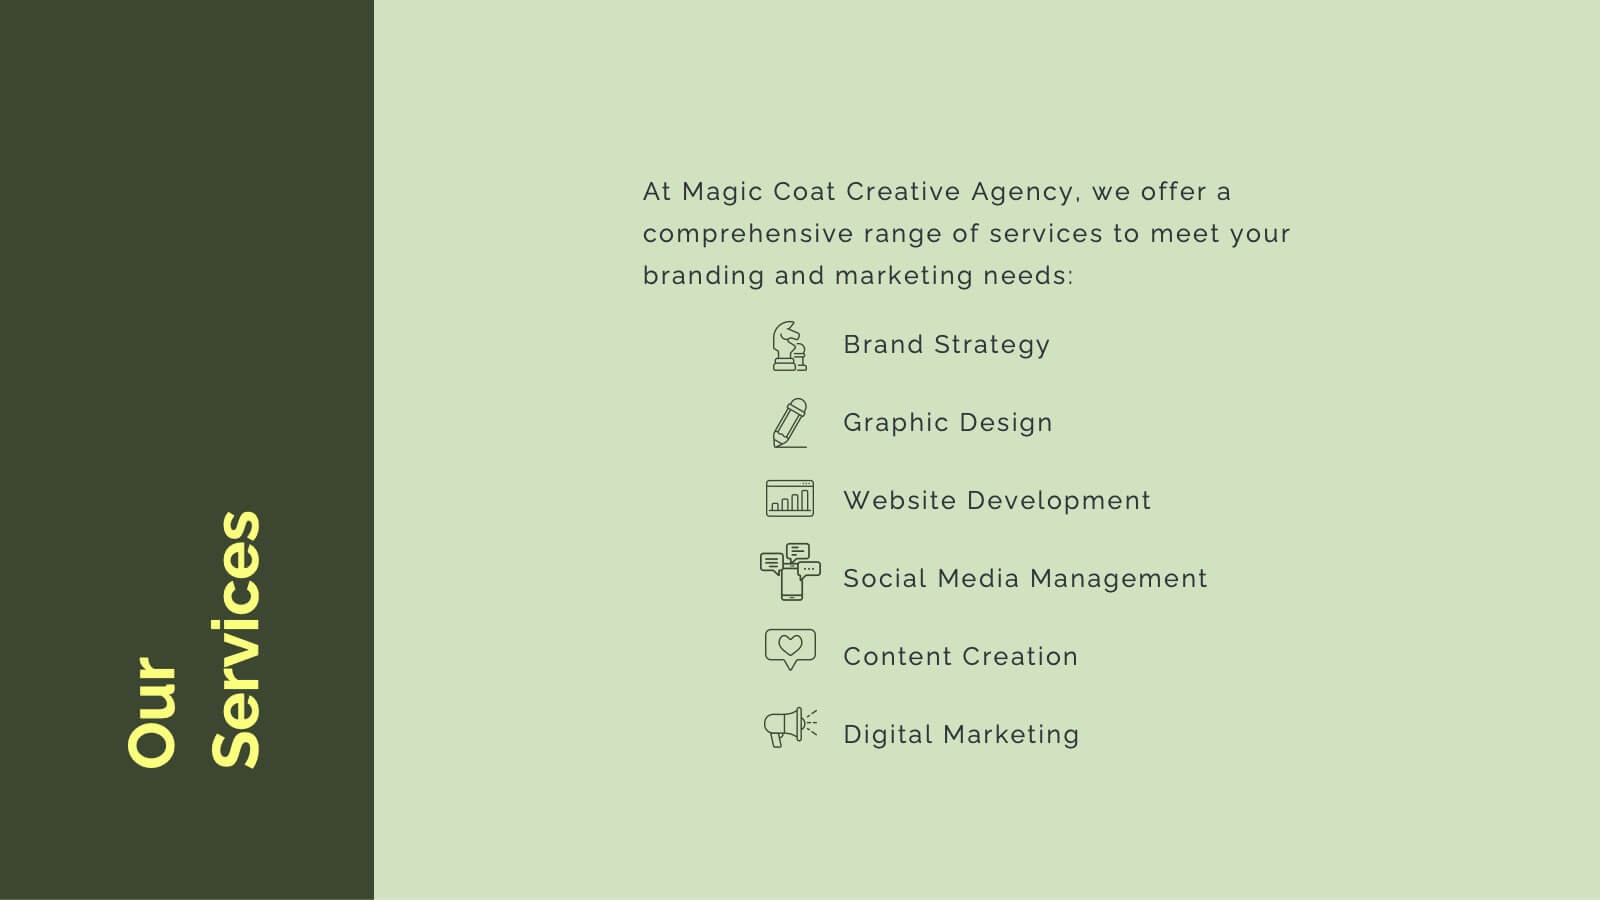
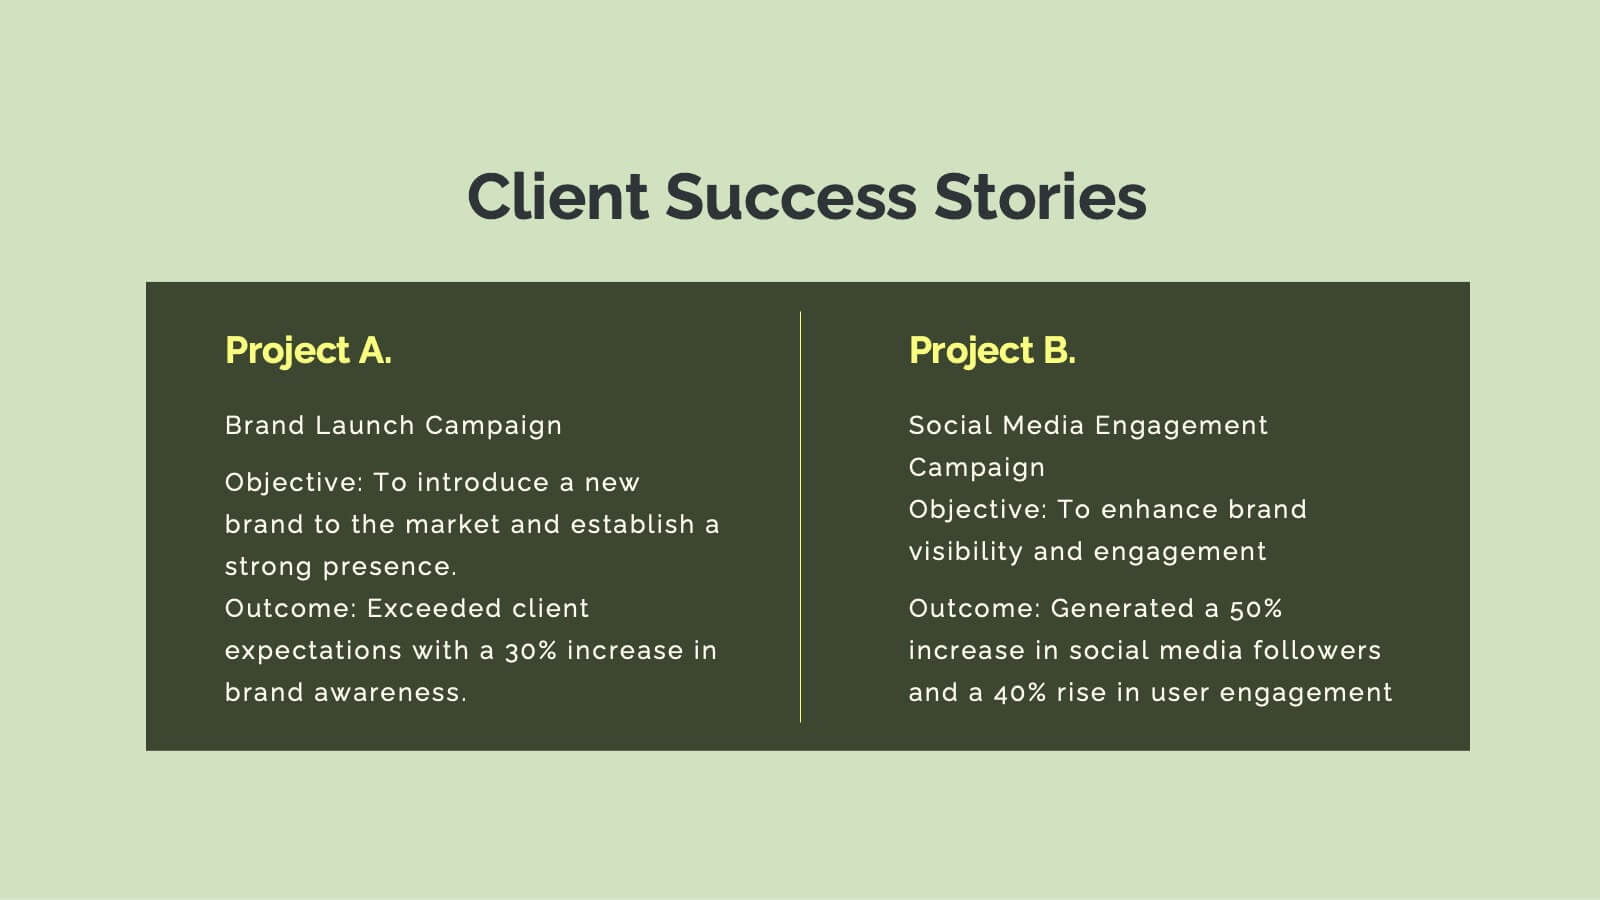
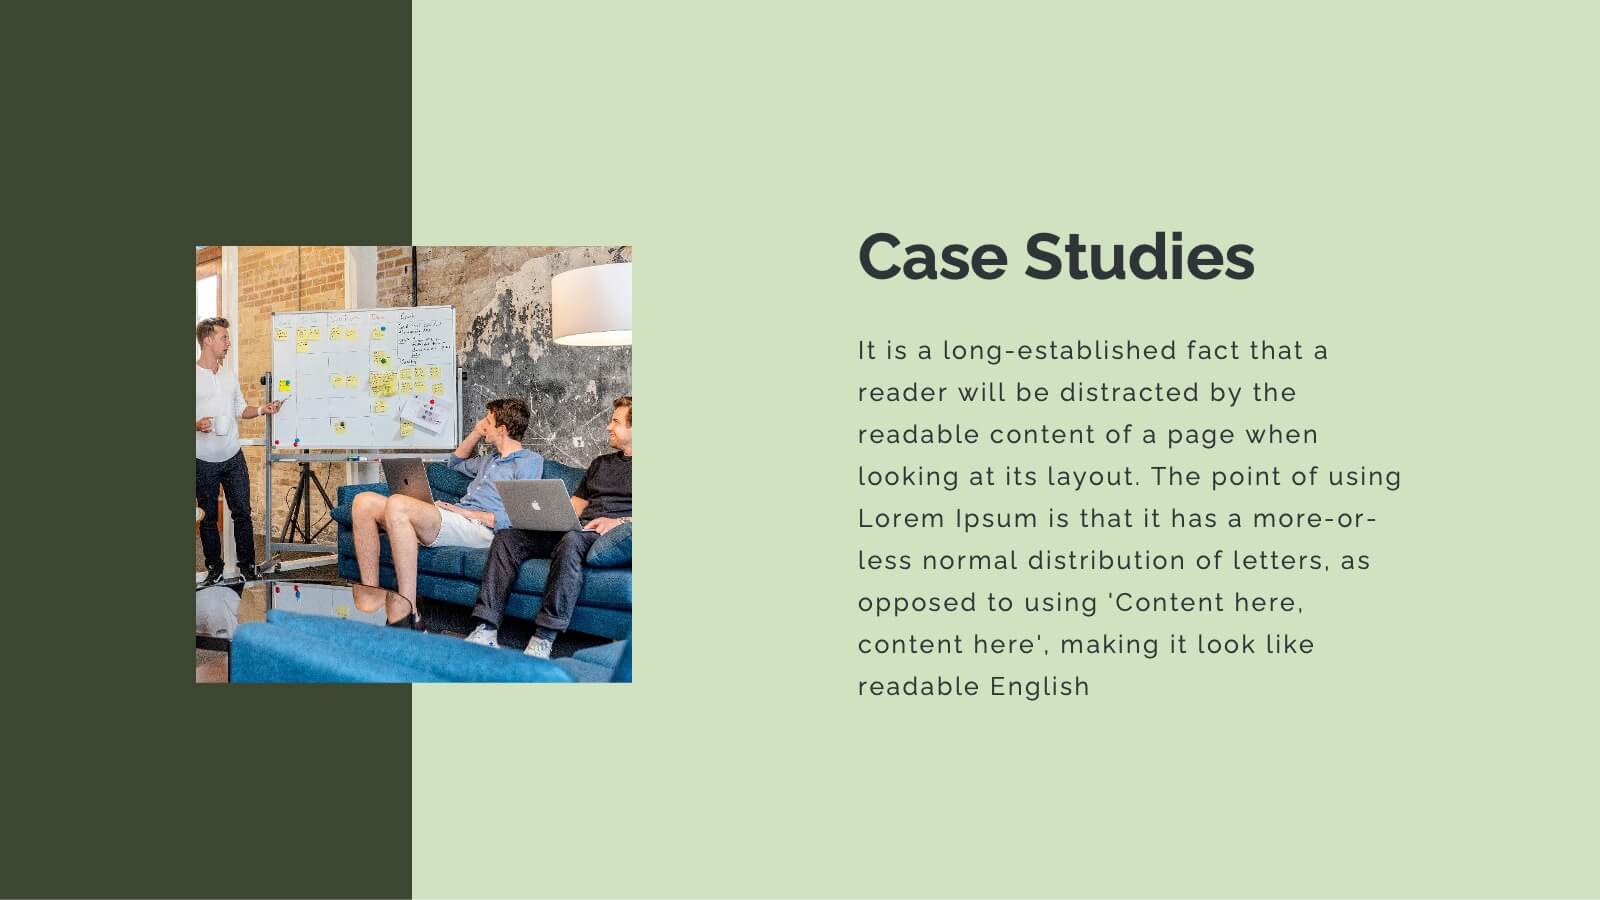
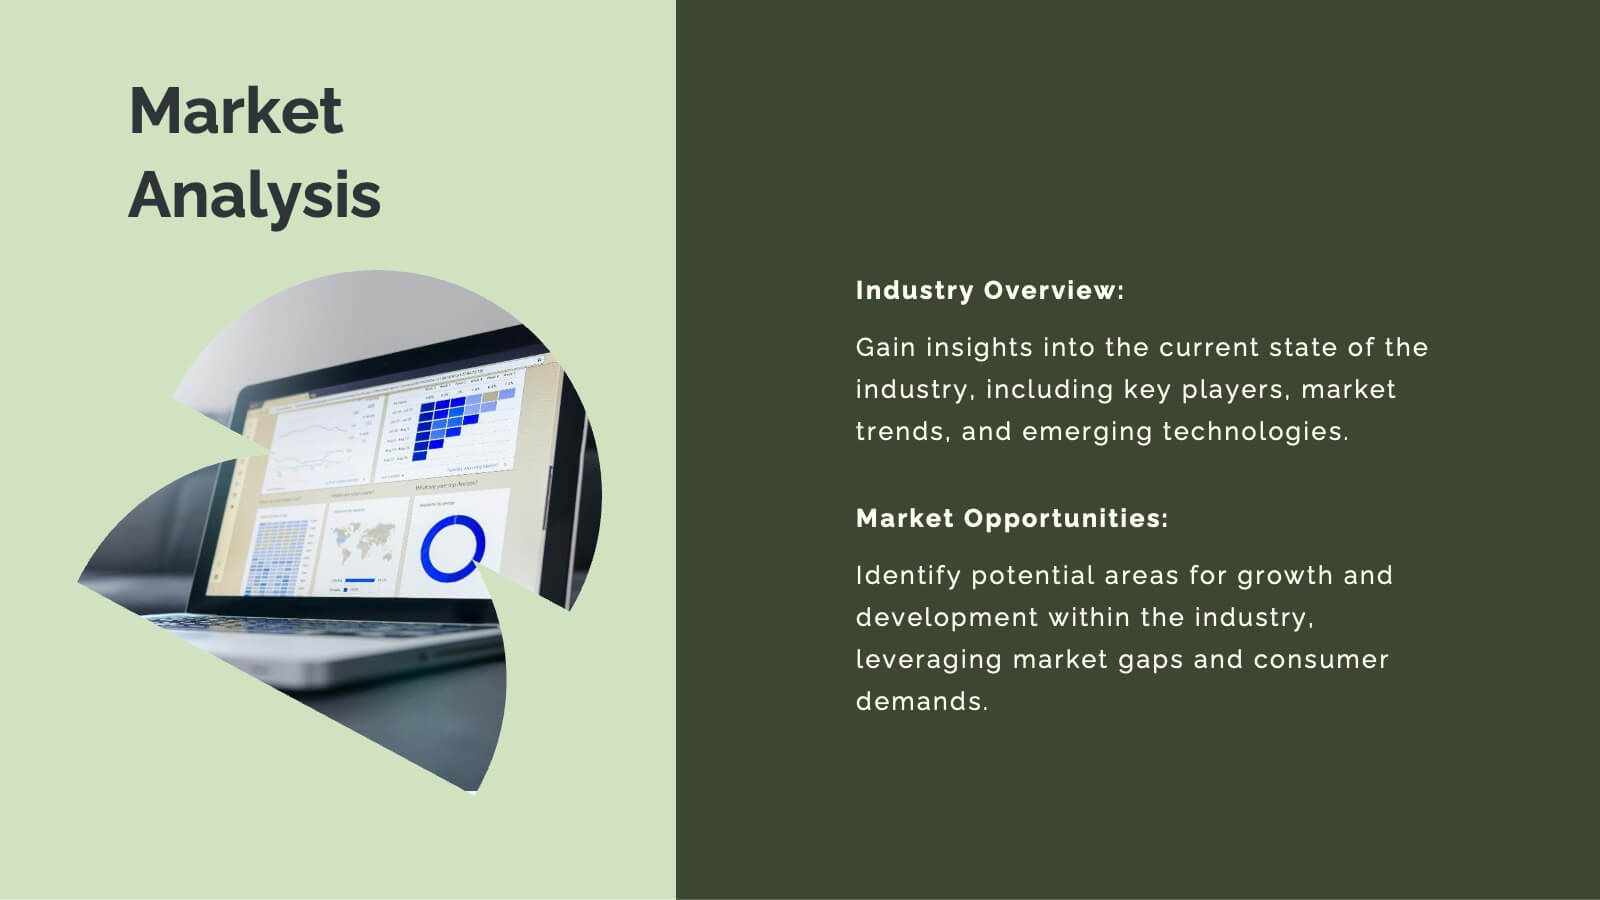
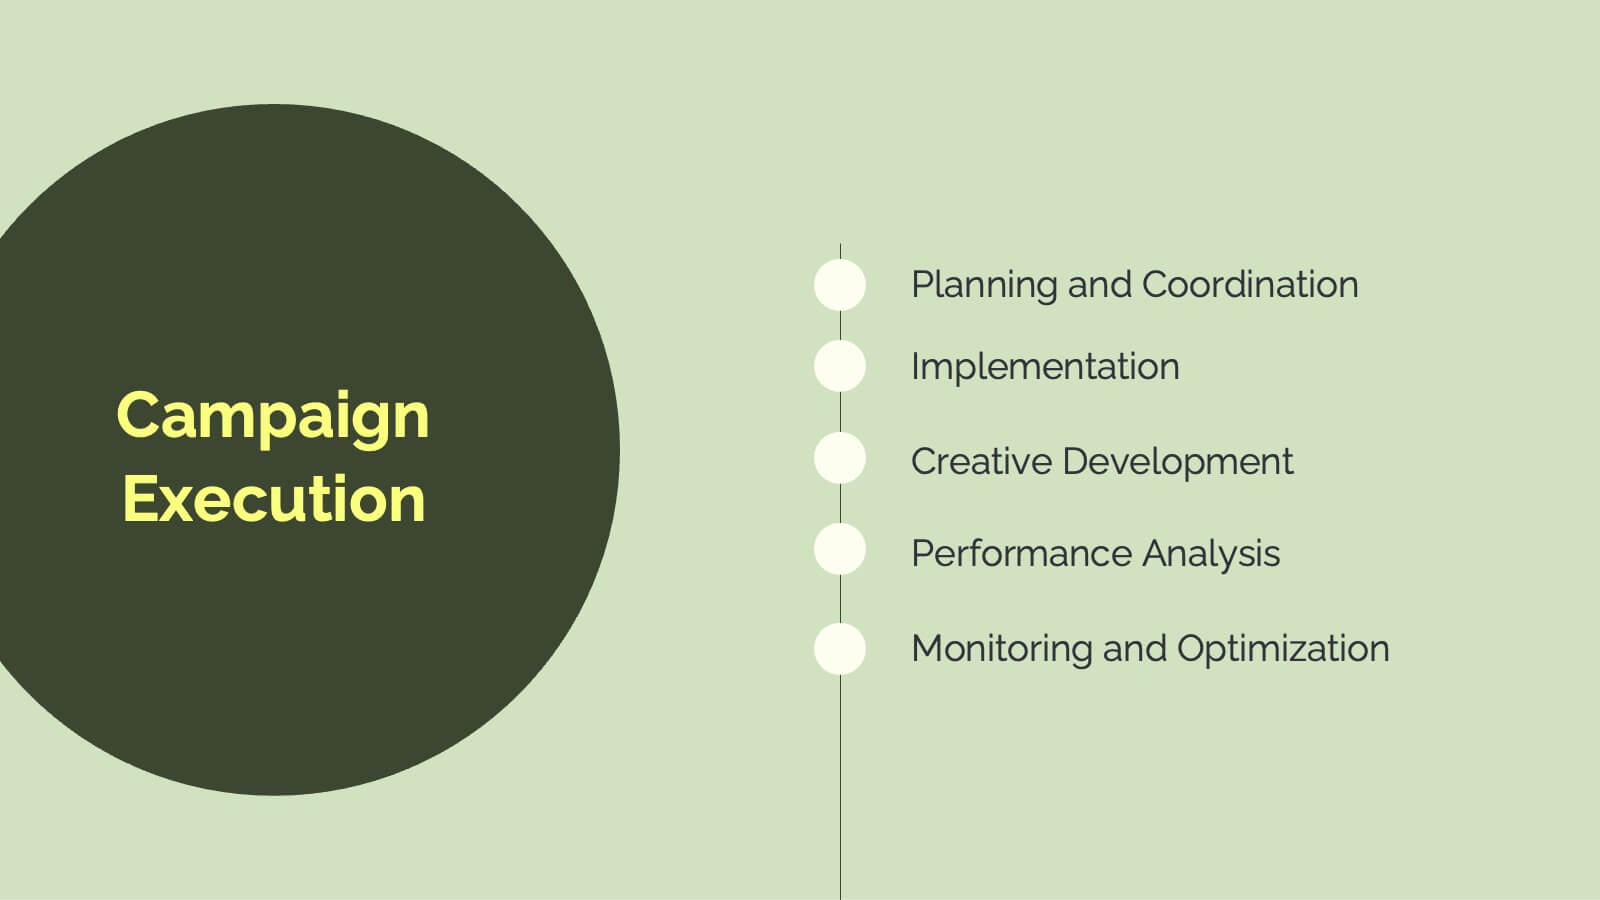
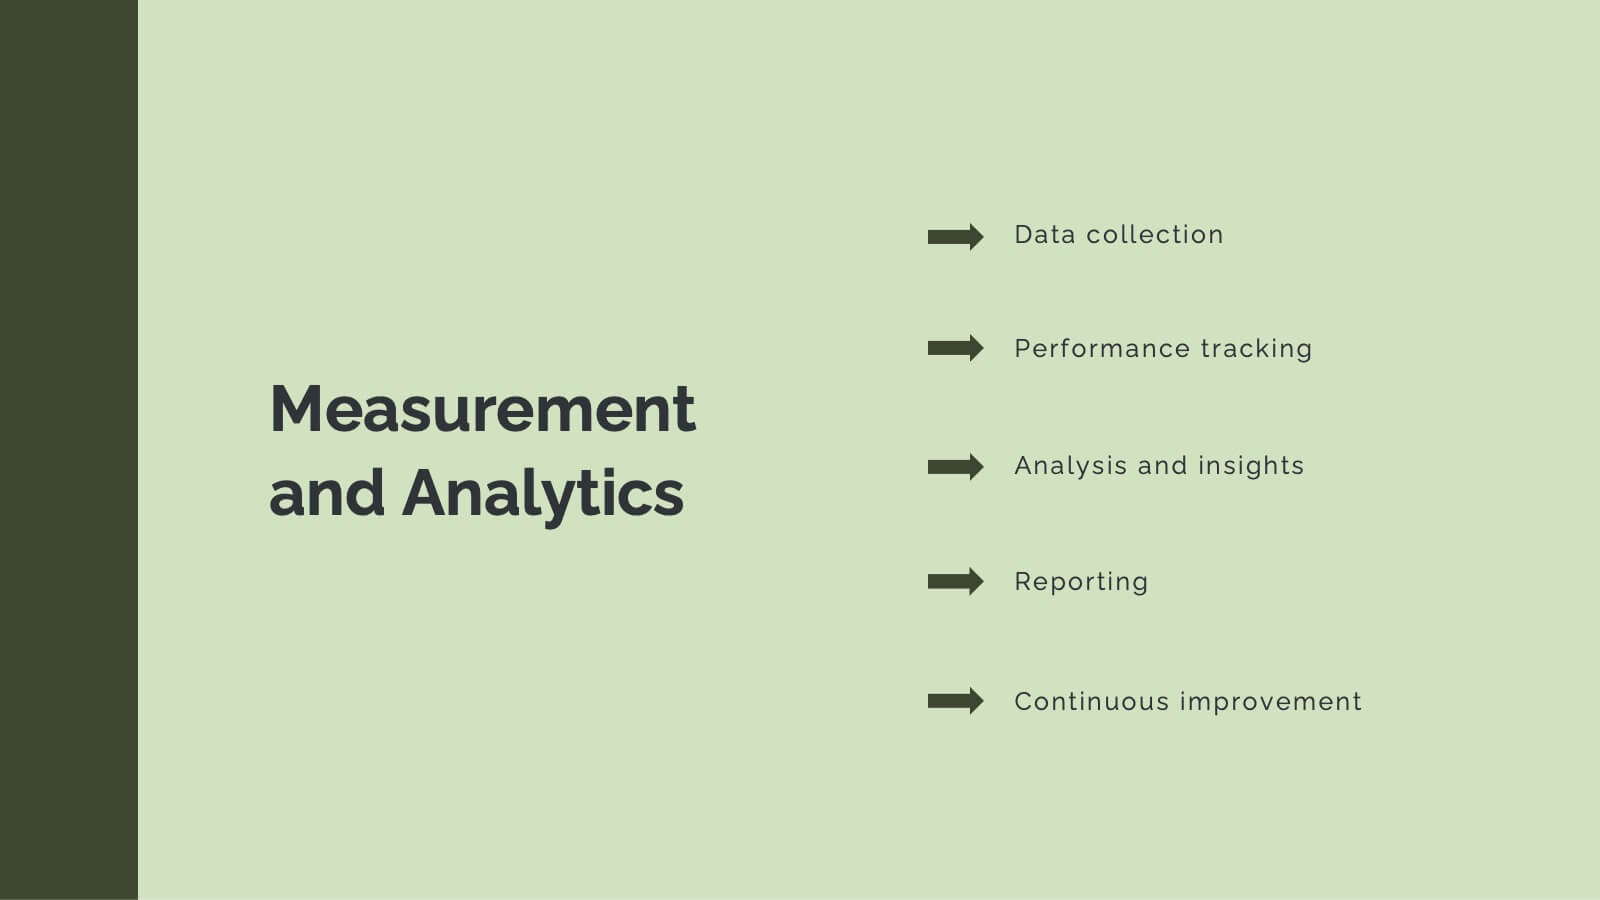
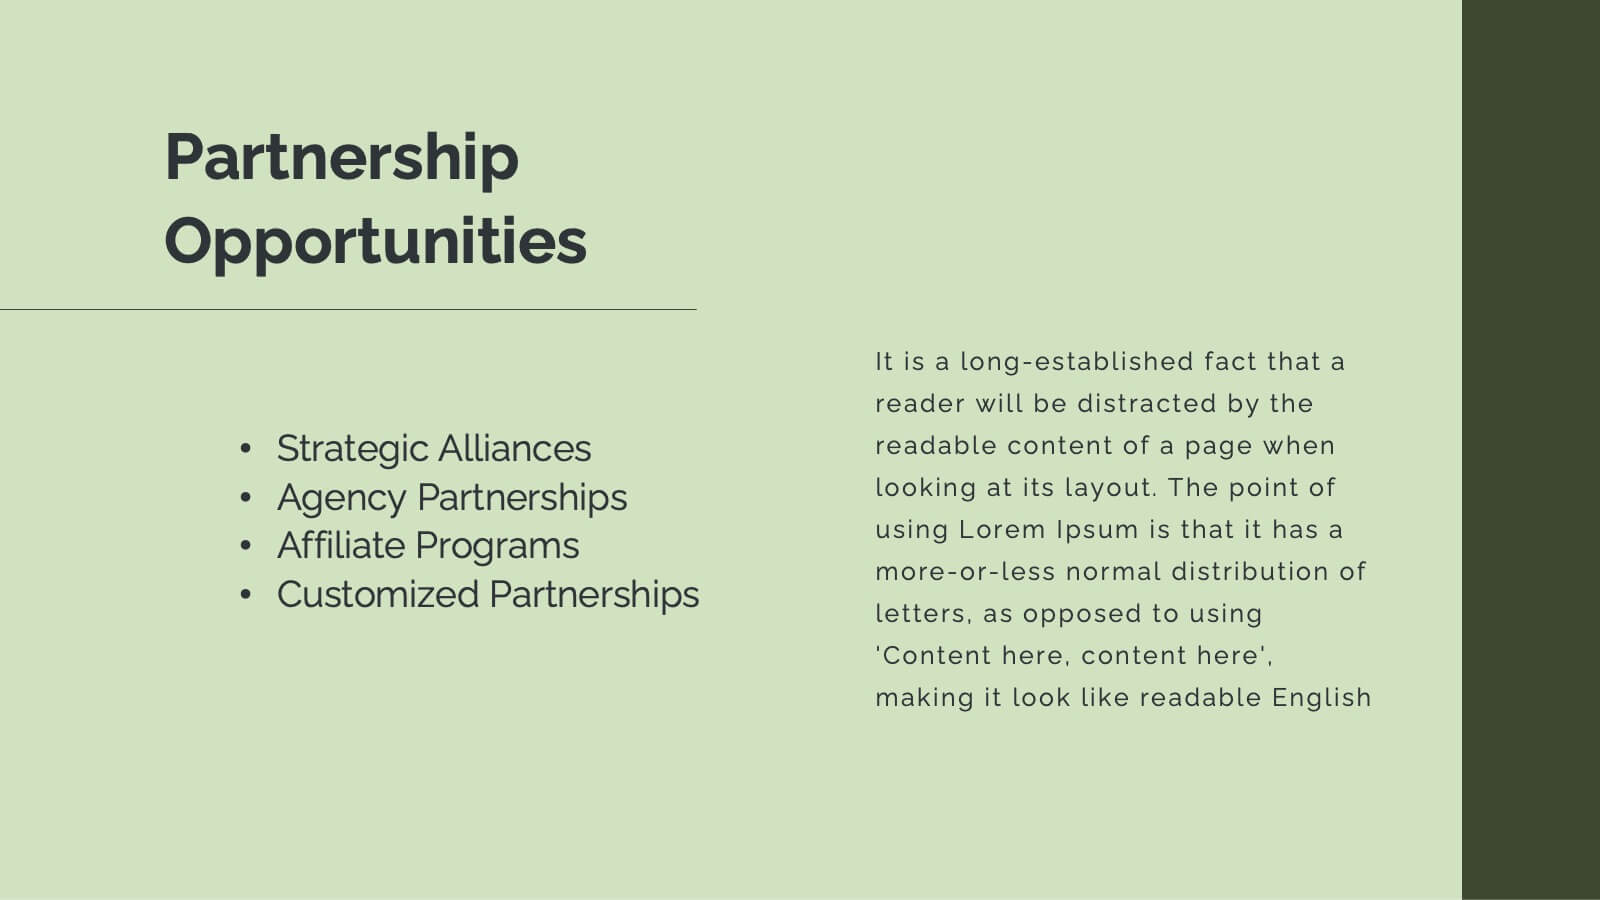
Horizon Advertising Agency Proposal Presentation
Elevate your advertising impact with this comprehensive agency proposal template. It’s meticulously designed to showcase your agency’s capabilities from strategic planning to creative execution, ensuring a persuasive presentation of services like market analysis, campaign strategies, and client success stories. Each slide is formatted to facilitate understanding and engagement, making it perfect for highlighting your team's expertise and unique approach. Compatible with major presentation platforms like PowerPoint, Google Slides, and Keynote, this template supports your efforts to secure new clients and projects seamlessly across various devices.


6 slides
Project Summary Report Presentation
Enhance your project reviews with our "Project Summary Report Presentation" template. This slide is expertly designed to summarize key project aspects such as objectives, milestones, and outcomes, structured into sections labeled A, B, and C. Featuring an image of a collaborative team setting, the template underscores the essence of teamwork and productivity in project management. Each section is organized to clearly communicate your project’s progress and results to stakeholders. Ideal for project managers and teams, this template supports effective storytelling in project updates. Compatible with PowerPoint, Keynote, and Google Slides, it’s an essential tool for delivering impactful and organized project presentations.


4 slides
Risk Assessments Matrix Presentation
Bring clarity to complex decisions with this bold, color-coded layout designed to pinpoint threats, compare impact levels, and communicate risks with confidence. This presentation makes evaluation simple, structured, and visually clear for any audience. Fully editable and ready for professional use. Compatible with PowerPoint, Keynote, and Google Slides.


6 slides
Corporate Framework Planning Presentation
Organize and present your strategic plans with this clean corporate framework layout. Ideal for showcasing six key areas of focus, this slide helps communicate business insights, goals, and execution pillars clearly. Fully editable in Canva, PowerPoint, and Google Slides—perfect for business plans, executive meetings, or internal project reviews.