


Features
- 3 Unique slides
- Fully editable and easy to edit in Microsoft Powerpoint, Keynote and Google Slides
- 16:9 widescreen layout
- Clean and professional designs
- Export to JPG, PDF or send by email


Do you have any questions?
Recommend


7 slides
Design Team Infographic
The displayed slides are specifically tailored for design teams, reflecting a strong focus on visual elements that convey creative processes and team structures. Each slide is crafted to enhance the presentation of design projects, illustrating workflows, team roles, and project milestones with a visually appealing approach. The collection utilizes a vibrant color palette and dynamic shapes to keep the viewer engaged, making these templates ideal for showcasing design projects, brainstorming sessions, and team capabilities in a clear and aesthetically pleasing manner. The templates feature various layouts including organizational charts, process diagrams, and brainstorming tools that facilitate effective communication of design concepts and strategies. They are designed to be versatile, supporting a wide range of design projects from graphic and digital design to UI/UX prototypes. This set serves as an essential tool for design teams to demonstrate their methods, track project progress, and showcase their creative solutions to clients or stakeholders, ensuring that every aspect of the design process is both understood and visually compelling.


19 slides
Kale Product Strategy Report Presentation
Unleash the power of your product with this bold and dynamic product strategy report template! Elevate your presentation with eye-catching designs that showcase product features, competitive analysis, and pricing strategies like never before. Captivate your audience from start to finish and leave a lasting impression. Fully compatible with PowerPoint, Keynote, and Google Slides!


6 slides
Mental Health Infographics
The "Mental Health" infographic template, suitable for PowerPoint, Keynote, and Google Slides, is an essential resource for healthcare professionals, educators, and mental health advocates. This sensitive and informative template is designed to communicate important aspects of mental health in a compassionate and accessible manner. This template covers critical topics such as mental health awareness, coping strategies, and support resources. It is structured to facilitate discussions on mental well-being, making it an invaluable tool for educational presentations, awareness campaigns, and support group discussions. Featuring a calming and empathetic design, the template uses a soothing color scheme with pastel shades of light blue, green, and lavender. This creates a serene and understanding atmosphere that is supportive of mental health topics. Whether used in a clinical setting, classroom, or community workshop, this template ensures that information about mental health is presented in a sensitive, informative, and visually appealing way.


5 slides
History of Photography Infographics
The History of Photography traces back to the early 19th century when the concept of capturing and preserving images through a camera was first realized. These infographic templates provide a visually stunning format to showcase the key milestones, influential photographers, and technological advancements that shaped the history of photography. The template consists of vertical infographics, making it easy to present information in a visually appealing and organized manner. It is compatible with Powerpoint, Keynote, and Google Slides, ensuring seamless customization and adaptability to your specific needs.


6 slides
4-Segment Ideal Buyer Persona Presentation
Bring clarity to your audience with a clean, structured slide that breaks down who your ideal customer truly is. This presentation helps you outline background, goals, challenges, learning habits, interests, and preferences in an easy-to-follow format. Fully compatible with PowerPoint, Keynote, and Google Slides.


5 slides
Movies & Film Market Infographics
Step into the spotlight with our movies & film market infographics, designed to orchestrate your data into a cinematic experience. In the enchanting hues of blue and purple, this template captures the essence of the big screen, offering a vertical layout that resonates with the the film industry. It's a tool for film marketers, and cinema analysts, providing a platform to depict trends, and reviews with a touch of Hollywood style. The set includes captivating graphics, themed icons, and adaptable image placeholders, all curated to help you direct your audience's attention to key insights in the ever-evolving realm of movies and entertainment.
10 slides
Educational Goals and Progress Tracking Presentation
Track academic milestones with ease using the Educational Goals and Progress Tracking Presentation. This timeline-style visual is perfect for mapping learning objectives, course progression, or academic achievements. Great for teachers, trainers, or student planning sessions. Fully editable in PowerPoint, Keynote, Canva, and Google Slides.


4 slides
Strategic Takeaways and Final Points Presentation
Summarize key insights and final thoughts with this clean, icon-based layout. Ideal for wrapping up business reviews, strategy decks, or executive briefings, each section includes room for concise summaries and visuals. Easily customizable in PowerPoint, Keynote, and Google Slides to match your brand and presentation goals.


10 slides
Innovation in Science Presentation
Showcase cutting-edge ideas with this Innovation in Science Presentation Template. Featuring a sleek lightbulb graphic with colorful horizontal bars, it's ideal for outlining research stages, technological breakthroughs, or futuristic concepts. Great for scientists, educators, and innovation teams. Easily customizable in PowerPoint, Keynote, and Google Slides.


5 slides
Business Decision-Making Questions
Streamline critical thinking with this interactive Business Decision-Making Questions template. Featuring a creative circular diagram and visual cues, it helps structure questions around options, evaluations, and outcomes. Ideal for brainstorming, strategic planning, and executive decision sessions. Fully editable in PowerPoint, Keynote, and Google Slides.


6 slides
Education Services Infographic
Education services refer to the various activities and resources provided to facilitate learning and knowledge acquisition. This infographic template showcases various education services and their benefits. This infographic is designed to highlight the different aspects of education services and their impact on individuals and society as a whole. The infographic features a vibrant and eye-catching design that captures attention and engages viewers. The use of bright colors and appealing illustrations makes the infographic visually appealing and memorable. Compatible with Powerpoint, Keynote, and Google Slides.


22 slides
Metaphor Advertising Agency Proposal Presentation
The Advertising Agency Proposal Presentation Template offers a polished structure to present your agency's expertise. With slides covering mission, case studies, services, and market analysis, it’s designed to leave a lasting impression. Perfect for securing new clients, it’s fully editable and works seamlessly with PowerPoint, Keynote, and Google Slides.


6 slides
Informational Data Table Overview Presentation
Present your tasks with clarity using this Informational Data Table Overview presentation. Perfect for team planning, status updates, or project management, this slide helps you organize tasks by name, due date, priority, and assignment. Visual indicators make it easy to track progress at a glance. Fully editable in PowerPoint, Canva, and Google Slides.


21 slides
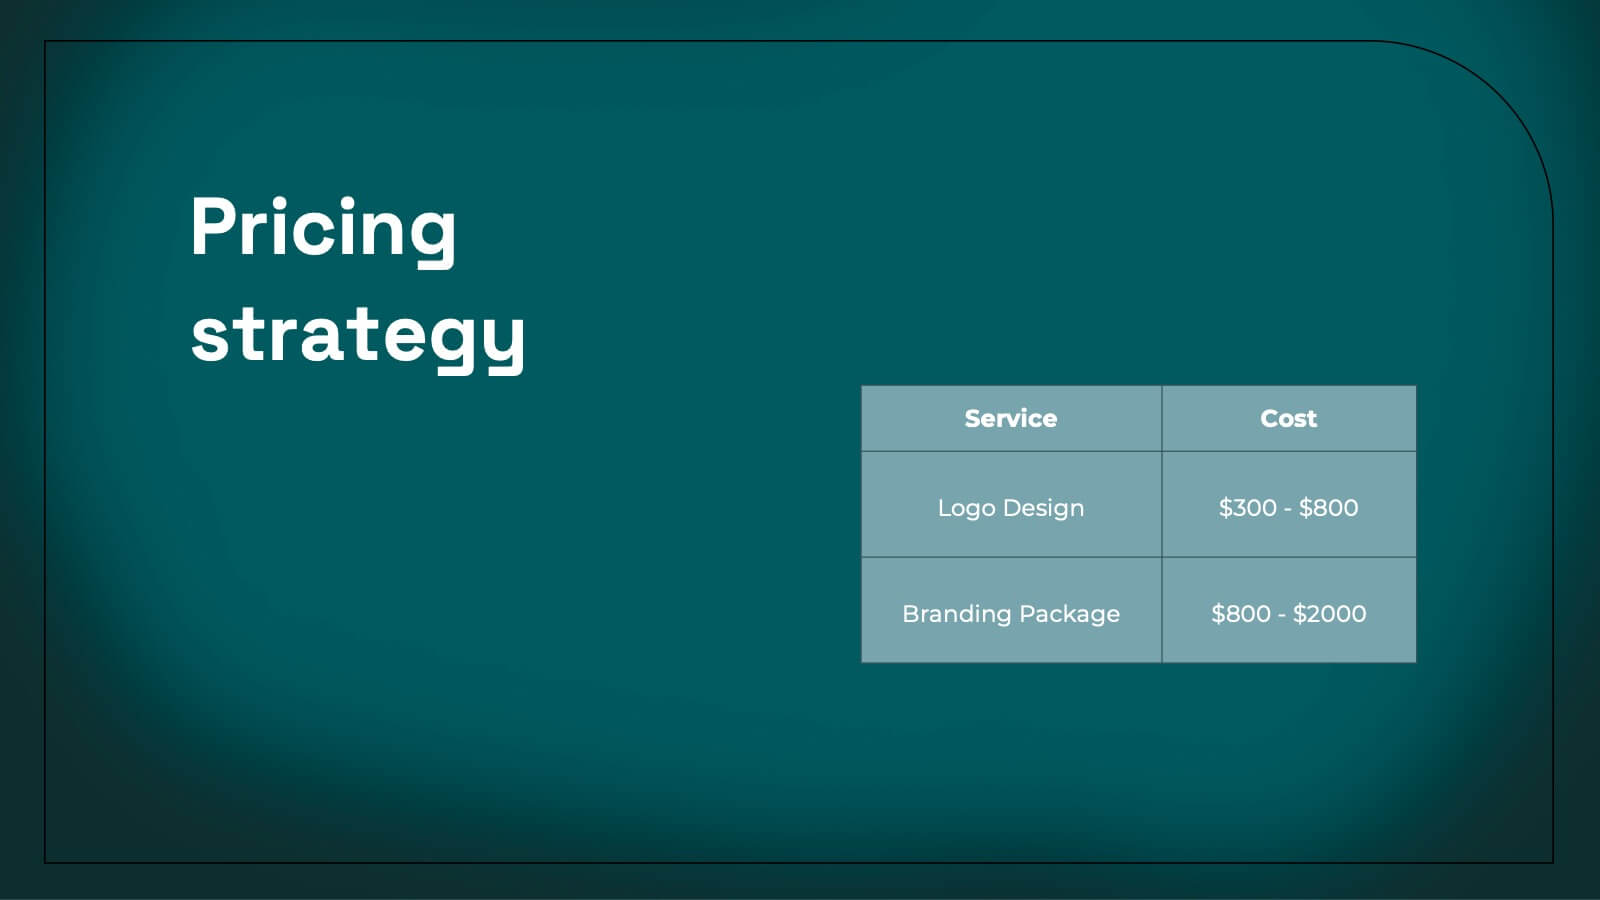
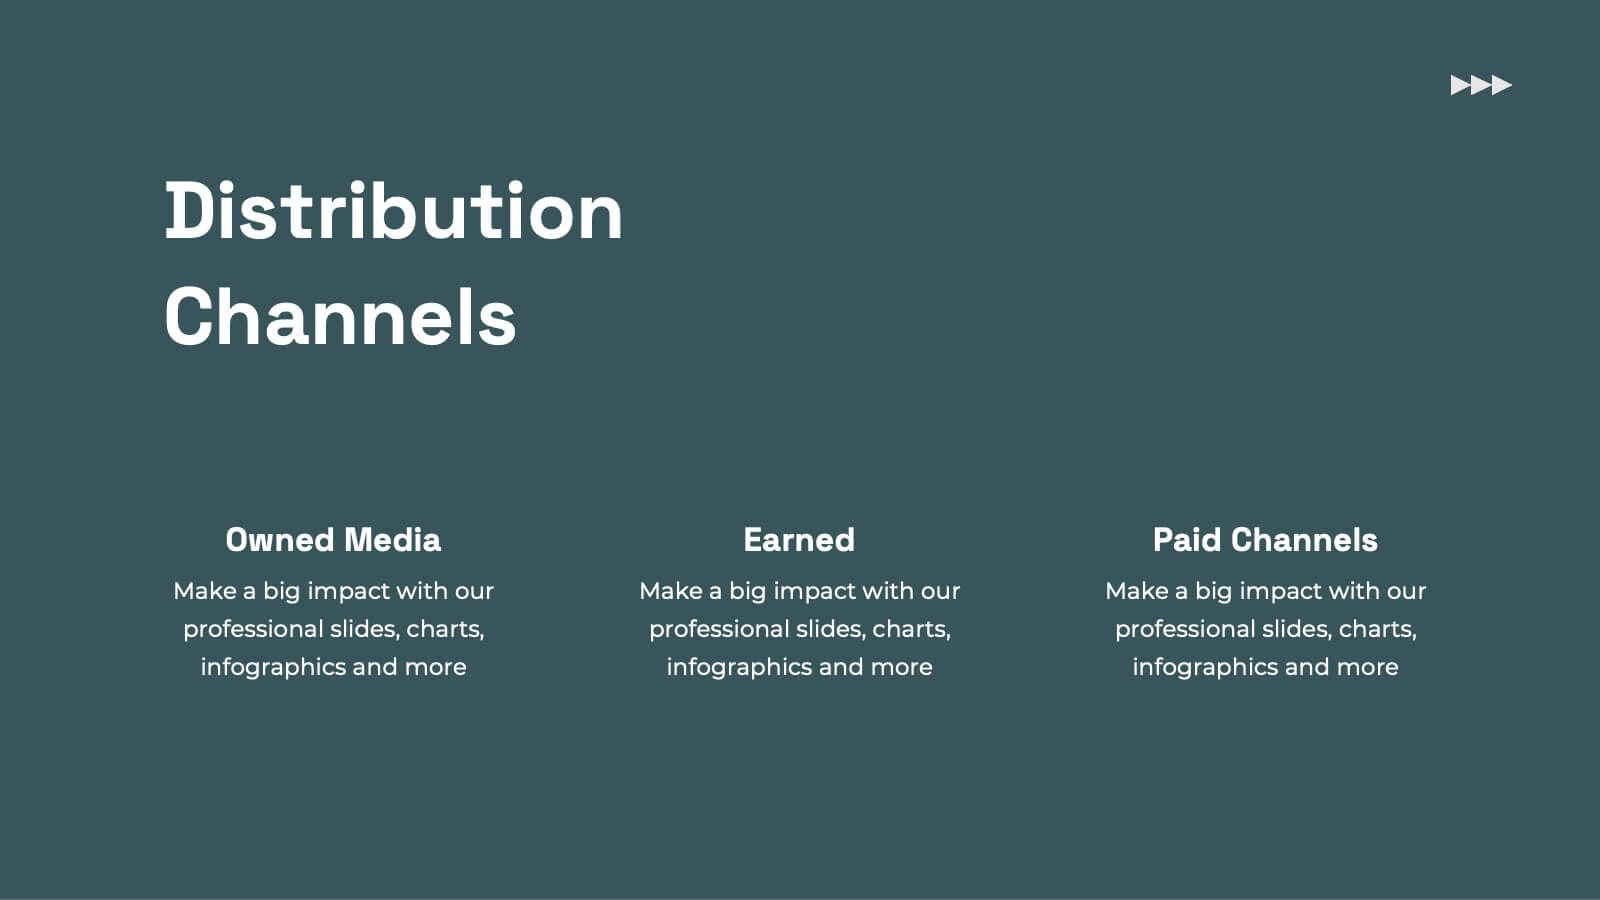
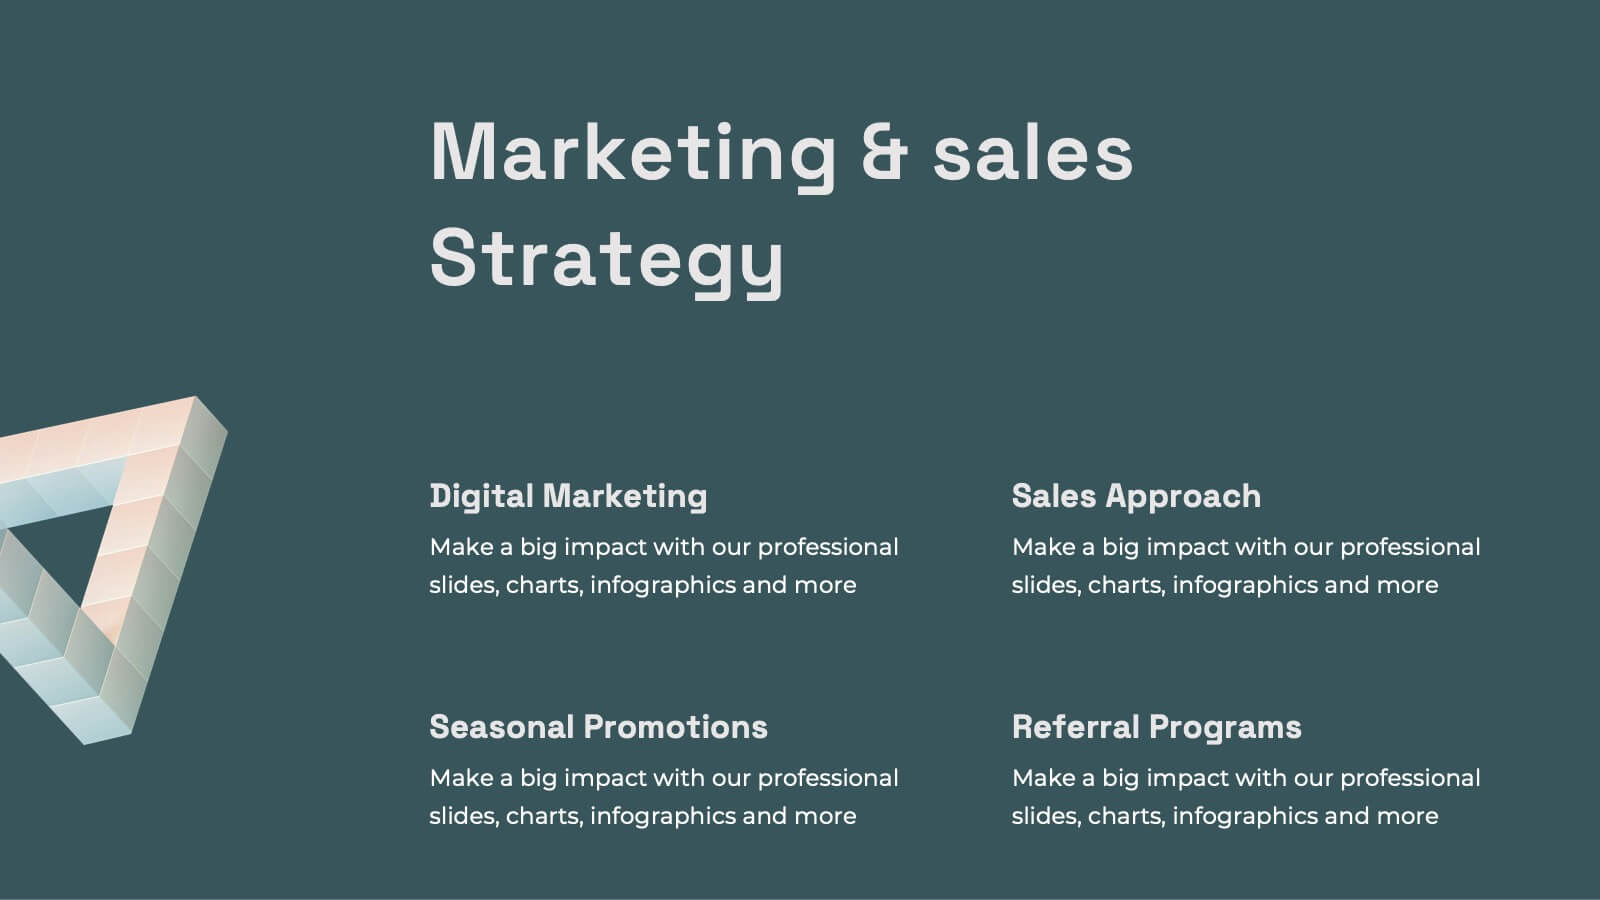
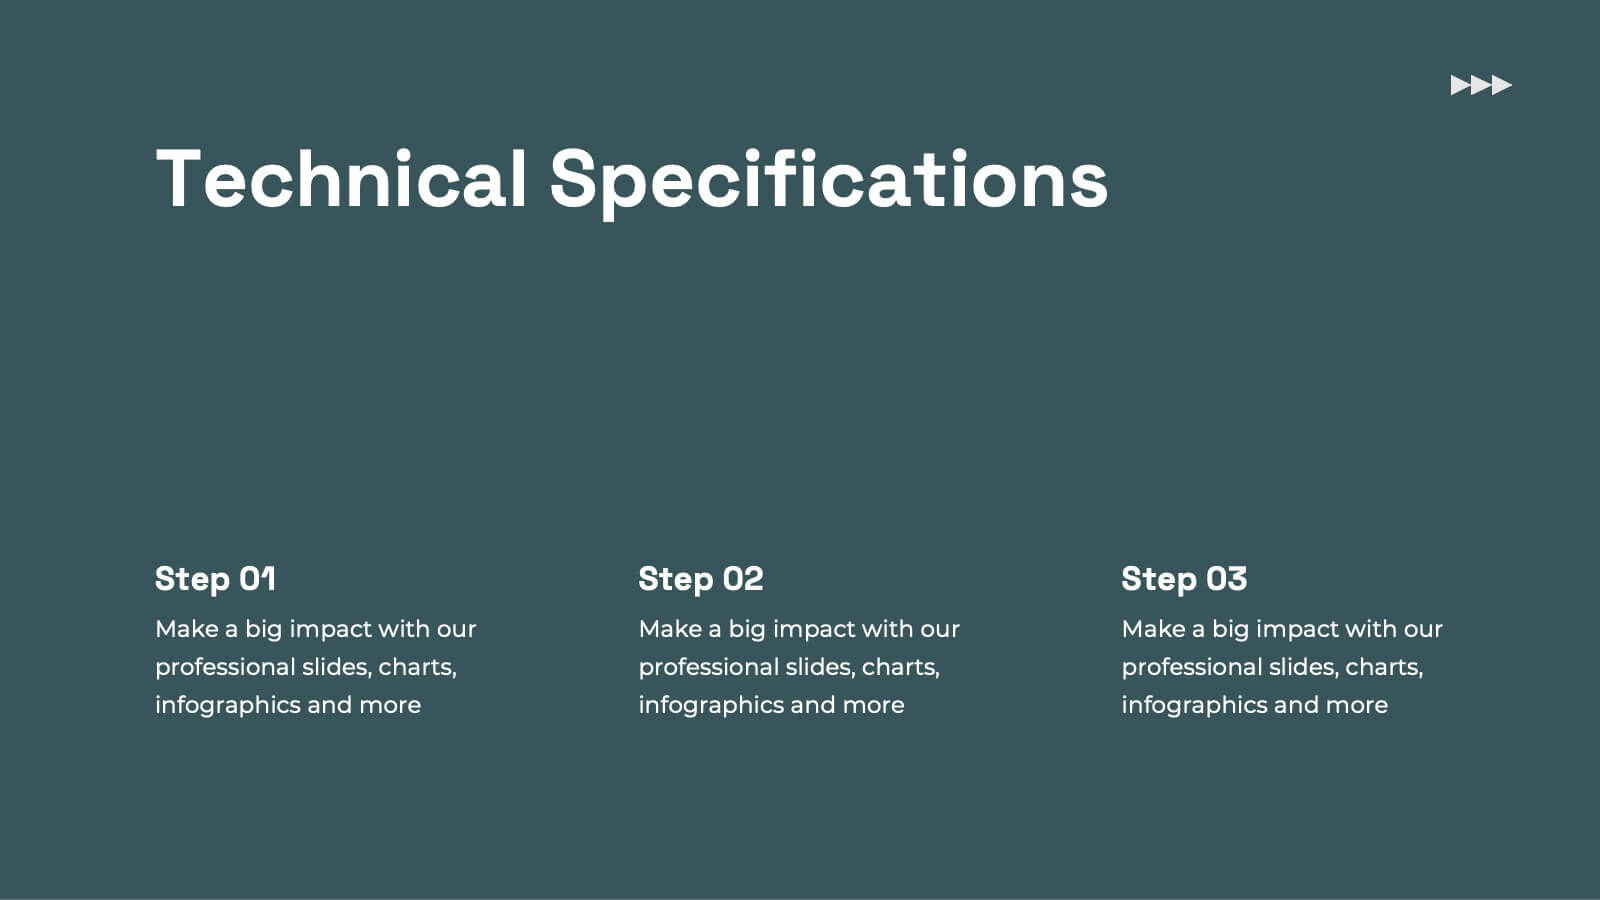
Eldritch Product Roadmap Presentation
The Product Roadmap Presentation Template features 21 modern slides, including product overviews, features, pain points, technical specs, and marketing strategies. Its sleek gray-yellow design ensures professionalism. Perfect for startups or businesses, it’s fully customizable and compatible with PowerPoint, Keynote, and Google Slides, ideal for impactful product-focused presentations.


5 slides
Country Highlight Asia Map Presentation
Showcase your regional insights with a clean and modern map that brings focus to key countries across Asia. Ideal for displaying market reach, growth metrics, or strategic locations, this visual layout makes data storytelling simple and effective. Fully compatible with PowerPoint, Keynote, and Google Slides for easy customization.


10 slides
Modern Geometric Shapes Presentation
The "Modern Geometric Shapes" presentation template uses a series of cascading, colorful shapes to organize and present data clearly and effectively. This layout is particularly suited for displaying hierarchical information or a series of processes that flow from one to the next, enhancing visual interest and readability. Each segment is distinctly colored to differentiate the sections while maintaining a cohesive design aesthetic, making it ideal for business presentations that require a blend of professionalism with modern graphic elements.


7 slides
Project Management Infographic Presentation Template
Project management is the process of leading a team of people to plan, organize, and complete a project within a specific timeframe and budget. It involves defining project goals, determining tasks and responsibilities, and tracking progress to ensure the project is completed on time and within budget. This template works with Powerpoint, keynote, and google slides, so you can use it on any device. Use this template for effective project management to ensure that resources are used efficiently, risks are minimized, and stakeholders are satisfied with the outcome of the project.