


Features
- 3 Unique slides
- Fully editable and easy to edit in Microsoft Powerpoint, Keynote and Google Slides
- 16:9 widescreen layout
- Clean and professional designs
- Export to JPG, PDF or send by email


Do you have any questions?
Recommend


6 slides
Fishbone Diagram
A fishbone diagram, also known as a cause-and-effect diagram or an Ishikawa diagram, is a visual tool used to identify and analyze the potential causes of a problem or an effect. This infographic template is designed to help you explore and understand the root causes of an issue by visually mapping out various contributing factors. This cause-and-effect diagram, provides a structured approach to identify and categorize the various factors contributing to a specific outcome. This template is fully customizable and compatible with Powerpoint, Keynote, and Google Slides making it easy to input your information.


4 slides
Left and Right Brain Diagram Presentation
Unlock the perfect blend of logic and creativity with a visual layout that highlights how analytical thinking and imaginative ideas work together. This presentation makes it easy to compare concepts, explain processes, and illustrate dual perspectives with clarity and color. Fully compatible with PowerPoint, Keynote, and Google Slides.


5 slides
Technology Innovation Infographics
Technology innovation refers to the process of creating and introducing new or improved technologies that have the potential to bring about significant advancements in various industries and sectors. These vertical infographics explores the world of technology innovation and its impact on various industries. These templates are designed to showcase the latest advancements, emerging trends, and transformative technologies that are shaping our digital landscape. These enable you to showcase the transformative power of technology and inspire your audience to embrace the opportunities it presents.


4 slides
Internal Meeting Agenda and Notes Presentation
Stay organized and aligned with the Internal Meeting Agenda and Notes presentation template. Designed for clarity and productivity, this layout includes dedicated sections for meeting topics, notes, action items (to-do list), brainstorming, and extra comments. Ideal for team check-ins, project syncs, and internal reviews. Fully editable and compatible with PowerPoint, Keynote, and Google Slides.


22 slides
Zephyr Product Launch Pitch Deck Presentation
Step into the spotlight with this modern and captivating product launch pitch deck! Designed to showcase your ideas with clarity, it covers every key aspect from market opportunities to financials. Impress investors with strategic insights and sleek visuals that guide them through your business plan. Perfect for PowerPoint, Keynote, and Google Slides!


21 slides
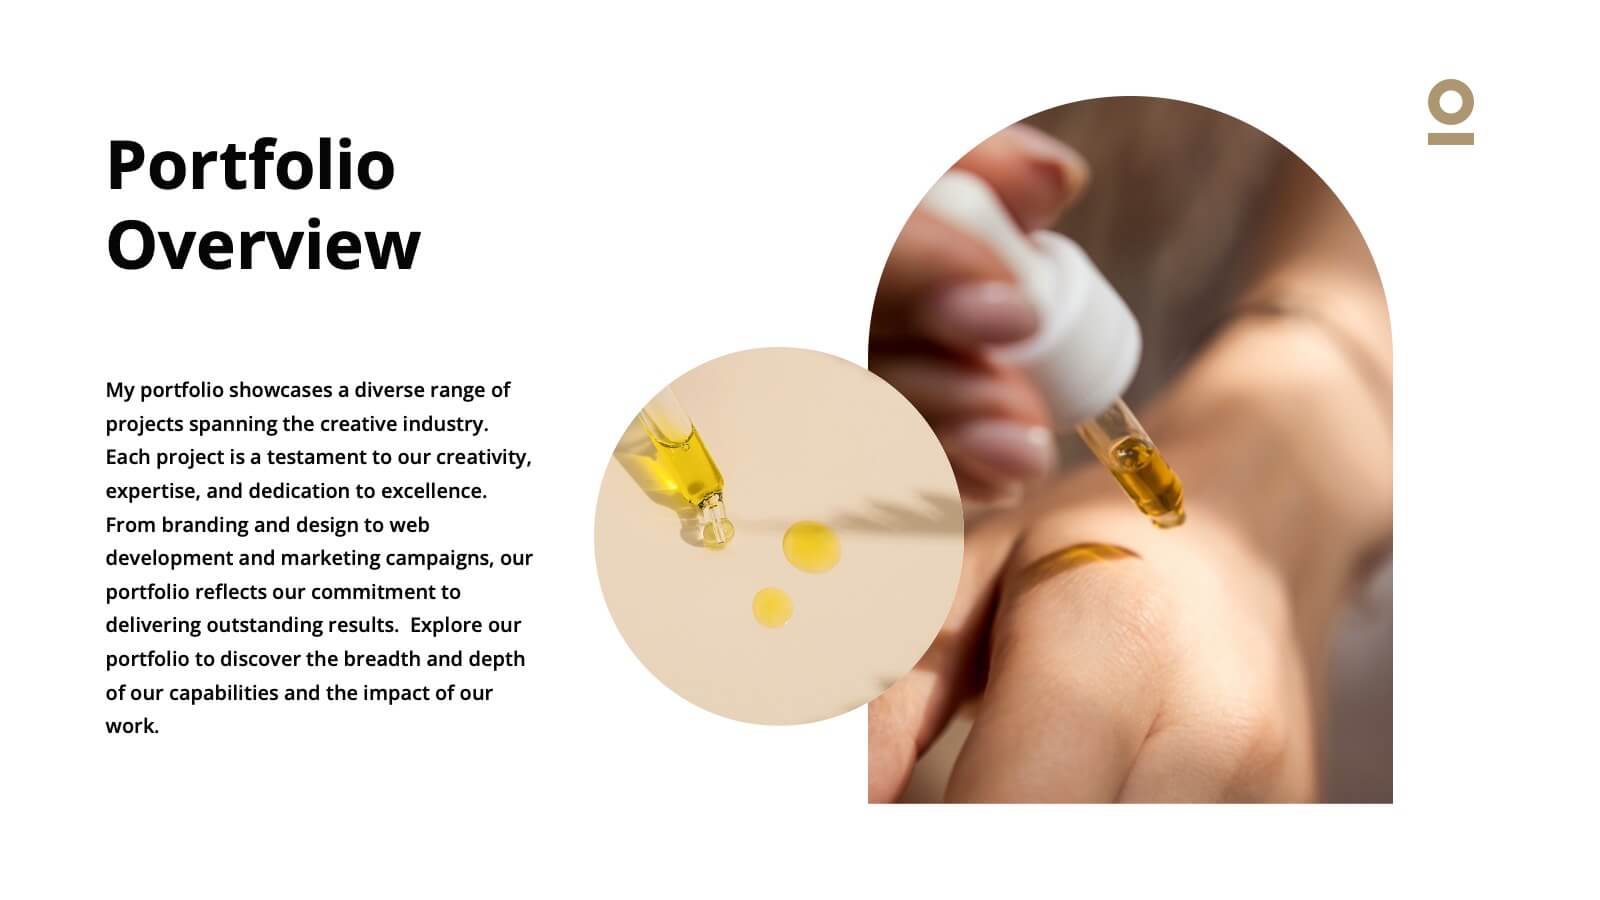
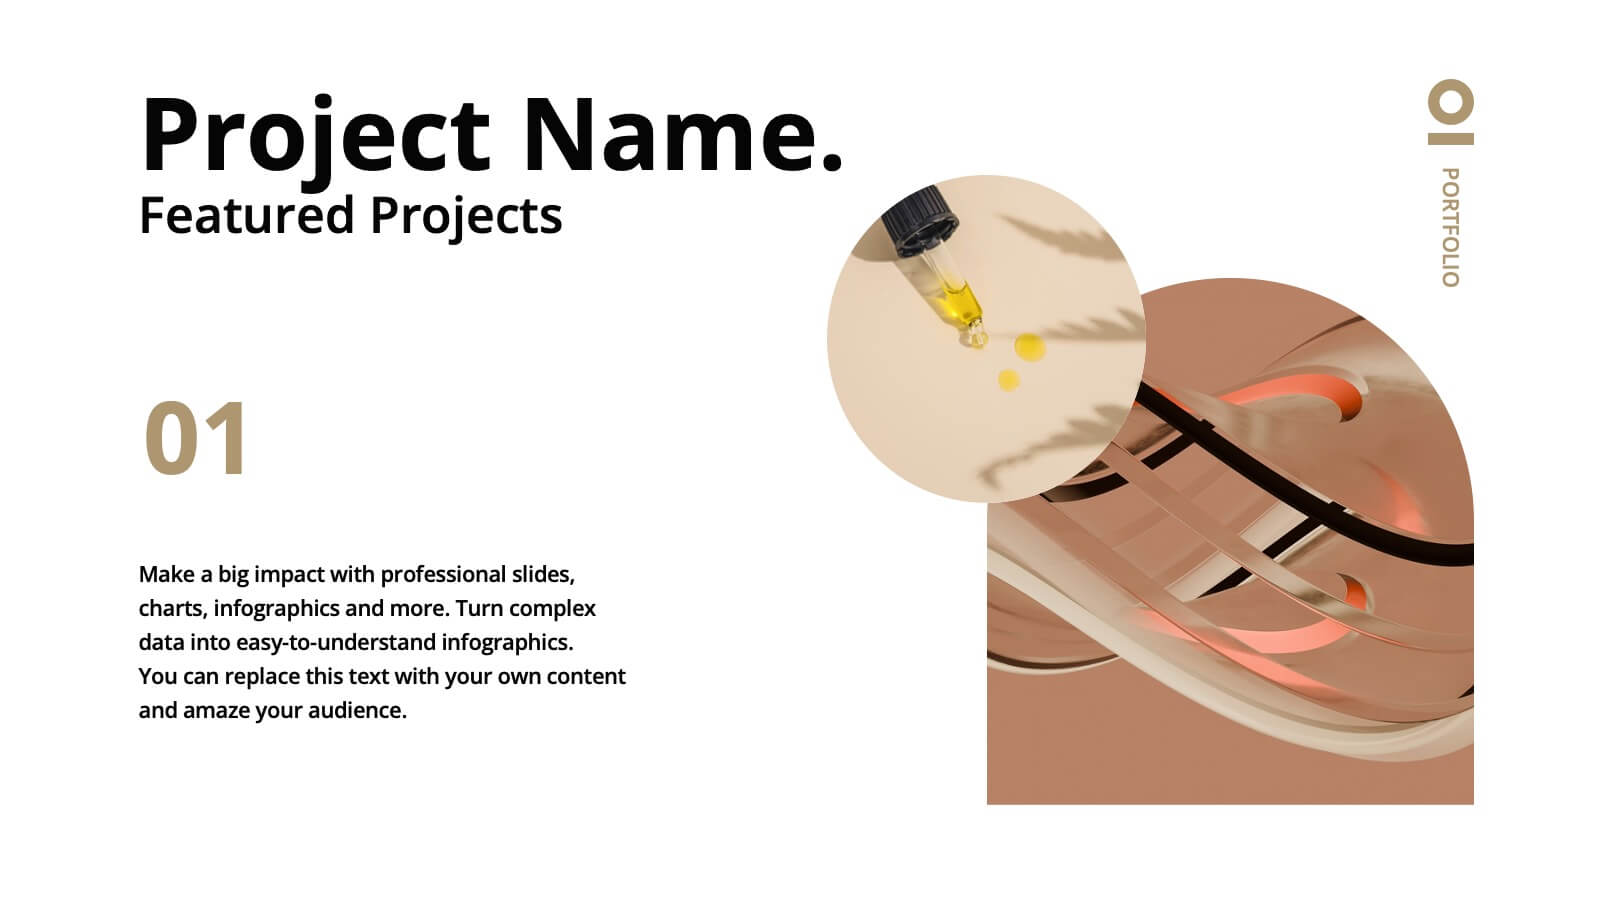
Haze Professional Portfolio Showcase Presentation
Elevate your professional presence with this stunning haze-inspired presentation template! Ideal for showcasing your portfolio, it beautifully highlights your skills, projects, and achievements with a clean and sophisticated design. This template ensures your work stands out, captivating potential clients and employers. Compatible with PowerPoint, Keynote, and Google Slides.


7 slides
Risk Management Processes Infographic
A Risk Management infographic is a visual representation of the process of identifying, assessing, and mitigating risks in a particular context or organization. This template can be used to convey important information about potential risks and how they can be managed to minimize negative consequences and maximize positive outcomes. You can use this infographic for various purposes, such as to inform stakeholders, to guide decision-making, or to promote risk awareness and best practices. Compatible with Powerpoint, Keynote and Google Slides, this can be designed in different styles and formats.


4 slides
Executive Summary Business Presentation
Summarize key business insights effectively with this executive summary template! Designed to present an overview of your strategy, problem statement, solutions, and conclusions in a structured format, this layout ensures clarity and impact. Ideal for reports, proposals, and business plans. Fully customizable and compatible with PowerPoint, Keynote, and Google Slides.


6 slides
Business Value Chain Strategy Presentation
Optimize Business Processes with a Seamless Flow using this Business Value Chain Strategy presentation template. Designed to visualize key activities in a structured, interconnected format, this template helps highlight value-adding processes, strategic improvements, and operational efficiencies. Featuring a chain-linked design, dynamic colors, and customizable text placeholders, this template is perfect for business strategists, process analysts, and executive teams. Fully editable and compatible with PowerPoint, Keynote, and Google Slides, making it an essential tool for clear, impactful presentations.


5 slides
Circular Process Cycle Presentation
Visualize continuous workflows or recurring processes with this Circular Process Cycle slide. Featuring five distinct steps arranged around a central loop, each stage is clearly labeled with icons and color-coded titles for seamless comprehension. Perfect for project management, product development, or strategic planning cycles. Fully customizable and compatible with PowerPoint, Keynote, and Google Slides.

26 slides
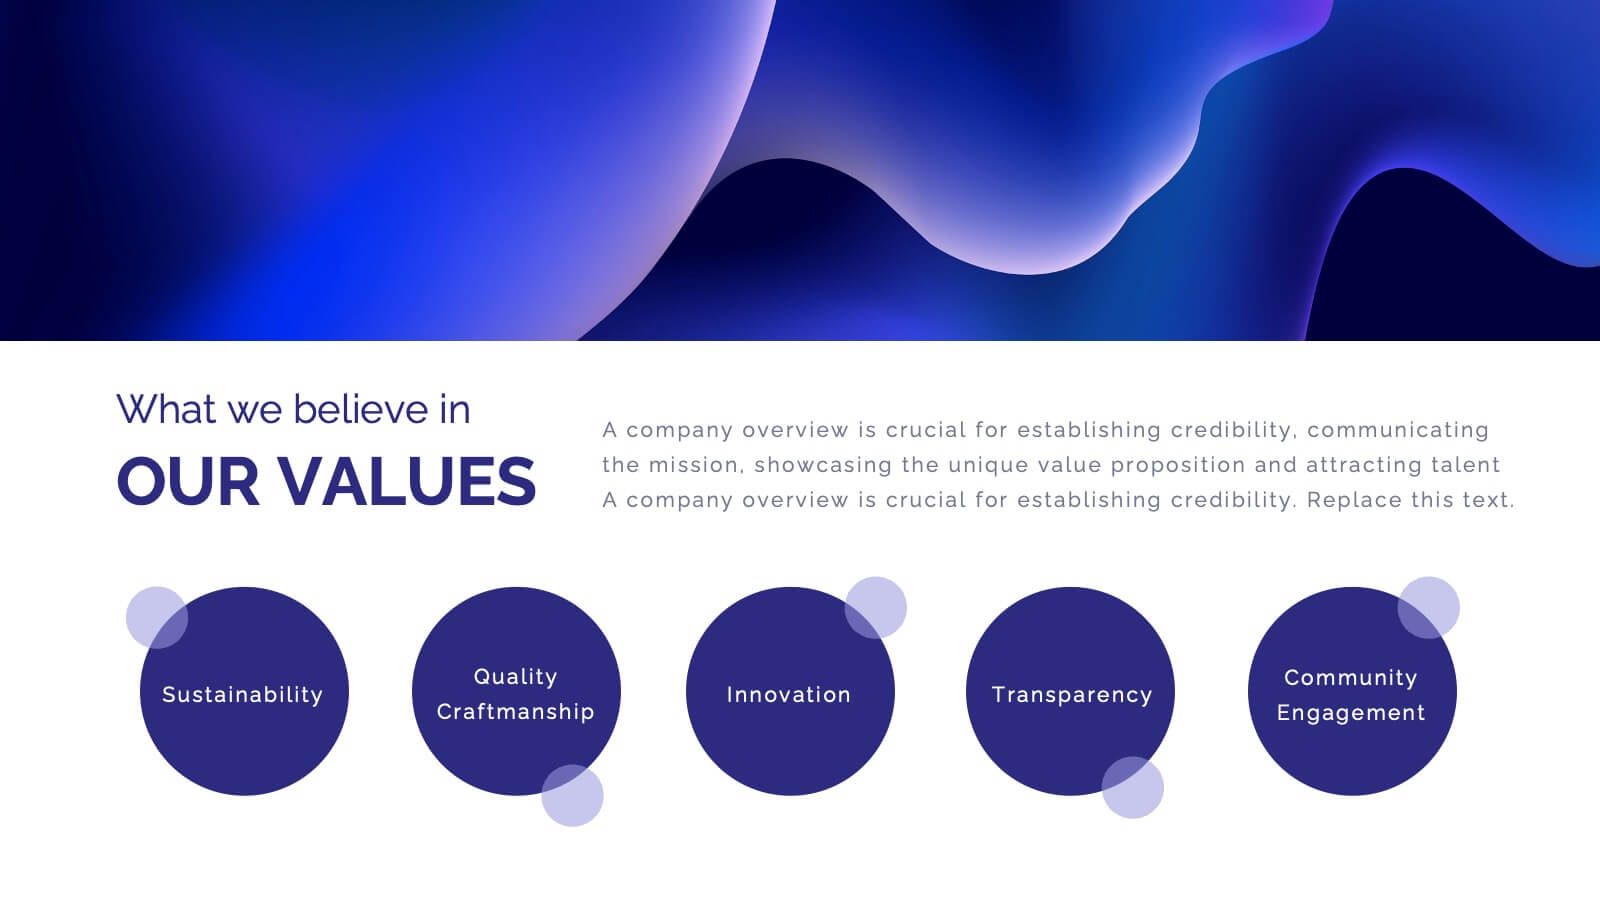
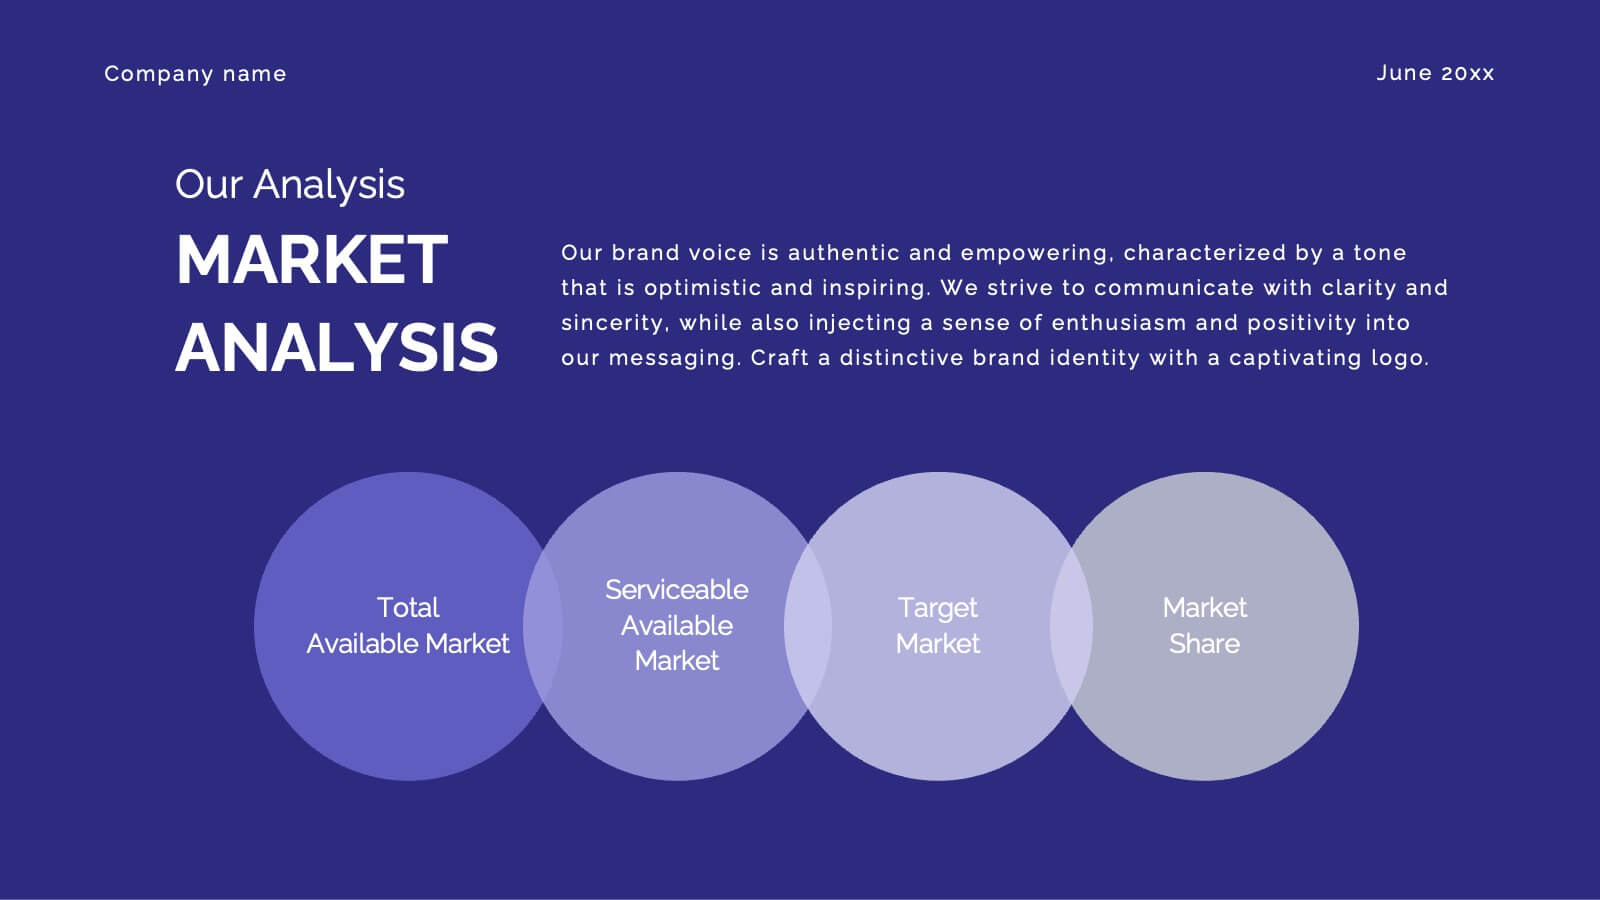
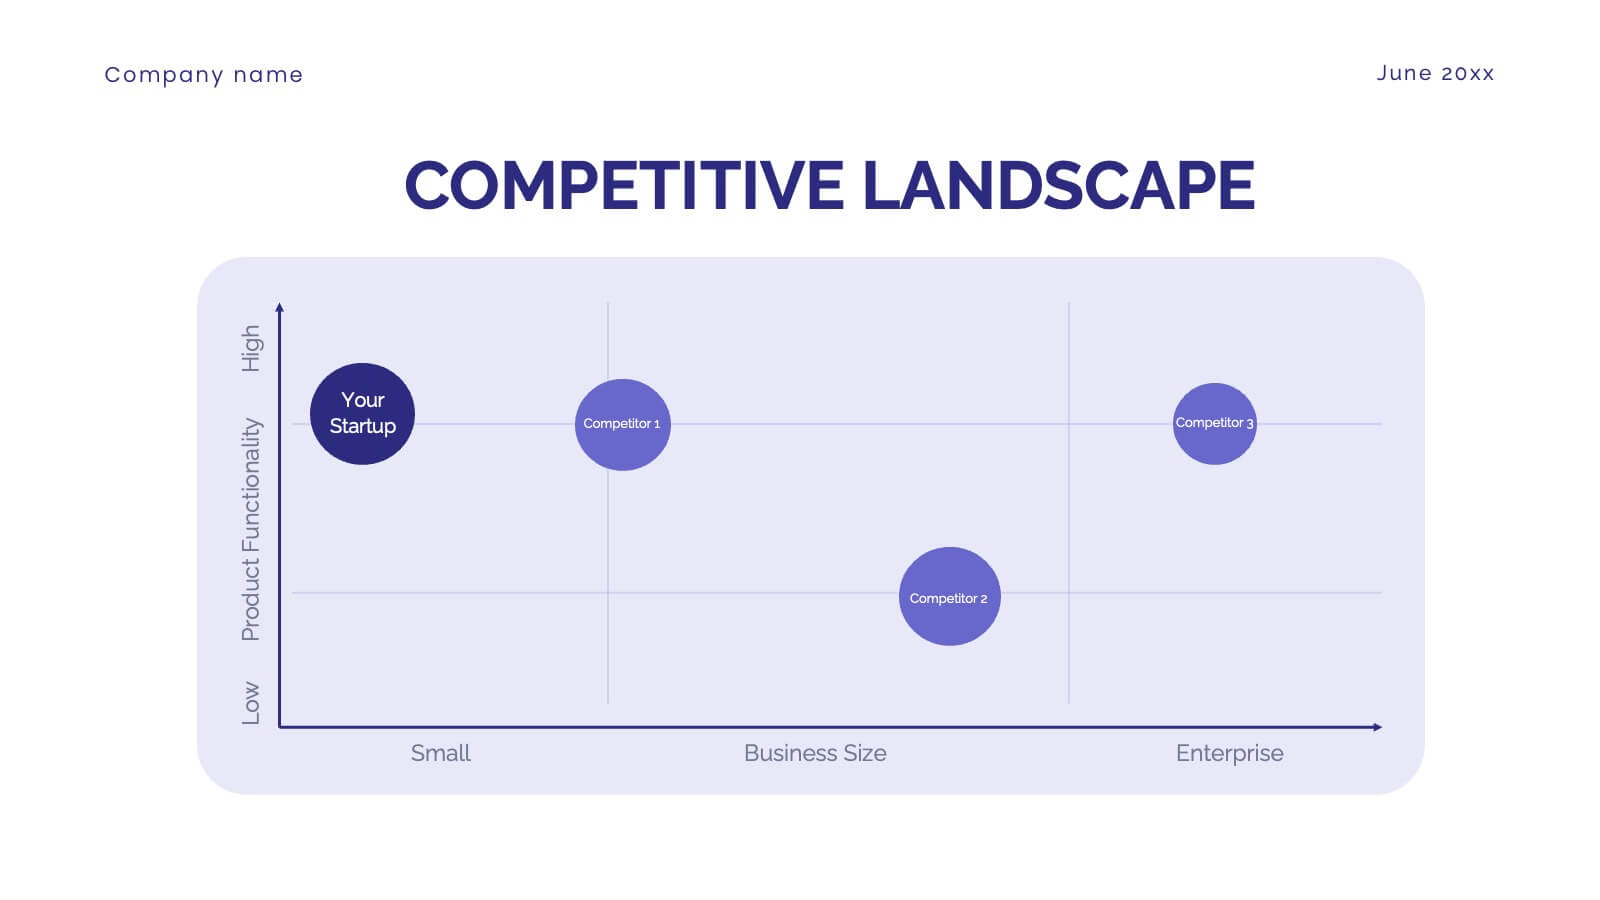
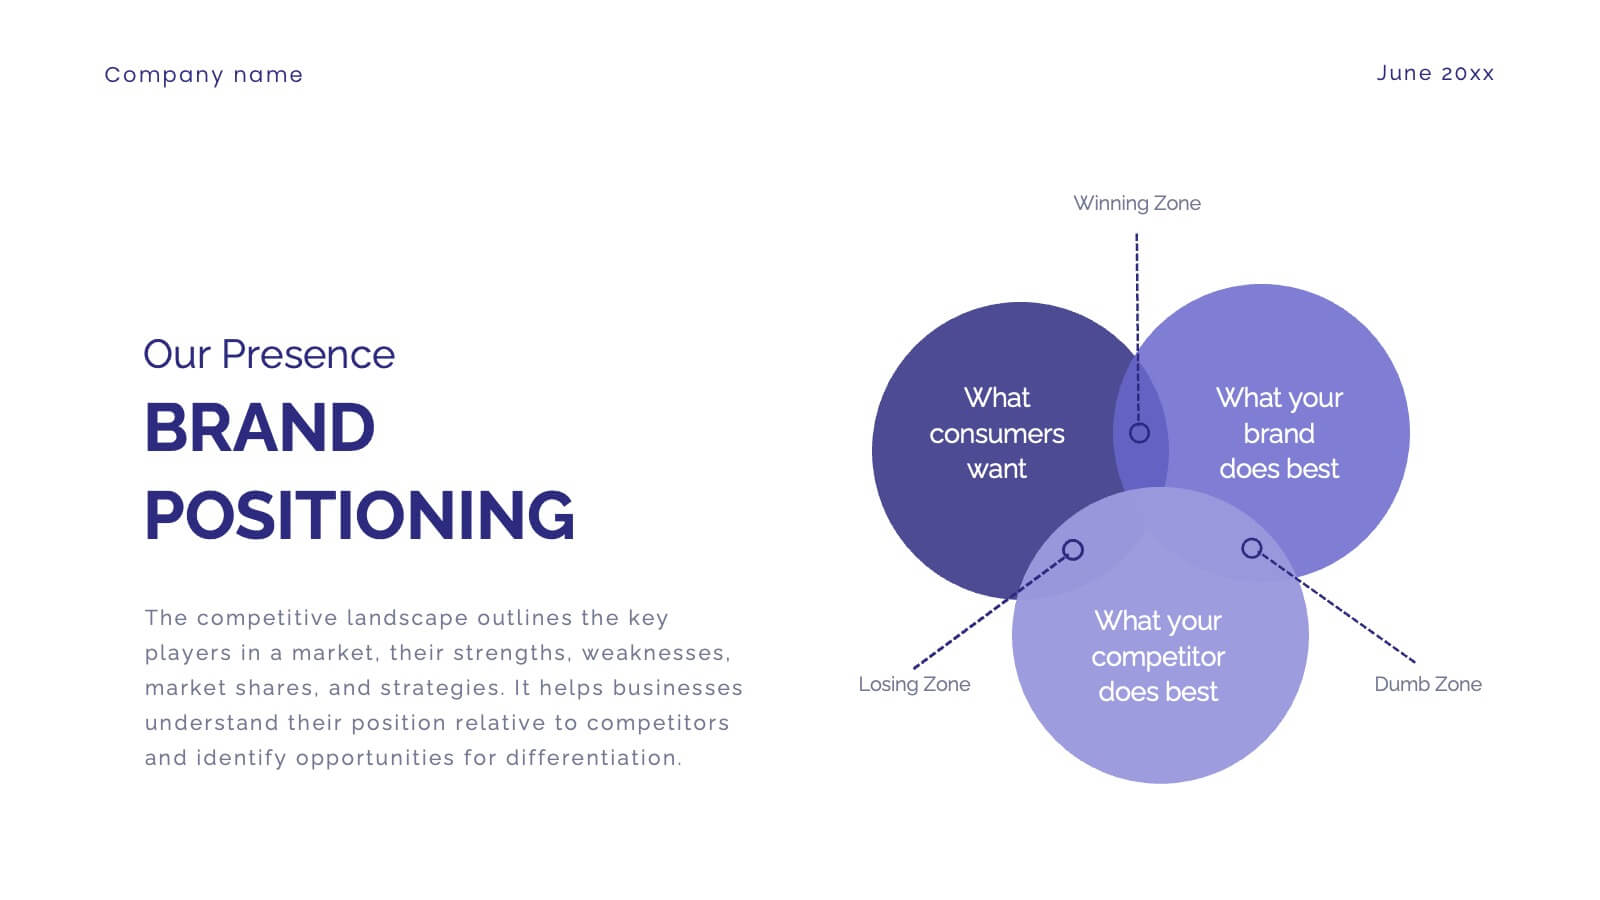
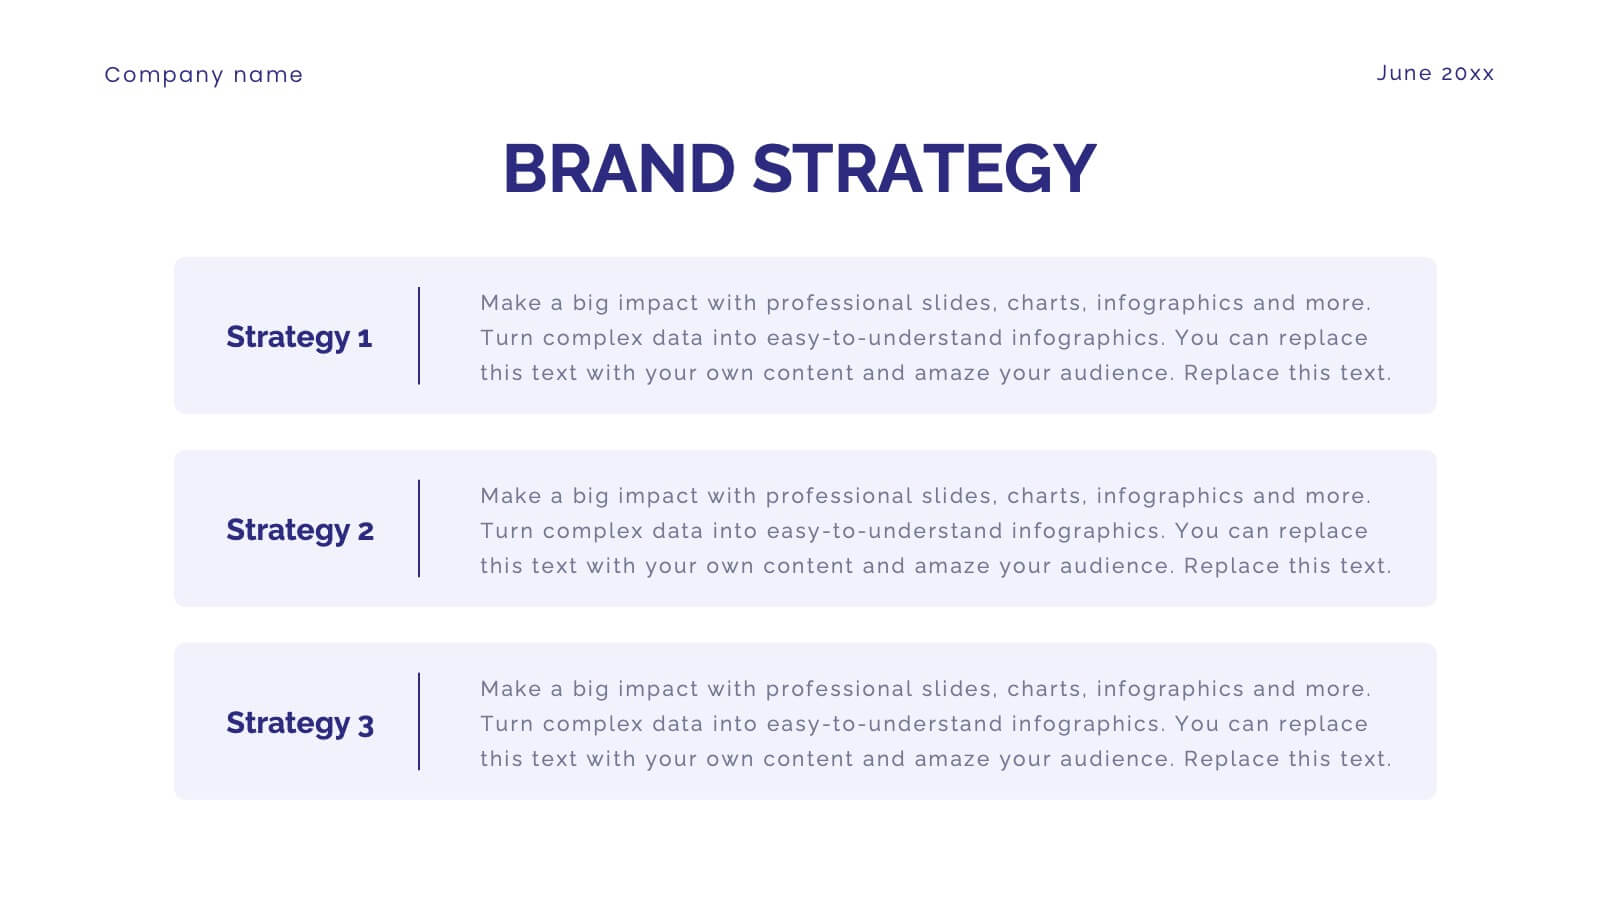
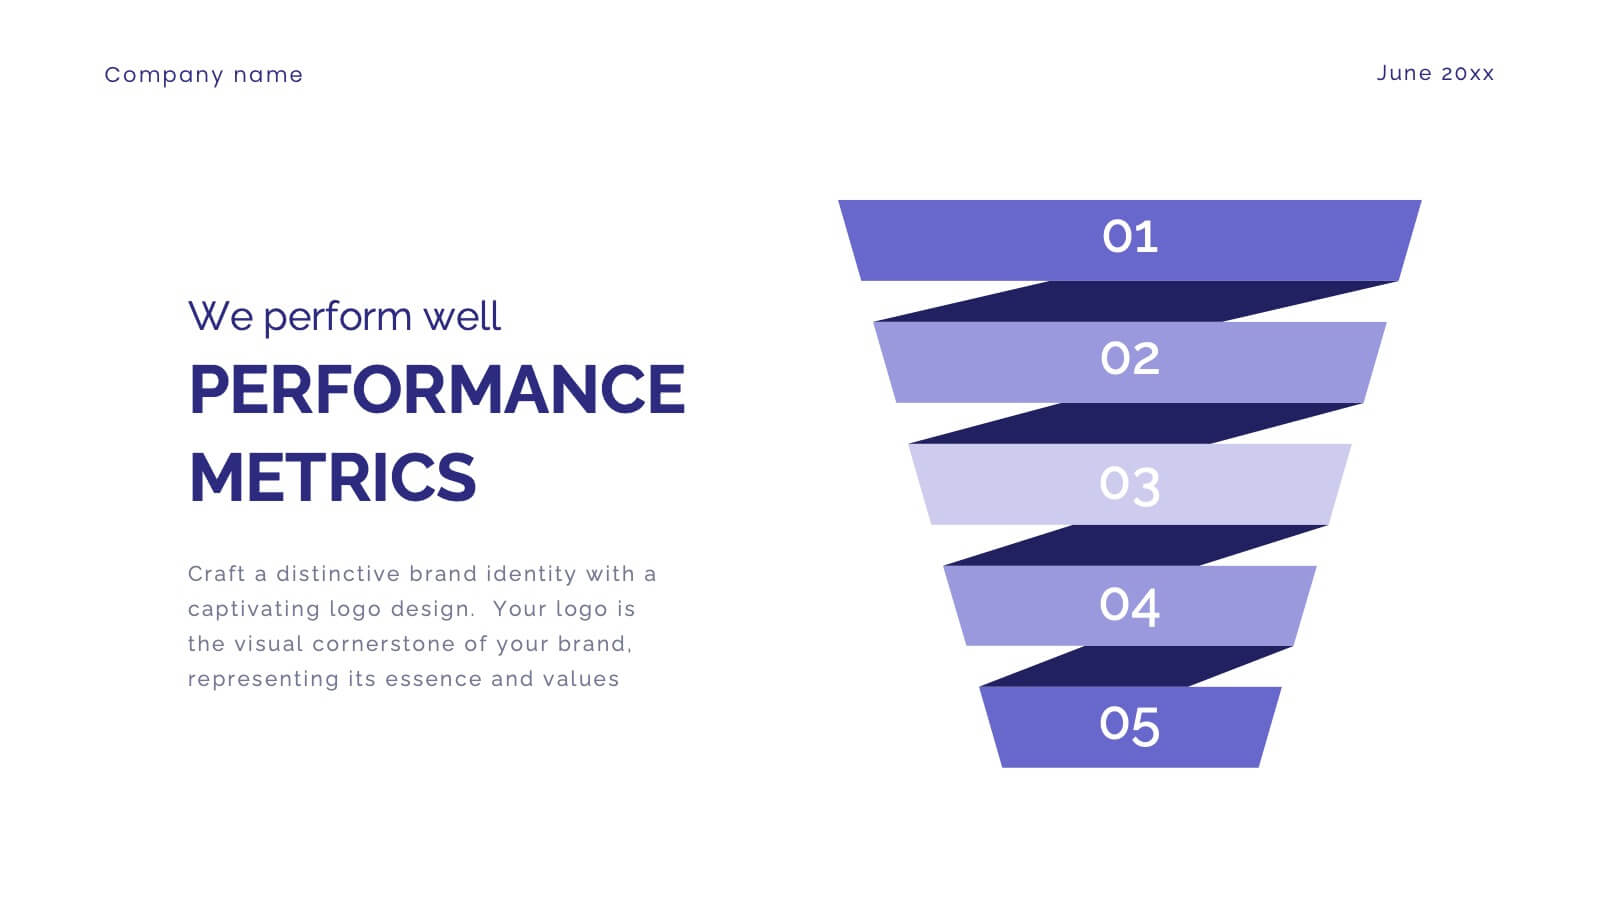
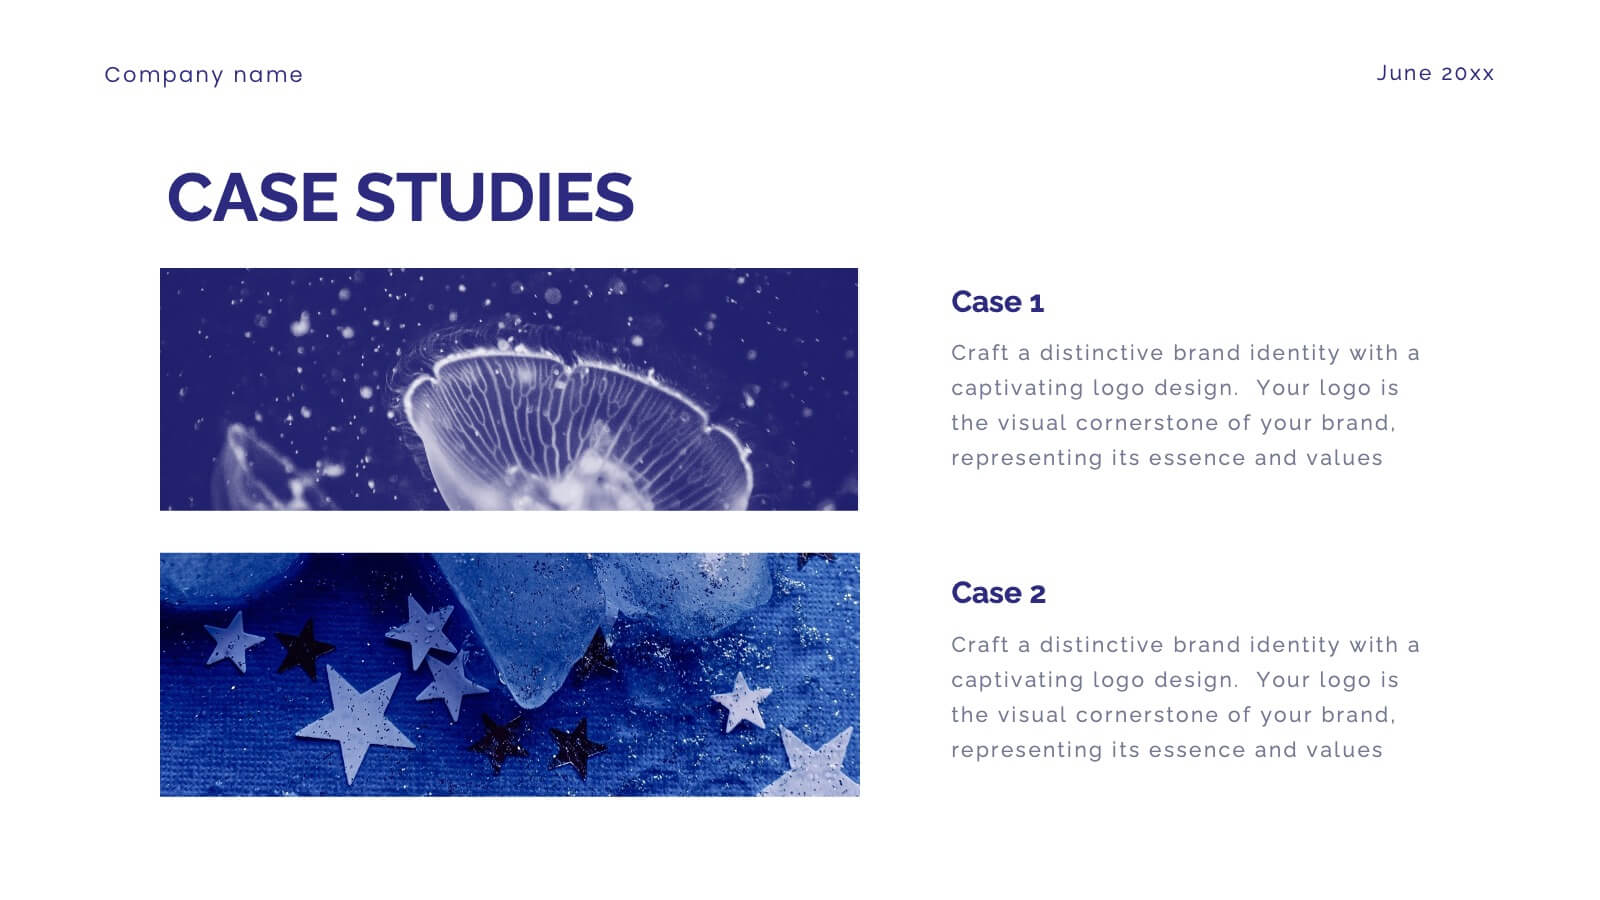
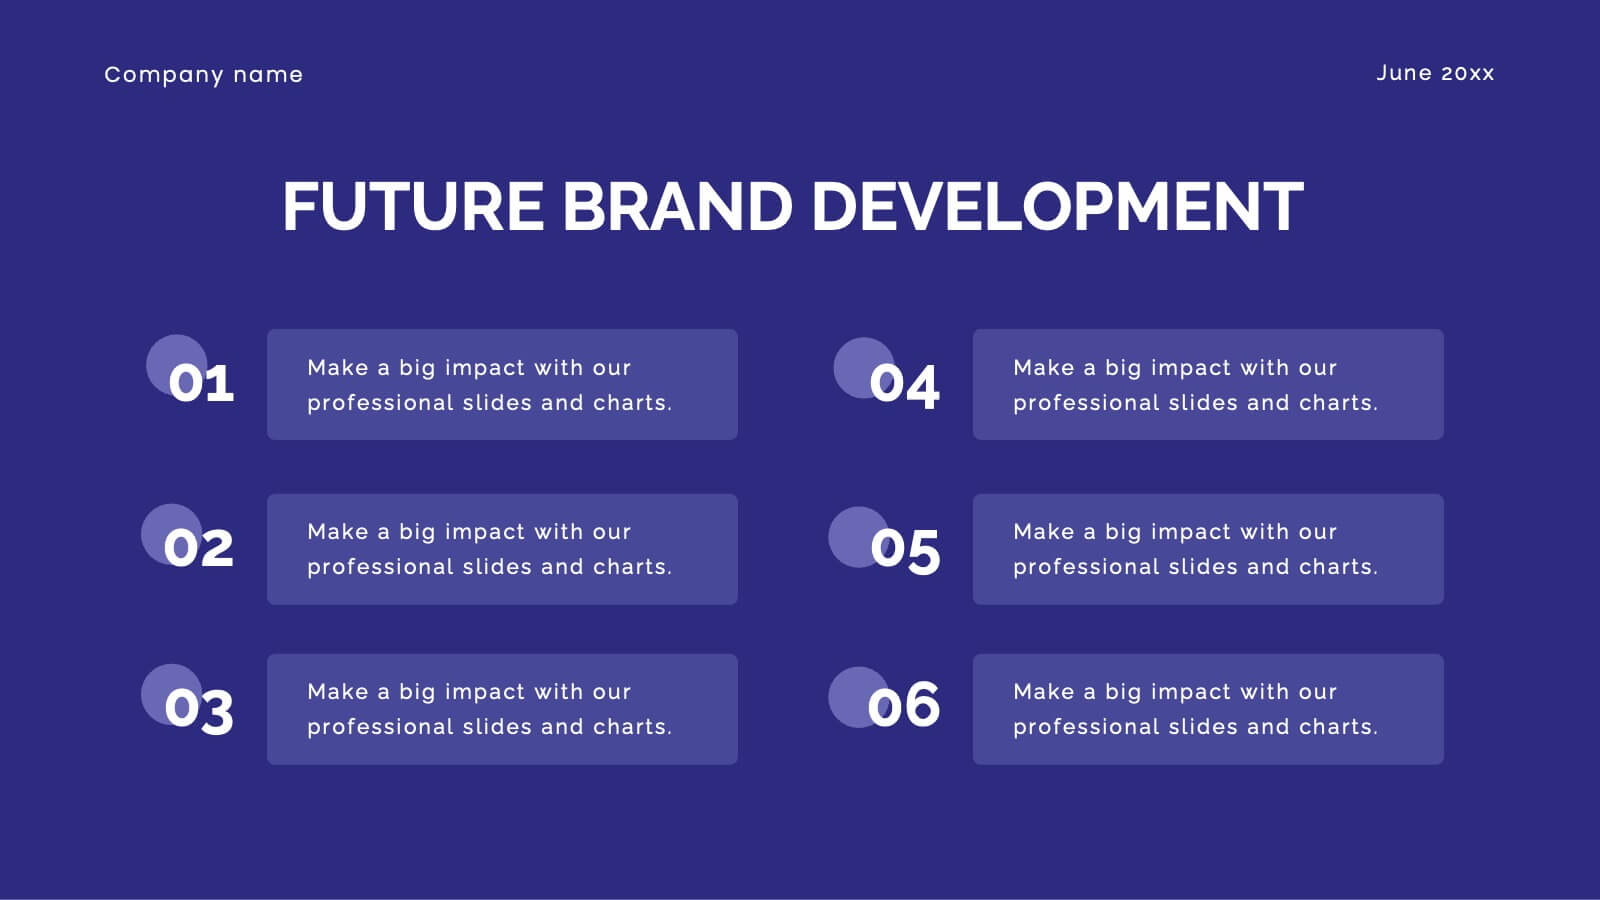
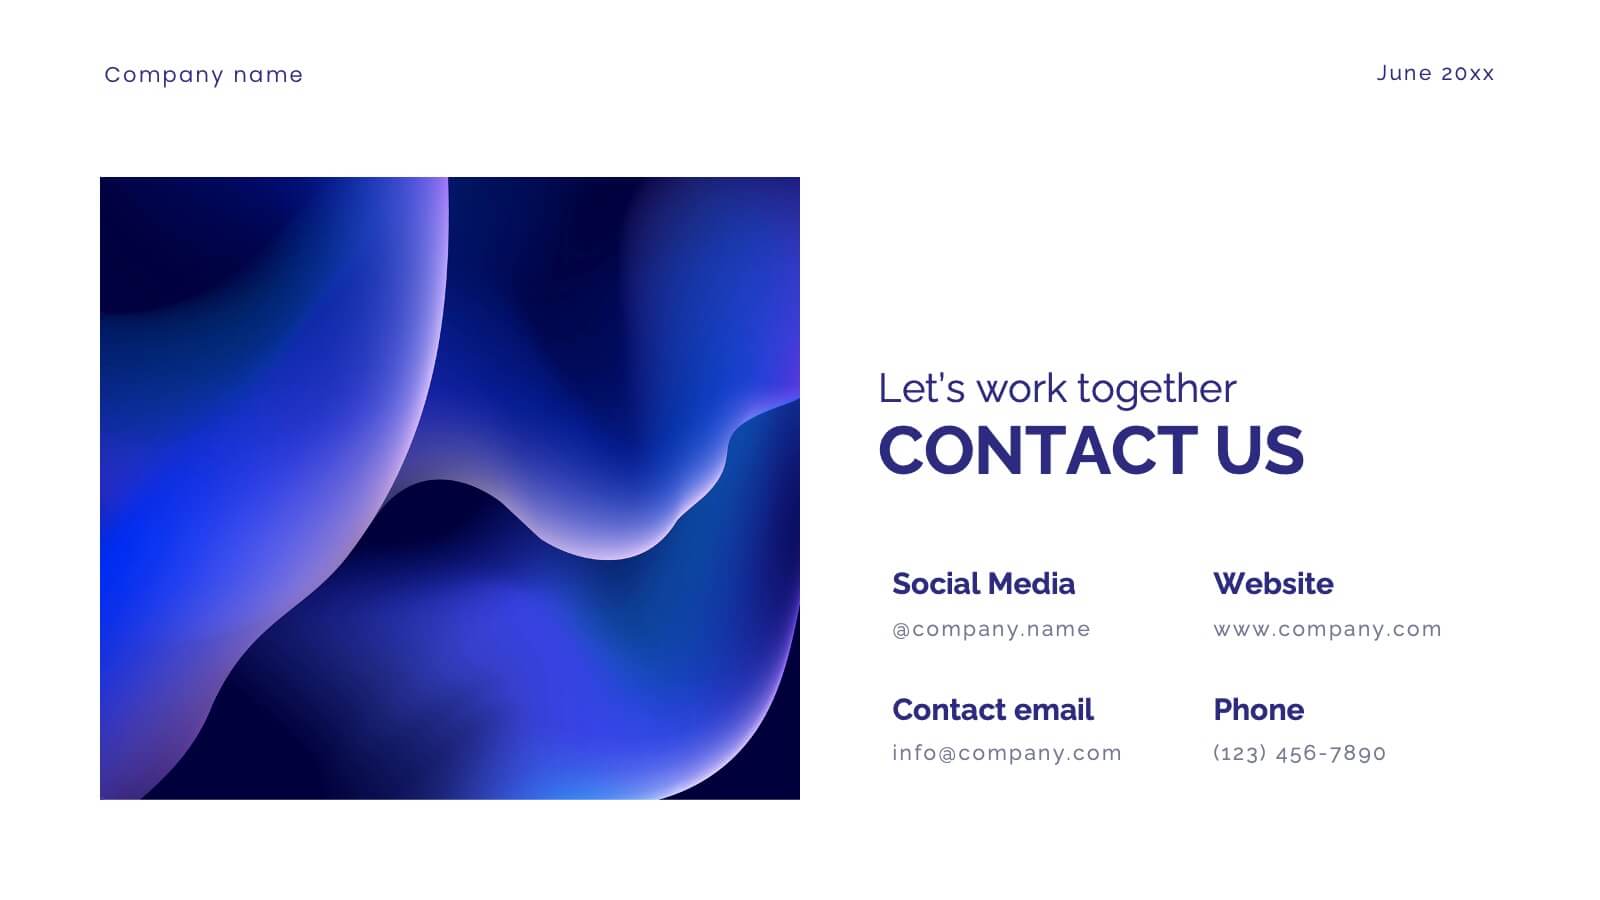
Glimmer Brand Development Pitch Deck Presentation
Elevate your brand with this comprehensive rebranding presentation template! Perfect for detailing your logo, color scheme, and market analysis, it includes slides for brand positioning, competitive landscape, and performance metrics. Engage your audience with clear visuals and structured content. Compatible with PowerPoint, Keynote, and Google Slides for seamless presentations on any platform.


23 slides
Pomona Business Plan Presentation
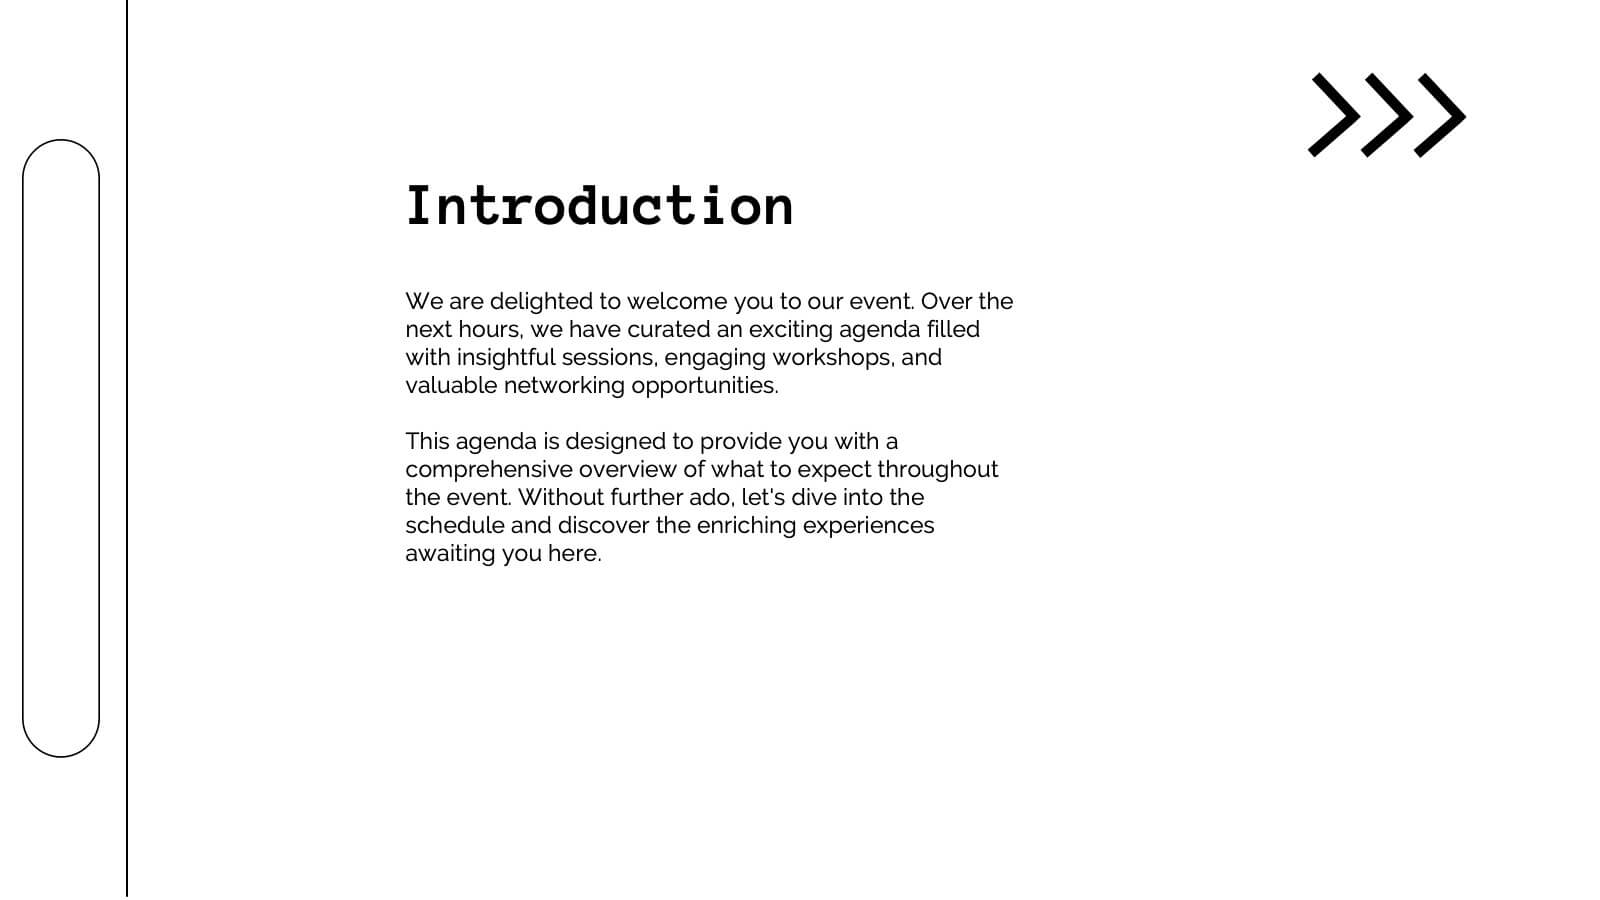
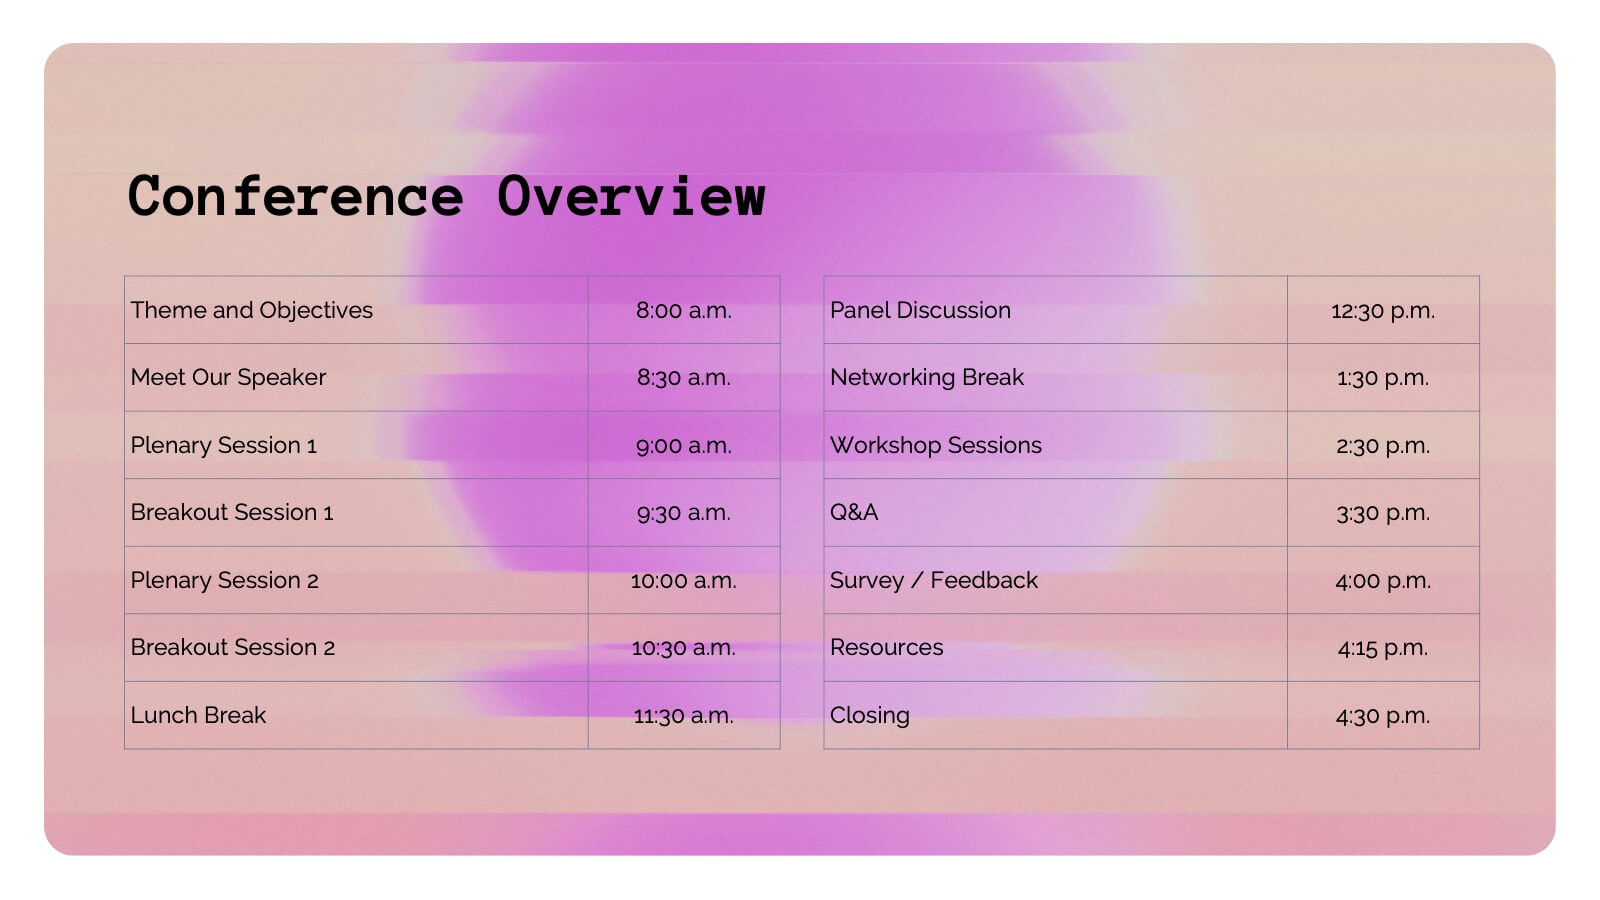
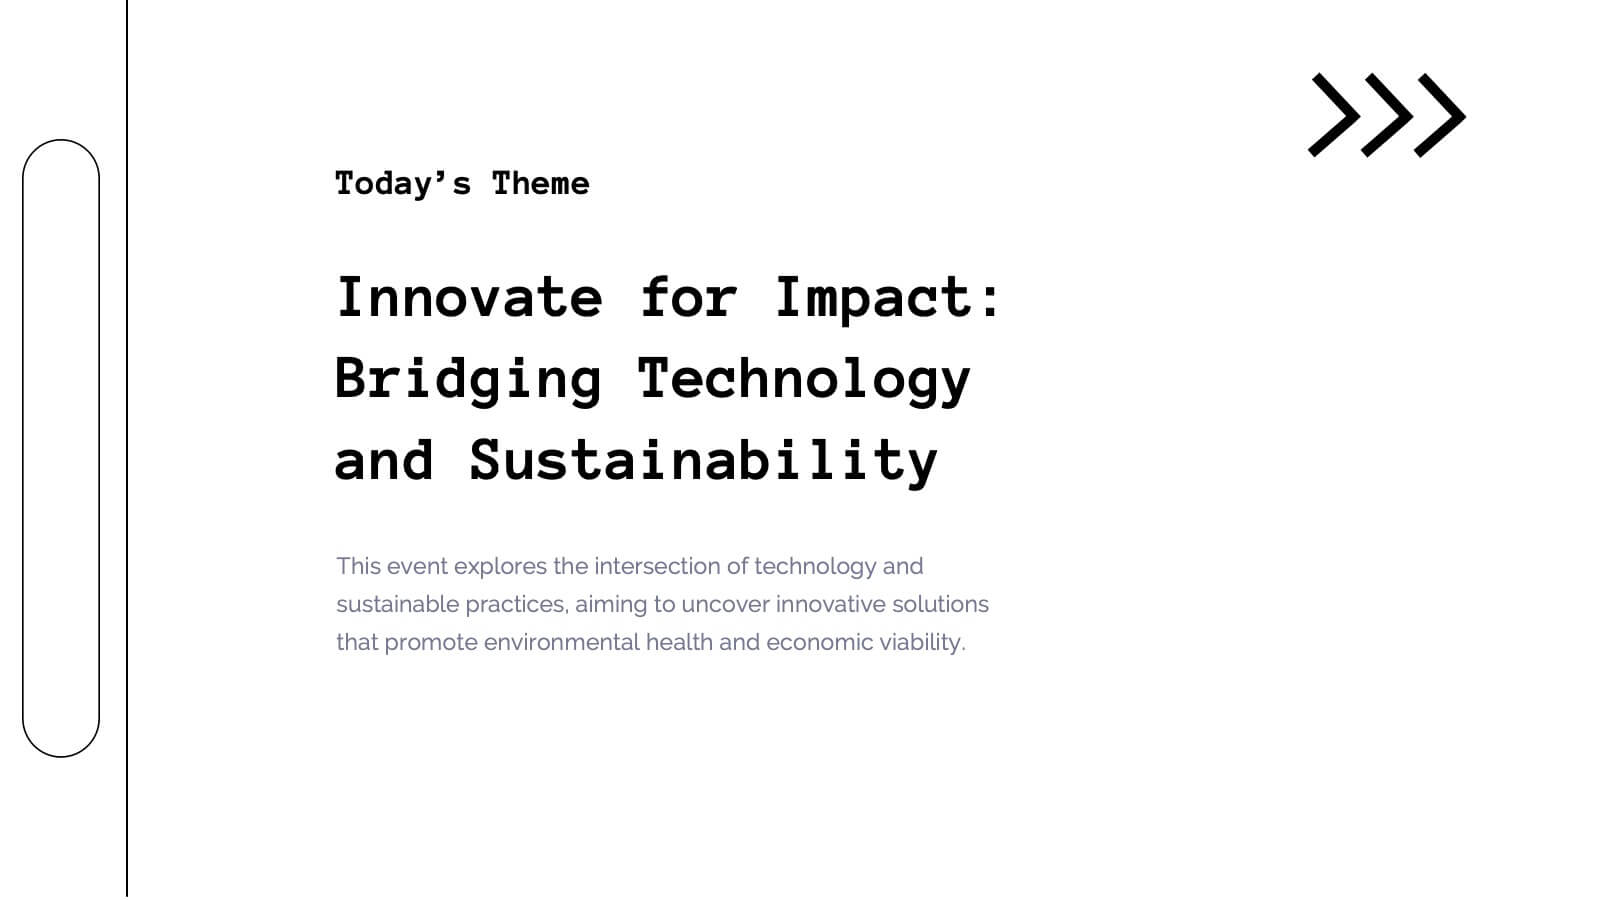
This vibrant and adaptable event agenda template is perfect for organizing your business conference or corporate event. It includes customizable sections for session details, speaker information, and key activities like networking breaks, workshops, and panel discussions. Compatible with PowerPoint, Keynote, and Google Slides, it ensures a smooth and engaging event presentation experience!


23 slides
Orbit Marketing Strategy Plan Presentation
Elevate your marketing strategy presentations with this vibrant and dynamic template! Perfect for analyzing market trends, identifying target audiences, and outlining strategic objectives. Ideal for marketing professionals aiming to captivate their audience and drive results. Compatible with PowerPoint, Keynote, and Google Slides, this template ensures your strategy is clear, compelling, and effective.


5 slides
Mental Health Awareness Infographics
Mental Health Awareness is the recognition and understanding of the importance of mental well-being, as well as the recognition of mental health issues and the impact they have on individuals and society as a whole. These infographic templates are valuable tools designed to raise awareness, reduce stigma, and promote mental well-being. With its informative content, compelling visuals, it serves as an effective resource for presentations, educational campaigns, or any event focused on mental health awareness. It provides essential information, statistics, and tips to support mental well-being. This template is compatible with PowerPoint, Keynote, and Google Slides.


22 slides
Calcifis Qualitative Research Findings Presentation
Present your research insights with clarity and impact using this modern and engaging presentation template. Cover key areas such as research objectives, methodology, data analysis, key findings, limitations, and recommendations. The visually appealing design helps you communicate complex qualitative data effectively, making it ideal for academic, business, and market research presentations. Fully customizable and compatible with PowerPoint, Keynote, and Google Slides.


7 slides
Online Meeting Infographic
Online meetings, also known as virtual meetings or web meetings, are gatherings or discussions that take place over the internet, enabling participants to communicate, collaborate, and interact with each other remotely. This infographic template is a great way to streamline the process and enhance the efficiency of virtual meetings. This template aims to provide a comprehensive guide to conducting effective online meetings. Compatible with Powerpoint, Keynote, and Google Slides. Customize the content and design to suit your specific needs and ensure your online meetings are efficient, engaging, and productive.


5 slides
Country Highlight Asia Map Presentation
Showcase your regional insights with a clean and modern map that brings focus to key countries across Asia. Ideal for displaying market reach, growth metrics, or strategic locations, this visual layout makes data storytelling simple and effective. Fully compatible with PowerPoint, Keynote, and Google Slides for easy customization.