


Features
- 5 Unique slides
- Fully editable and easy to edit in Microsoft Powerpoint, Keynote and Google Slides
- 16:9 widescreen layout
- Clean and professional designs
- Export to JPG, PDF or send by email


Do you have any questions?
Recommend


4 slides
Social and Professional Networking
Visualize global connections and collaborative ecosystems with this Social and Professional Networking presentation. Ideal for HR teams, marketers, or networking strategists, it showcases relationship-building and engagement across key hubs. Fully customizable in PowerPoint, Keynote, and Google Slides for maximum flexibility in any professional setting.


5 slides
Financial Budget Infographics
Financial goals refer to specific objectives and targets that individuals or businesses set to manage their finances effectively and achieve financial success. These vertical infographics are designed to help individuals and businesses effectively present their financial budgets and plans. Whether you're a financial analyst or a business owner, this template is perfect for conveying complex financial information in a clear and concise manner. These infographics provide an overview of the budget, showcasing key financial goals, total income, and total expenses. This features visuals to help users set and track financial goals.


6 slides
Cash Management Strategy Presentation
Break down your financial priorities with a bold, visual approach. This cash management slide uses a segmented dollar symbol to represent key areas like budgeting, reserves, expenses, and more—making it easy to track strategy points at a glance. Ideal for finance teams, planning sessions, or investor decks. Compatible with PowerPoint, Keynote, and Google Slides.


7 slides
Customer Empathy Map Infographic Presentation
An Empathy Map infographic is a visual tool used to help understand the needs, wants, and behaviors of a particular customer. This template is a perfect way to gather and organize information about a person's experience and perspective, in order to better understand their motivations and desires. This empathy map infographic consists of a diagram that is divided into four quadrants: what the user thinks and feels, what they hear, what they see, and what they do. In each quadrant, information is gathered about the user's thoughts, feelings, and actions related to a particular product or service.


23 slides
Halo Digital Strategy Presentation
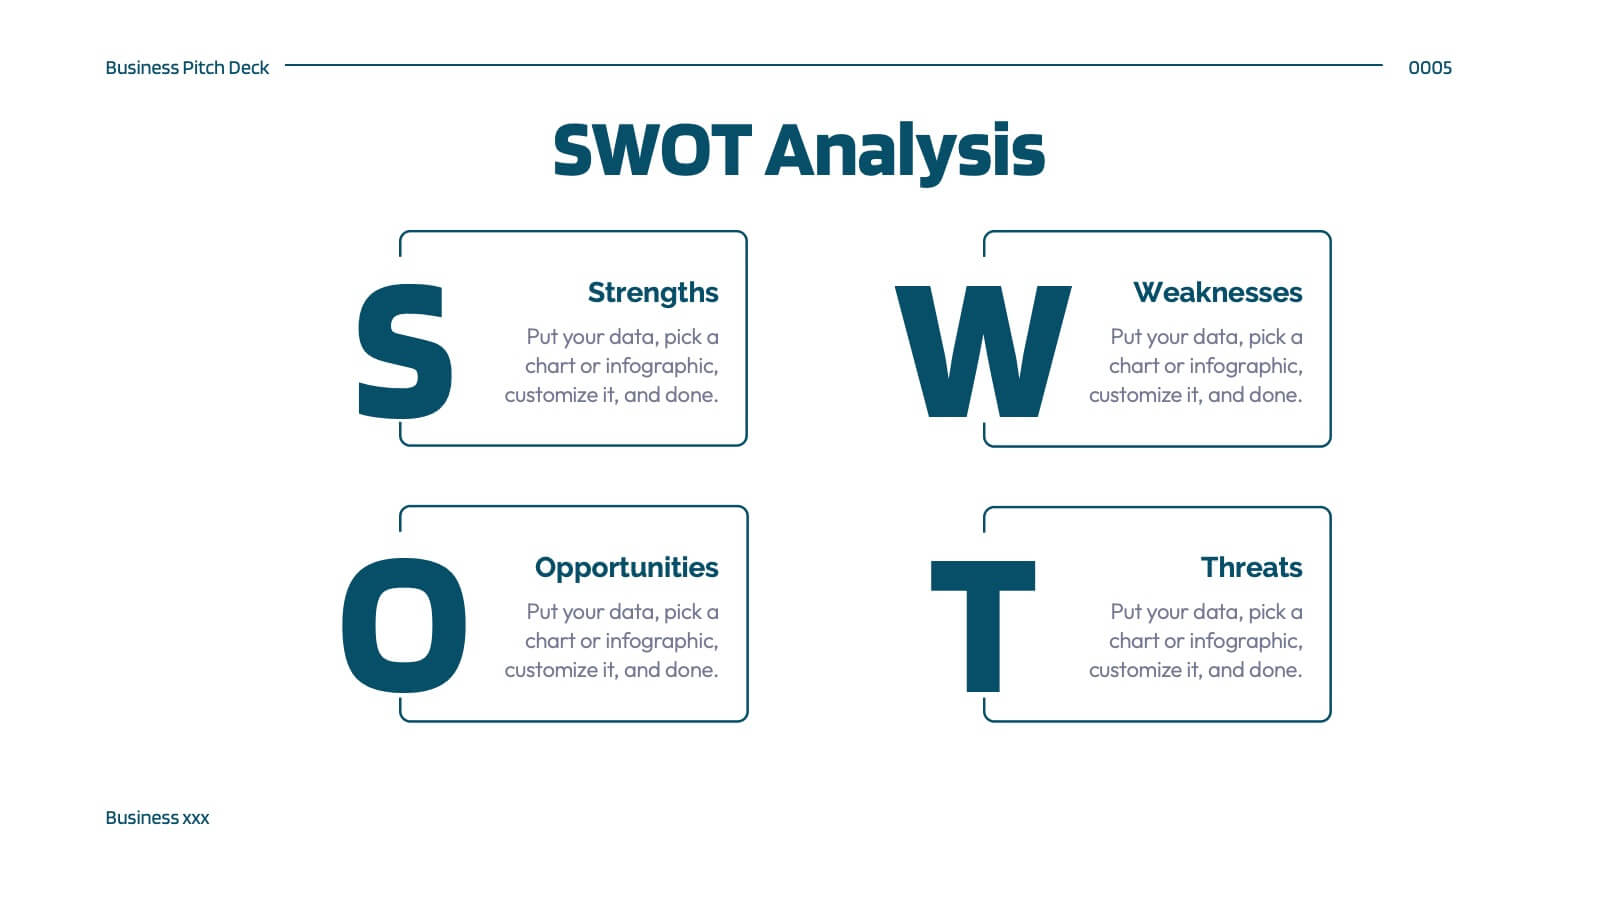
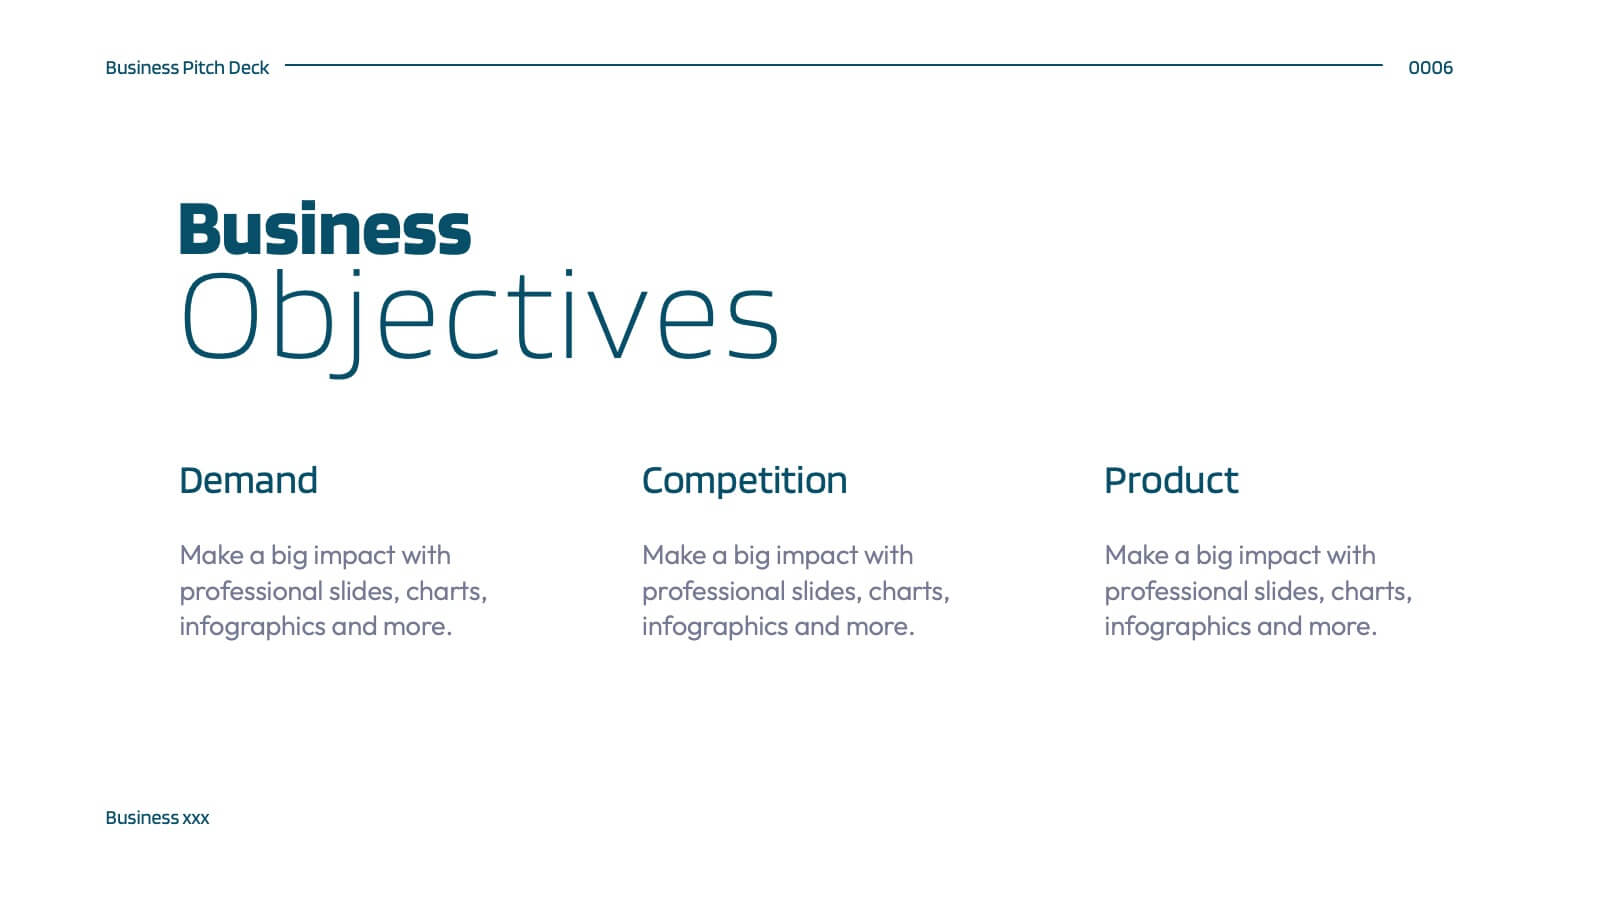
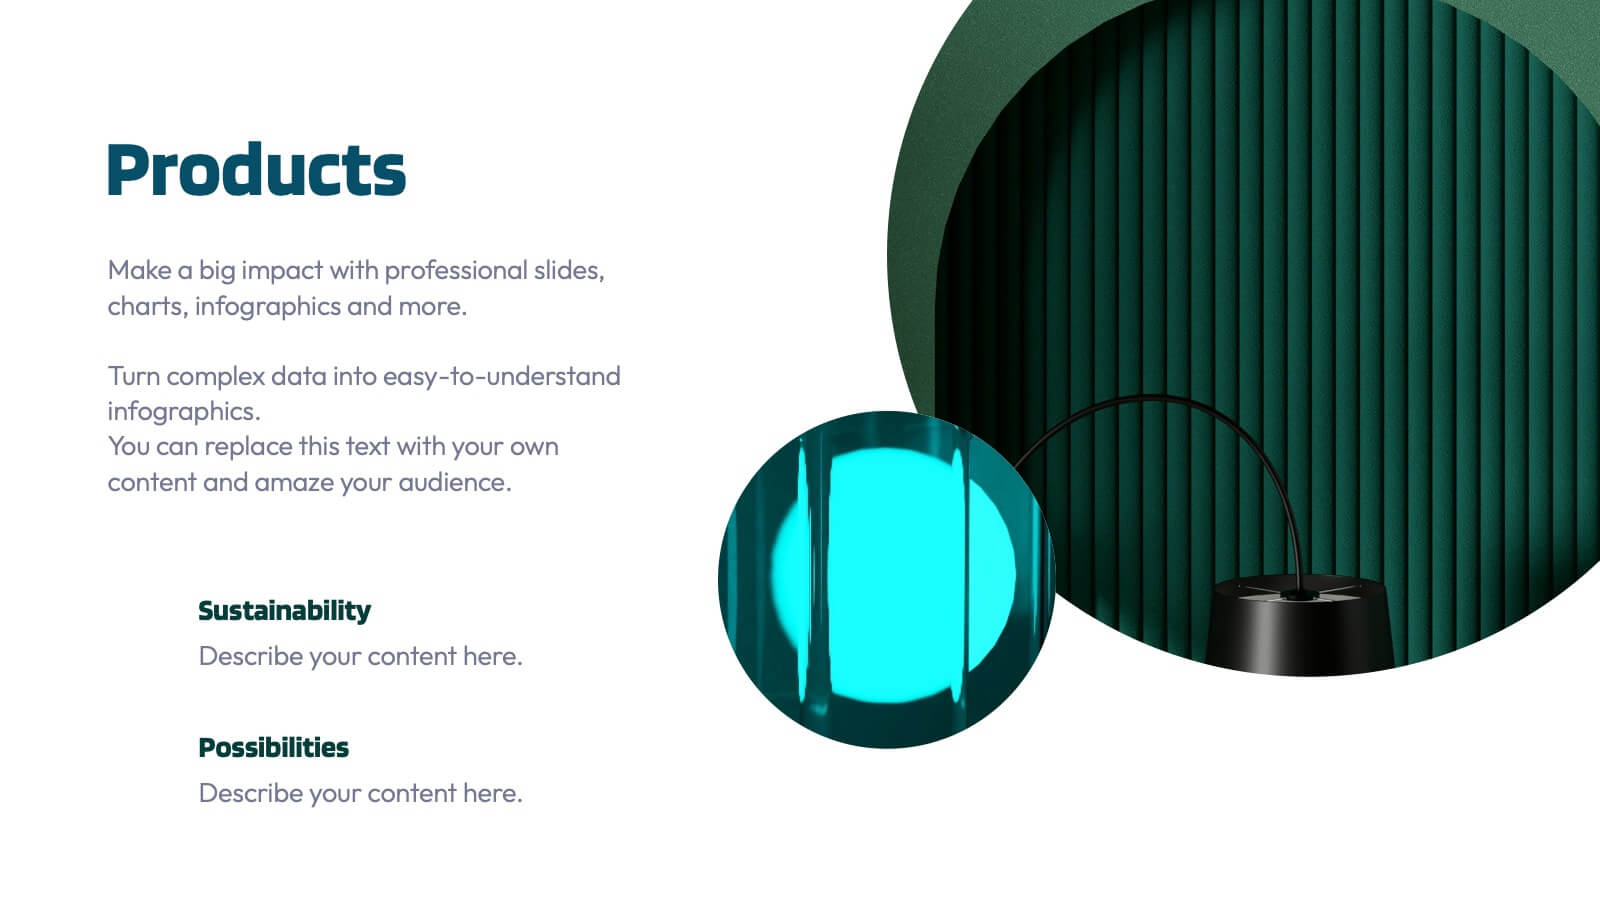
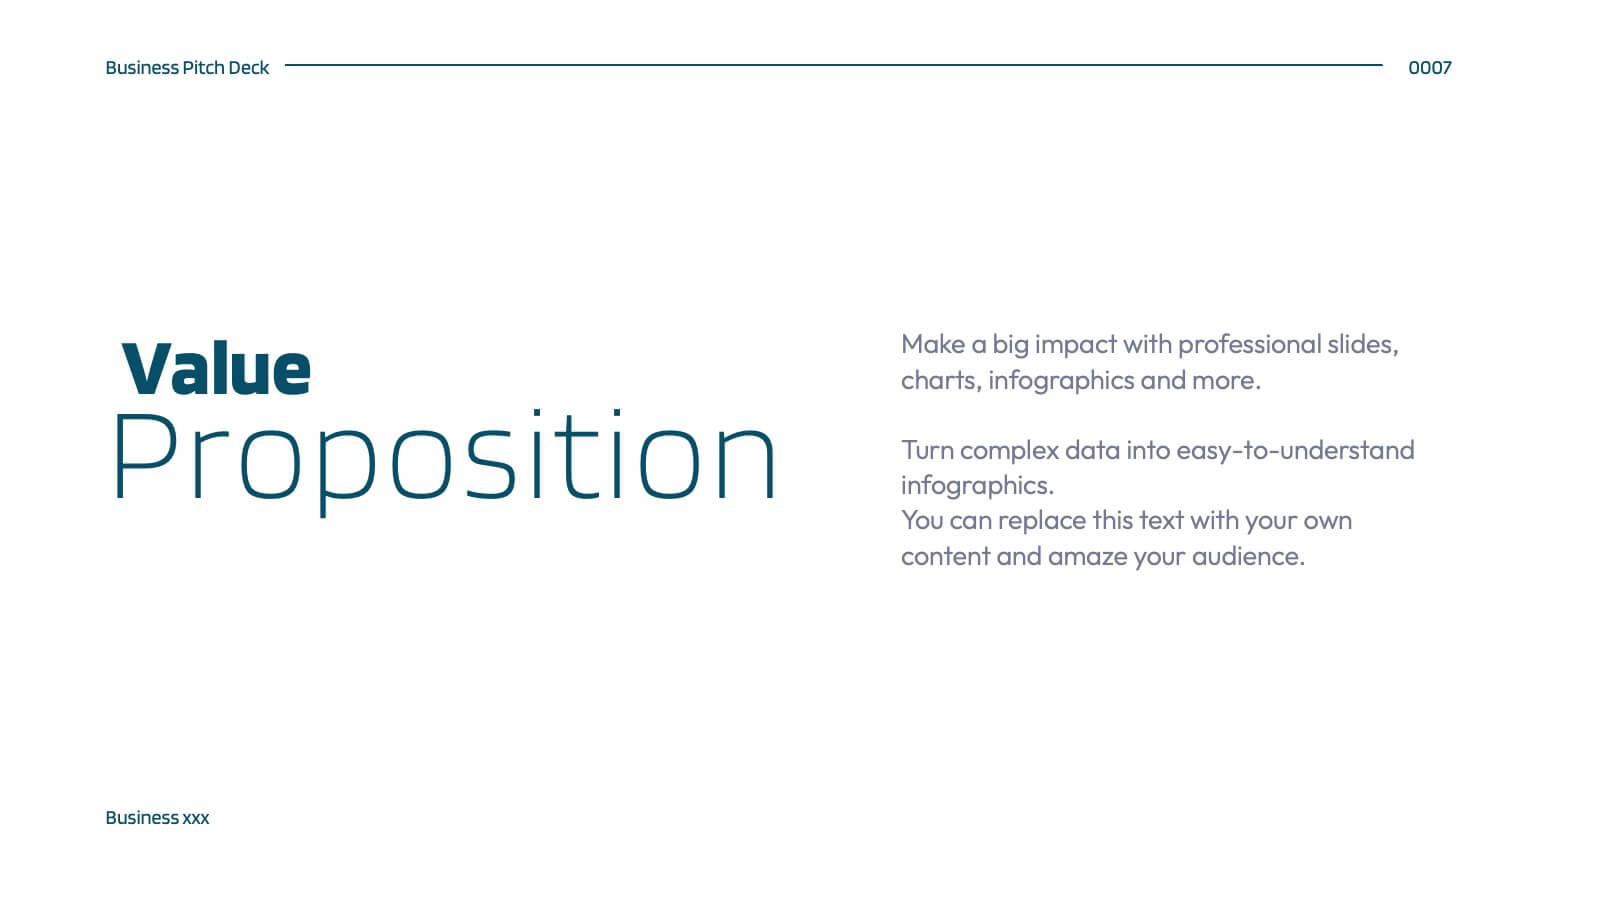
Elevate your digital strategy presentations with this vibrant, professional template. Perfect for showcasing market trends, SWOT analysis, and strategic objectives, it features a modern layout with a cohesive color scheme. Highlight key elements like growth opportunities, value propositions, and performance metrics to captivate your audience. Compatible with PowerPoint, Keynote, and Google Slides, it ensures seamless presentations on any platform.


5 slides
Human Resource Management Infographics
Human Resources Management is a critical function within organizations that focuses on managing and developing the human capital of an organization. These infographic templates are designed to showcase key concepts and strategies related to HR management. These infographics are in vertical form and offer a range of slide layouts to cover various aspects of HR. This offers a visually appealing and informative way to present key concepts and strategies. Compatible with Powerpoint, Keynote, and Google slides, Its customizable features and logical structure make it an effective tool for HR presentations or educational purposes related to HR management.

22 slides
Hellenic Small Business Pitch Deck Presentation
Unleash the spirit of entrepreneurship with this captivating Hellenic-themed presentation! Designed specifically for small business pitches, this template allows you to showcase your business concept, market analysis, and financial plans with elegance and clarity. Its vibrant visuals will engage your audience and leave a lasting impression. Compatible with PowerPoint, Keynote, and Google Slides.


5 slides
Social Media Marketing Infographics
Social Media Marketing is an essential component of any modern marketing strategy. These vertical infographics can be used to provide valuable insights into the most effective social media platforms, the latest trends in social media marketing, and tips and strategies for optimizing social media campaigns. These are an excellent way to communicate complex information in an easy-to-digest format and can be used for marketing and educational purposes. Use these infographics to Include data on user demographics, engagement rates, platform-specific best practices, and industry benchmarks.


7 slides
Hospital Operations and Medical Services Presentation
Showcase hospital services, departments, or medical workflows with the Hospital Operations and Medical Services Presentation. Featuring a central hospital graphic with six surrounding icons, this slide is ideal for healthcare strategy, facility overviews, or operational planning. Easily editable in Canva, PowerPoint, Keynote, and Google Slides for versatile use in any healthcare setting.


5 slides
Group Dynamics and Work Roles Presentation
Visualize team roles and responsibilities clearly with the Group Dynamics and Work Roles Presentation. This horizontal timeline layout highlights individual contributions and their position in the workflow, making it ideal for team structure, leadership roles, or project stages. Fully editable in Canva, PowerPoint, or Google Slides for smooth collaboration.


7 slides
Travel Infographic Presentation Template
Our Travel Infographic is a gorgeous infographic template that allows you to instantly create a modern, stylish and eye-catching travel infographic. You can easily customize this travel infographic to suit all your needs in just a few minutes. This Travel Infographic is designed to used as a travel guide with tons of destinations, flight deals and tips to make your trip memorable. This template can be used to help you create dynamic visual content for your travels. This travel infographic is a perfect way to plan, organize and prepare for your next trip or for all the upcoming trips!


3 slides
Project Proposal Executive Summary
Summarize your project proposal with clarity and visual appeal using this clean executive slide. Highlight key metrics, growth indicators, and progress updates alongside a modern photo layout that keeps your audience engaged. This template is fully customizable and compatible with PowerPoint, Keynote, and Google Slides for easy, polished presentations.


3 slides
Service and Product Benefits Overview Presentation
Clearly contrast key features with the Service and Product Benefits Overview Presentation. This modern split-layout design helps you showcase differences between service offerings and tangible products in a clean, side-by-side format. Use it to highlight value propositions, customer benefits, or decision-making factors. Fully editable and compatible with PowerPoint, Keynote, and Google Slides.


8 slides
Business Data Analytics Dashboard
Monitor performance with clarity using this Business Data Analytics Dashboard. Featuring data bars, numeric highlights, and color-coded insights, this slide is perfect for quarterly updates, data reviews, or executive summaries. Clean and professional, it's fully editable in PowerPoint, Keynote, and Google Slides.


4 slides
Science Lab Results and Data Analysis Presentation
Visualize lab data with clarity using this science-themed infographic. Featuring test tubes in a rack, it’s ideal for presenting experimental results, sample comparisons, or analysis summaries. Each tube aligns with icons and key points for easy interpretation. Fully customizable in PowerPoint, Keynote, and Google Slides to match your findings.


6 slides
Clear Roadmap and Action Strategy Presentation
Present your strategic roadmap with clarity using this arrow-step diagram. Ideal for visualizing processes, workflows, or goal-driven action plans. The curved sequence highlights five progressive steps with icons and color coding. Fully customizable in PowerPoint, Keynote, or Google Slides—perfect for business strategy meetings, project planning, or milestone tracking.


5 slides
The Future of Food Waste Infographics
Food Waste refers to the loss or disposal of food that is still edible or could have been consumed. These infographic template are designed with the aim of raising awareness, inspiring change, and empowering individuals and organizations to take action towards a more sustainable food system. These infographics are perfect for anyone interested in understanding the future trajectory of food waste and exploring potential solutions. With these infographic templates, create a presentation that inspires action and foster a collective commitment to combating food waste for a more sustainable future.