


Features
- 5 Unique slides
- Fully editable and easy to edit in Microsoft Powerpoint, Keynote and Google Slides
- 16:9 widescreen layout
- Clean and professional designs
- Export to JPG, PDF or send by email


Do you have any questions?
Recommend


6 slides
Strategic Planning with PESTEL Presentation
Dive into comprehensive environmental scanning with our "Strategic Planning with PESTEL" presentation template. This layout meticulously breaks down Political, Economic, Social, Technological, Environmental, and Legal factors, enabling thorough market analysis and strategy formulation. Perfect for strategists and analysts, the template supports PowerPoint, Keynote, and Google Slides, facilitating a dynamic and engaging planning session.


5 slides
Creative Alphabet Display Template
Make your message memorable with the Creative Alphabet Display Template Presentation. This slide uses bold, interlocking letter shapes to showcase four key ideas in a linear, eye-catching format—perfect for step-by-step processes, value breakdowns, or themed concepts. Fully editable in PowerPoint, Keynote, and Google Slides.
8 slides
3-Step Arrow Process Flow Presentation
Kickstart your message with a bold, directional visual that makes every step feel clear and intentional. This presentation showcases a simple three-stage progression ideal for explaining workflows, strategies, or business processes with clarity and impact. Easy to customize and fully compatible with PowerPoint, Keynote, and Google Slides.


5 slides
Pricing Strategy and Comparison Table Presentation
Present your pricing plans with clarity and impact using the Pricing Strategy and Comparison Table Presentation. This slide offers a structured layout to compare features, pricing tiers, and plan benefits side-by-side. Perfect for SaaS, services, or product pitches. Fully editable in Canva, PowerPoint, Google Slides, and Keynote.


5 slides
Strategic Budget Planning Forecasting
Tired of messy spreadsheets? This clean and creative template makes budget forecasting easier to visualize and share. Centered around a playful piggy bank illustration, it lets you outline strategic goals, savings plans, and key metrics in a format that’s easy to follow. Fully compatible with PowerPoint, Keynote, and Google Slides.


4 slides
Workplace Safety Guidelines Presentation
Create a safer, smarter workspace with this clean and visual presentation design. Ideal for communicating safety standards, compliance rules, and hazard prevention tips, it helps teams stay informed and engaged. Fully customizable and compatible with PowerPoint, Keynote, and Google Slides for easy editing and professional delivery.


6 slides
Global Transportation & Logistics Infographics
The "Global Transportation and Logistics" infographic template, suitable for PowerPoint, Keynote, and Google Slides, is an invaluable tool for professionals in the logistics, shipping, and supply chain industries. This comprehensive template is designed to effectively communicate the complexities and scope of global transportation and logistics. This template features key elements such as global shipping routes, logistics management, and supply chain operations. Its detailed and informative design is perfect for presentations that need to illustrate the intricacies of global logistics, from transportation networks to logistical challenges. This is especially useful for strategic planning, educational purposes, or corporate presentations in the logistics sector. The color scheme of the template reflects global connectivity and efficiency, incorporating shades of blue, green, and earth tones. This professional and visually appealing design not only enhances the clarity of the information but also adds a global perspective to your presentation. Whether used for training, client meetings, or industry conferences, this template ensures your insights into global transportation and logistics are presented with precision and professionalism.


6 slides
Financial Credit Card Analysis Presentation
The Financial Credit Card Analysis presentation template offers a comprehensive visual tool for comparing different aspects of credit card features. Designed for clarity and impact, this template showcases key data points like interest rates, reward programs, fees, and user benefits across multiple cards in a color-coded format. Each segment is clearly labeled for easy understanding, making it an excellent choice for financial analysts, advisors, or anyone presenting credit card options to clients or within financial education workshops. The modular design allows for customizable sections to adapt to specific needs or to highlight particular cards or features effectively.


5 slides
Productivity and Time Optimization Presentation
Visualize time-saving strategies and workflow efficiency with this hourglass-themed productivity template. Ideal for illustrating phased progress, deadlines, or time distribution, this design breaks your message into four clear sections with engaging visuals. Fully editable in PowerPoint, Keynote, and Google Slides.


6 slides
Organized Table of Content Layout Presentation
Introduce your presentation with structure and flow using this Organized Table of Content Layout. With six clearly numbered sections, connected through a dynamic flowchart design, this slide helps guide your audience through your key topics. Each section includes a title and space for a short description. This layout is ideal for reports, proposals, workshops, or strategy decks. Fully editable in PowerPoint, Keynote, and Google Slides.


10 slides
Financial Growth Planning
Visualize your path to financial success with this puzzle-themed Financial Growth Planning template. Each step connects seamlessly to outline investment goals, budgeting strategies, or revenue milestones. Designed for clarity and impact, it's fully editable in PowerPoint, Keynote, and Google Slides for effortless customization.


3 slides
Break Even Financial Model Presentation
Bring your financial story to life with this sleek and professional presentation design. Ideal for illustrating profit margins, cost recovery, or growth potential, it helps visualize when investments start to pay off. Fully customizable and compatible with PowerPoint, Keynote, and Google Slides for effortless editing and impactful presentations.


4 slides
Target Audience and Buyer Persona Analysis Presentation
Visually map out your core audience segments with this modern target diagram layout. This presentation features a concentric ring graphic to represent buyer personas and user data, alongside three editable text sections with icons for clear and structured insights. Ideal for marketing strategies, customer profiling, and campaign planning. Easily customizable in PowerPoint, Keynote, and Google Slides.


7 slides
Mental Agility Training Infographic
Embark on the enlightening path of training with our intricately designed mental agility training infographic. Illuminated by the motivation of yellow, the growth of green, and the depth of blue, our template effectively outlines training methodologies and outcomes. Adorned with precision-focused infographics, intuitive icons, and adaptable image placeholders, it renders complex training data into an easily digestible format. Expertly sculpted for Powerpoint, Keynote, or Google Slides. A quintessential tool for trainers, HR professionals, or any organization aiming to elevate its training regimen. Enlighten your audience; let every slide be a step towards mastery.


6 slides
Customer Journey Management Infographic
Map out the customer's path to purchase with our intuitive Customer Journey Management Infographic, perfect for Powerpoint, Google Slides, and Keynote. This visual tool helps businesses understand and enhance the customer experience at every touchpoint. Highlight critical stages from awareness to advocacy with distinct, easy-to-follow layouts. Customize it to fit your brand’s journey, showcasing the interactions and emotions customers encounter. Ideal for marketing strategy sessions and client presentations, it simplifies complex consumer behavior into a clear, actionable pathway.


5 slides
Oil Industry Revenue Infographics
The oil industry, also known as the petroleum industry, is a global sector that involves the exploration, production, refining, transportation, and marketing of petroleum products. These vertical infographics present key statistics and insights about the revenue generated by the oil industry. This infographic provides an overview of the financial aspects of the oil industry, including revenue sources, market trends, and economic impact. The template showcases the revenue trends of the oil industry over a specific period. It utilizes line graphs, bar charts, or other visual elements to illustrate the growth or fluctuations in revenue over time.


21 slides
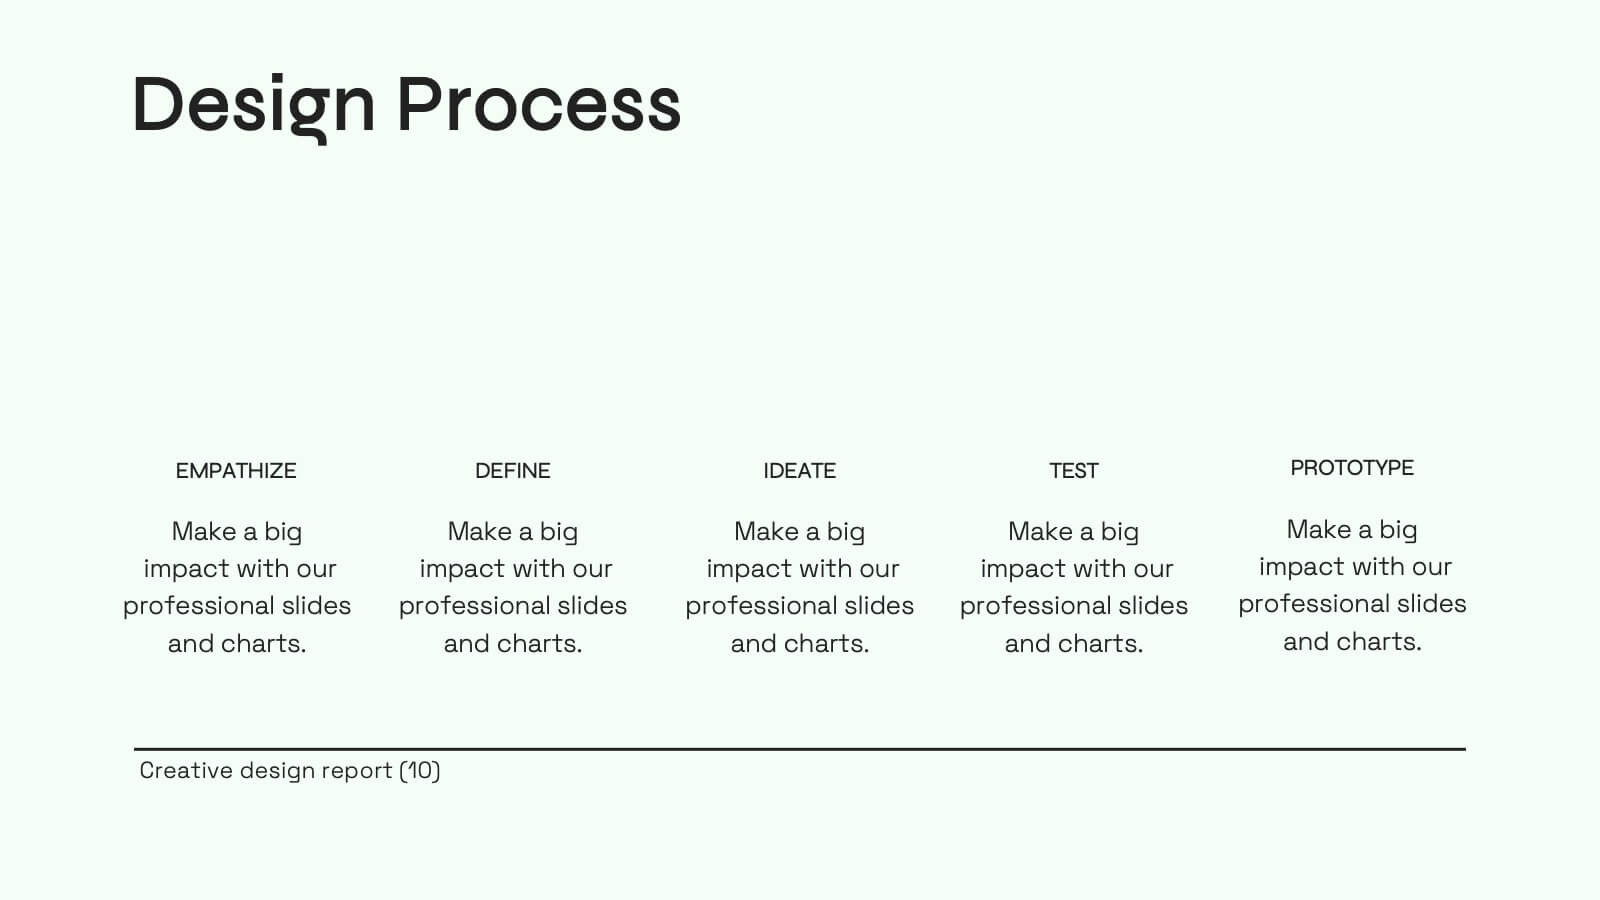
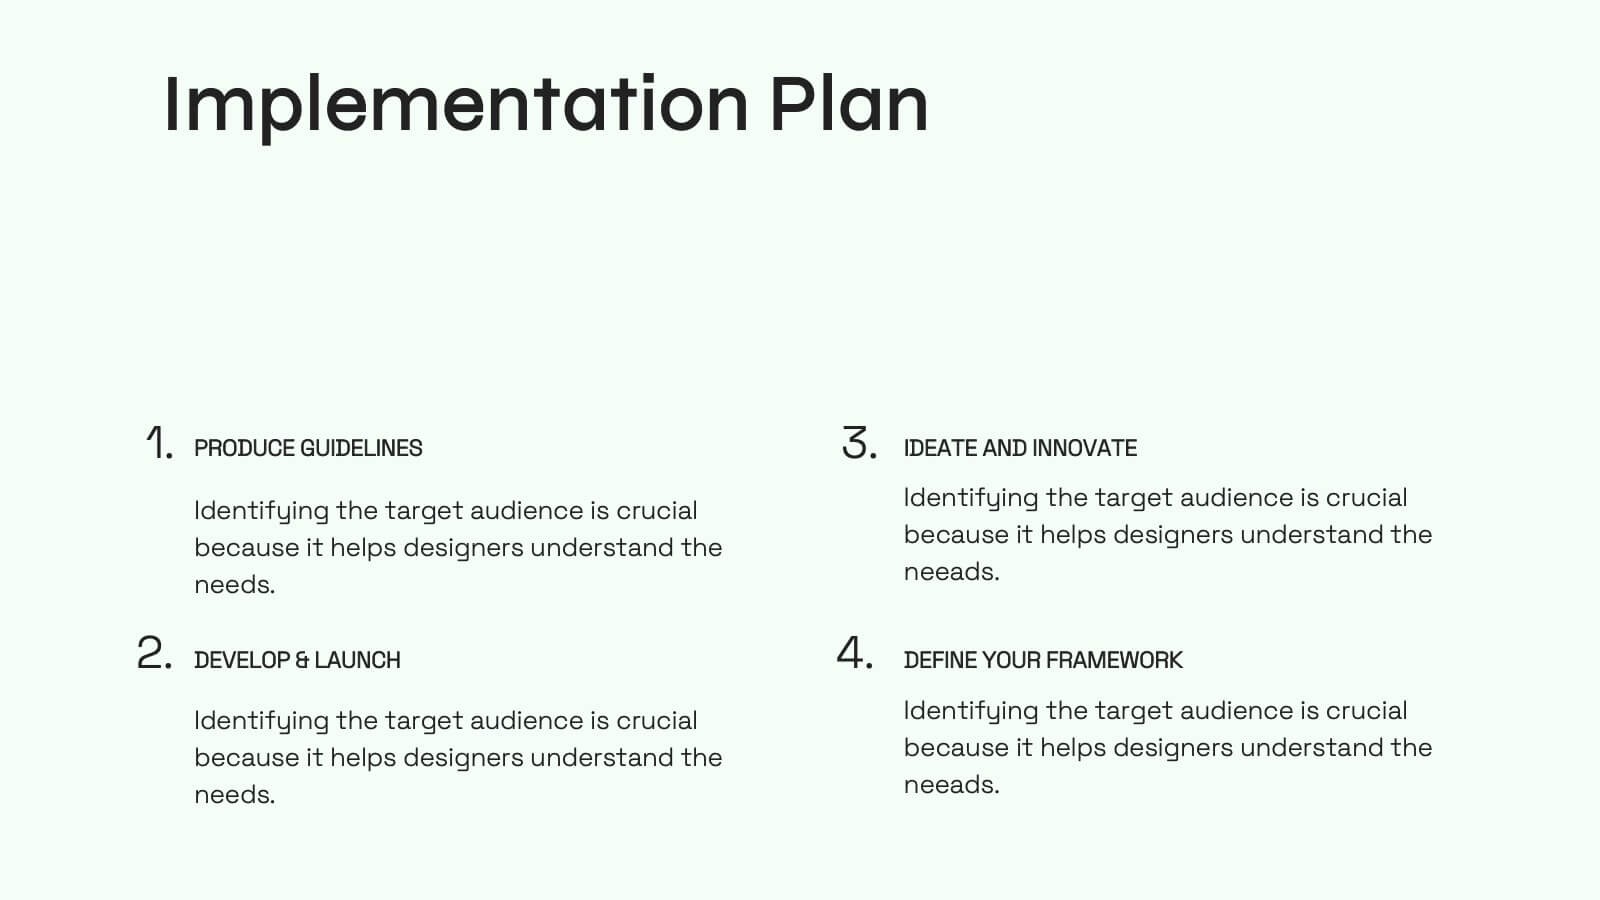
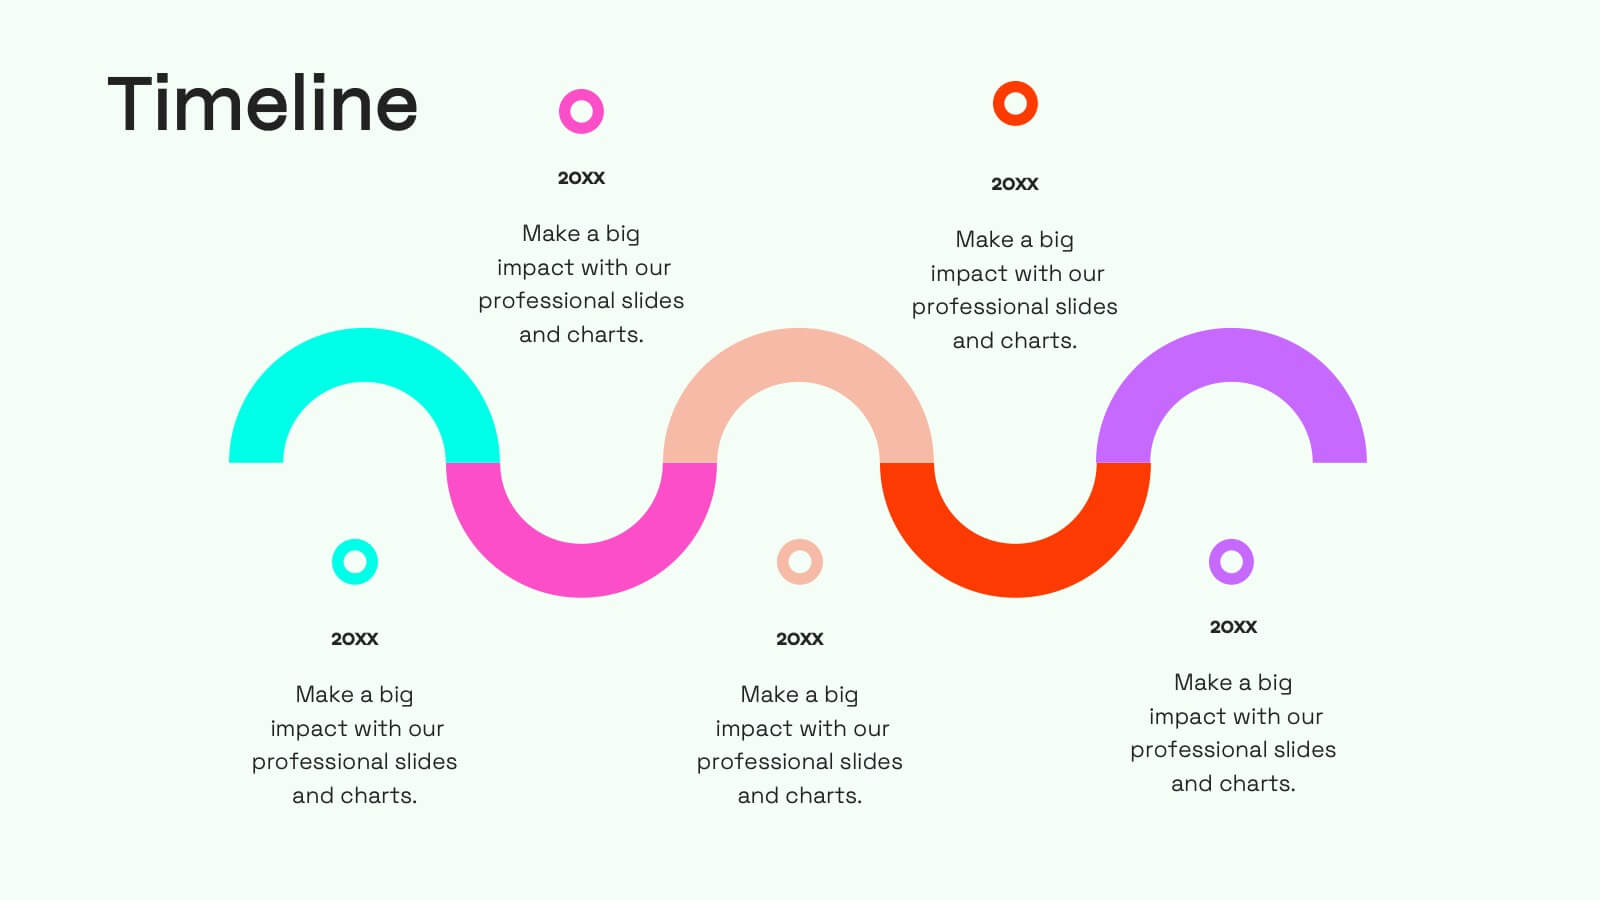
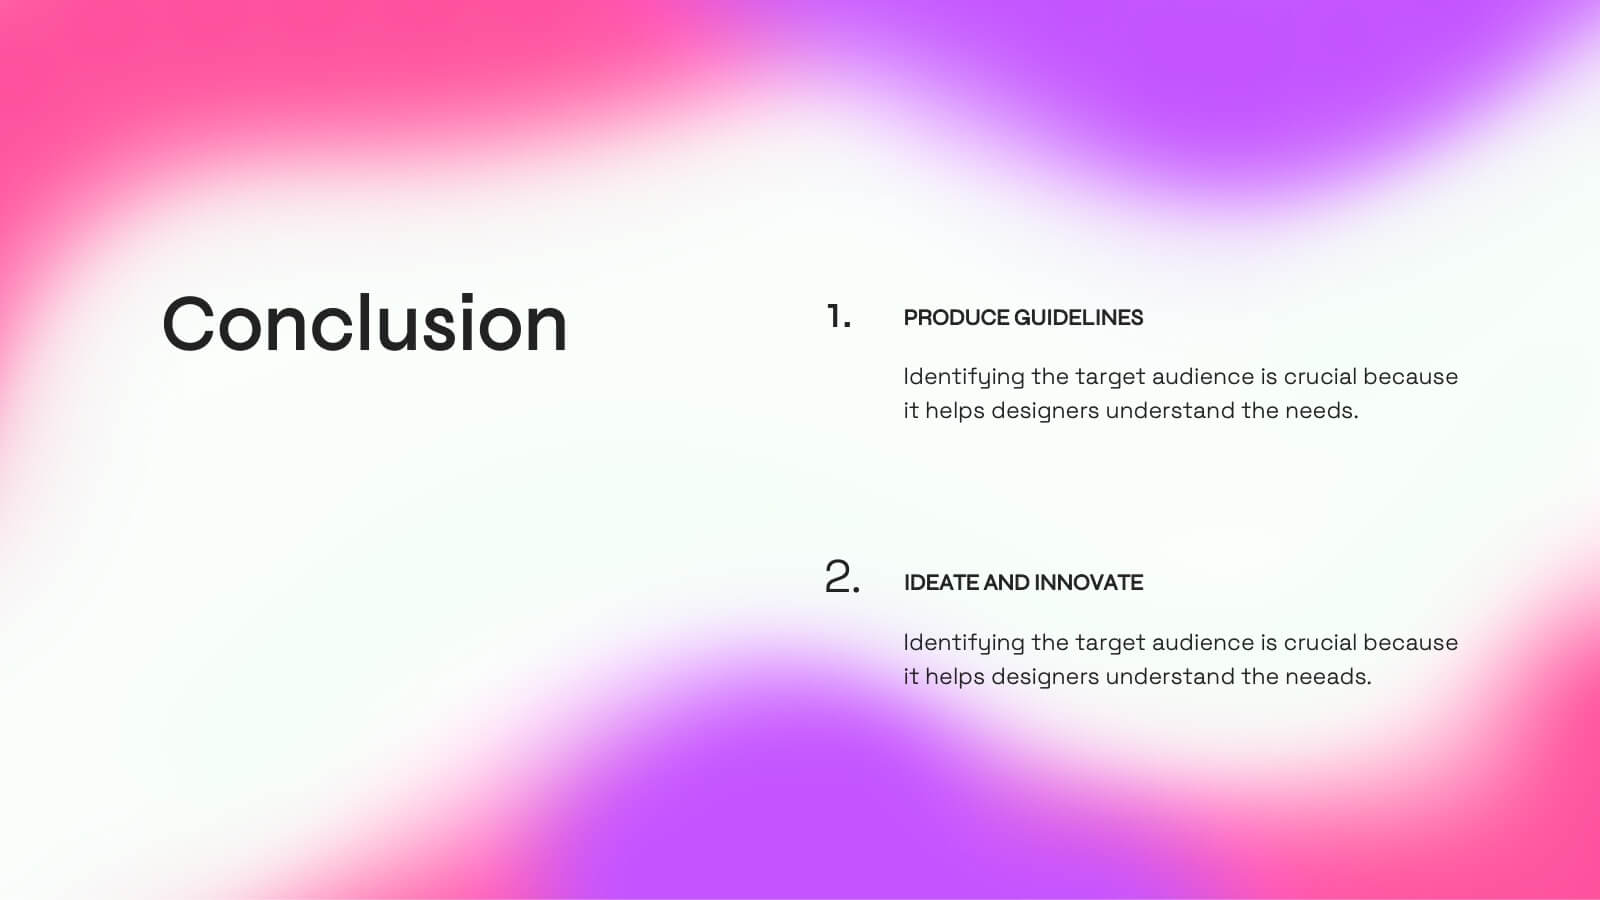
Jade Creative Design Report Presentation
Transform your design report into a captivating visual experience with this elegant jade-themed presentation template! Ideal for showcasing your creative projects, it effectively highlights key concepts, methodologies, and outcomes in a polished format. With its striking design, your work will impress clients and stakeholders alike. Compatible with PowerPoint, Keynote, and Google Slides.