


Features
- 4 Unique slides
- Fully editable and easy to edit in Microsoft Powerpoint, Keynote and Google Slides
- 16:9 widescreen layout
- Clean and professional designs
- Export to JPG, PDF or send by email


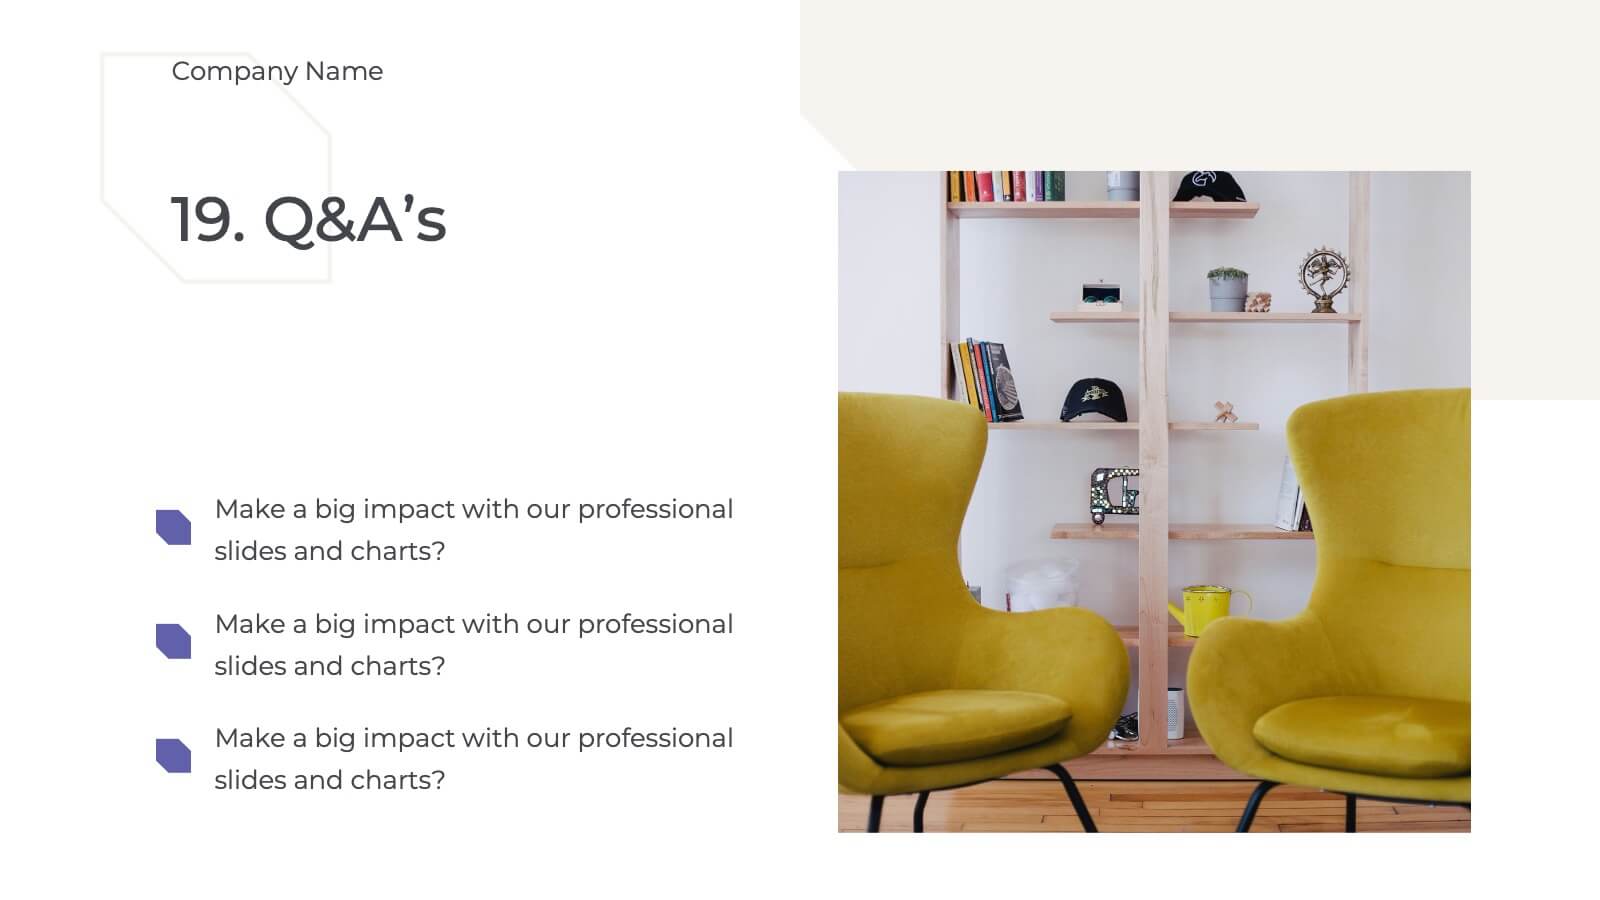
Do you have any questions?
Recommend


12 slides
Compliance and Policy Management Presentation
Visualize your compliance ecosystem with the Compliance and Policy Management Presentation. Designed around a planetary orbit concept, this slide maps core policies at the center with surrounding regulations and enforcement layers. Each orbit can represent levels of governance, department roles, or regulatory zones—making it ideal for risk teams, auditors, and legal advisors. Fully customizable in PowerPoint, Keynote, and Google Slides for seamless use.


6 slides
Market Sizing with TAM SAM SOM Strategy Presentation
Clearly define your market opportunity using the Market Sizing with TAM SAM SOM Strategy Presentation. This template breaks down Total Addressable Market, Serviceable Available Market, and Serviceable Obtainable Market with a visual bullseye format that’s intuitive and persuasive. Easily editable in PowerPoint, Keynote, and Google Slides.


5 slides
Root Cause Business Problem Slide
Uncover the foundation of complex challenges with this tree-inspired slide—perfect for visualizing root causes behind business problems. Showcase contributing factors at each root to guide effective solutions. Fully editable in PowerPoint, Keynote, and Google Slides.


10 slides
Project Execution Action Plan Presentation
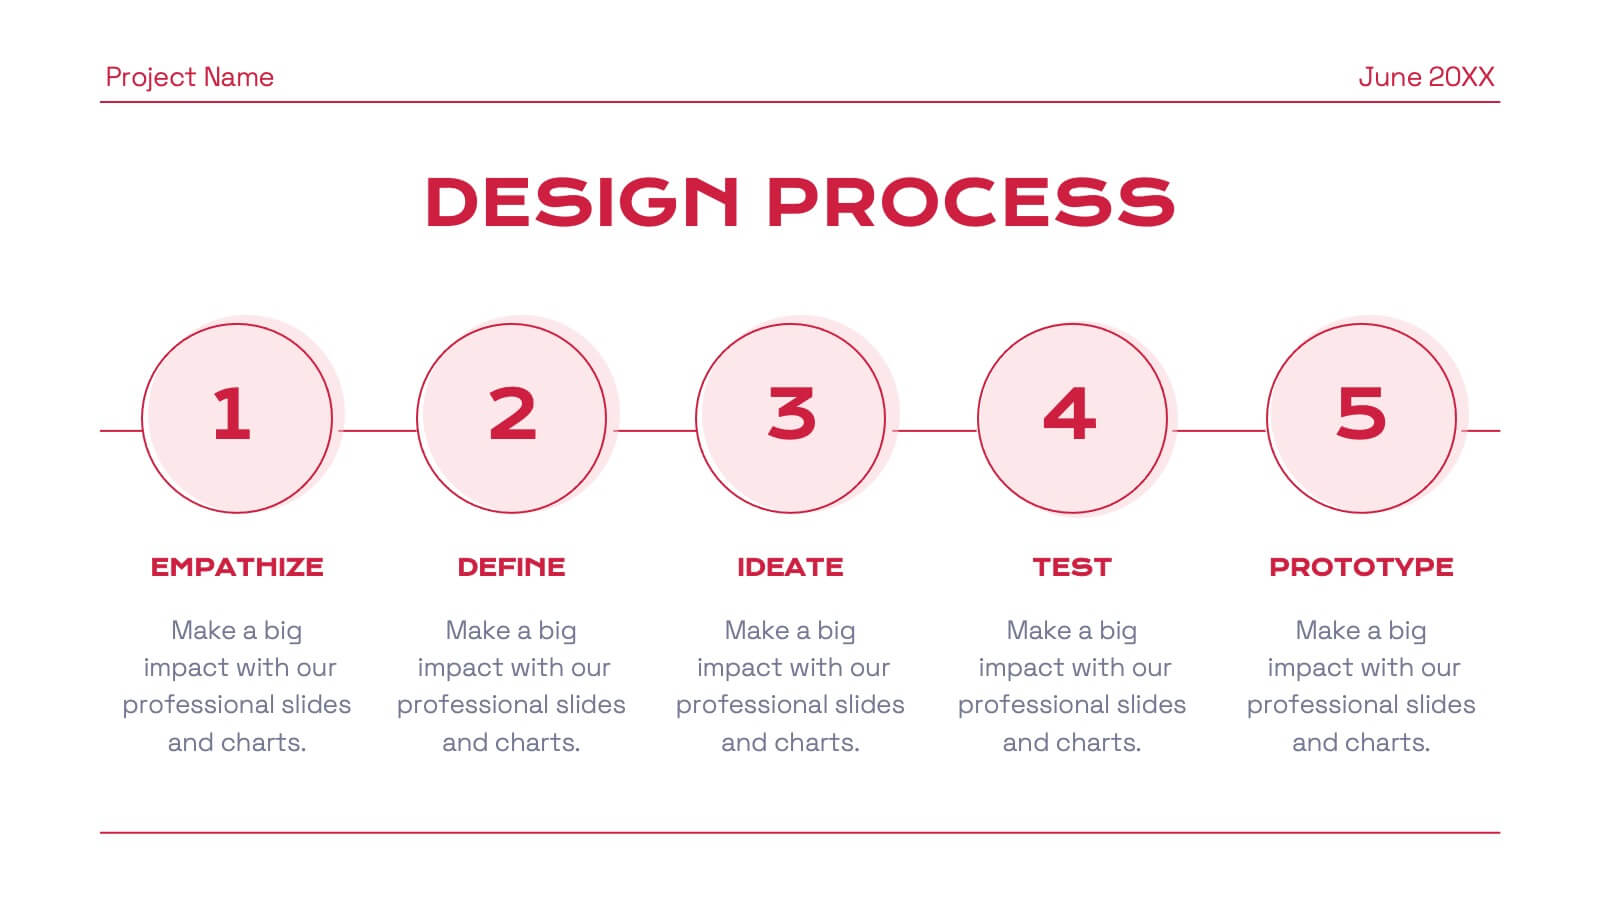
Turn strategy into action with the Project Execution Action Plan presentation. This dynamic, multi-step framework helps project managers, teams, and business leaders streamline execution, define key objectives, and track progress. The clean, professional design ensures clarity and engagement while remaining fully customizable for your needs. Compatible with PowerPoint, Keynote, and Google Slides.


6 slides
User-Centered Design Thinking Model Presentation
Highlight the key phases of your design process with the User-Centered Design Thinking Model Presentation. This slide features a profile silhouette with a segmented circular path inside the head, clearly representing five sequential stages. Perfect for illustrating empathy-driven innovation, product development, or user experience workflows. Fully editable in Canva, PowerPoint, Google Slides, and Keynote.

22 slides
Eclipse Graphic Design Project Plan Presentation
Develop a winning marketing strategy with this dynamic template. Dive into current trends, consumer behavior, and innovative techniques. Perfect for social media, influencer marketing, and data-driven campaigns. Fully compatible with PowerPoint, Keynote, and Google Slides.
22 slides
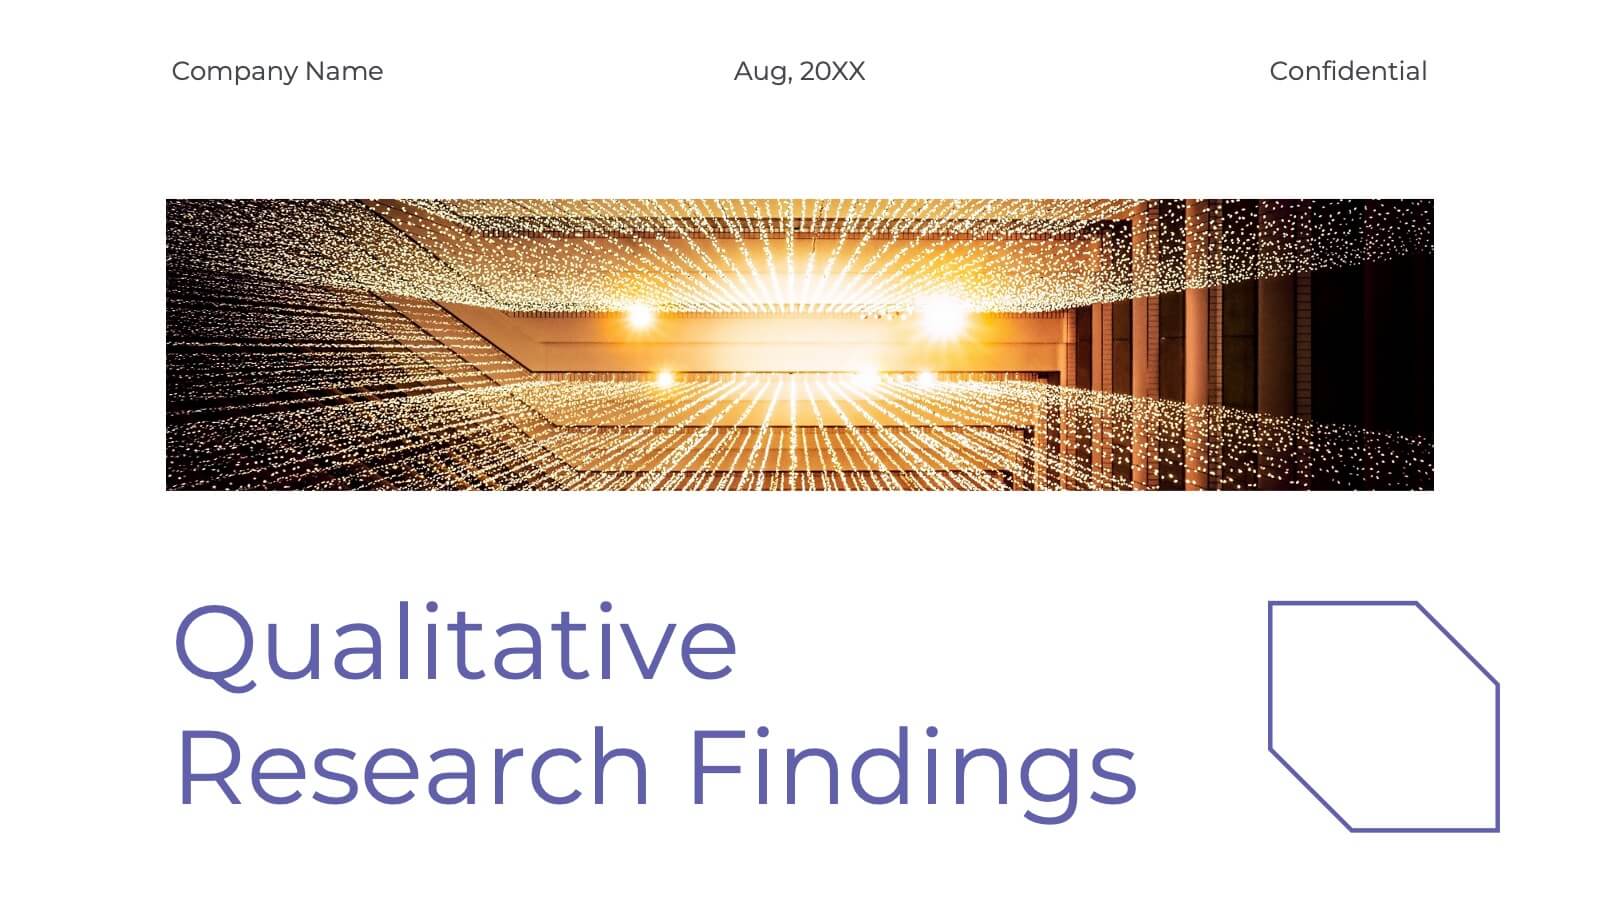
Palladium Qualitative Research Findings Presentation
Present your qualitative research findings effectively with this sleek, professional template. It includes sections for objectives, data analysis, key findings, and recommendations. Ideal for organizing research insights clearly, it's customizable and compatible with PowerPoint, Keynote, and Google Slides, ensuring smooth collaboration and impactful presentations for your audience.


6 slides
Business Decision Flow Model Presentation
Make smarter choices with this Business Decision Flow Model presentation. Clearly map out key decisions, steps, and potential outcomes using a structured, color-coded flow. Perfect for strategy reviews, team meetings, and executive briefings. Fully editable in Canva, PowerPoint, and Google Slides for seamless customization.


5 slides
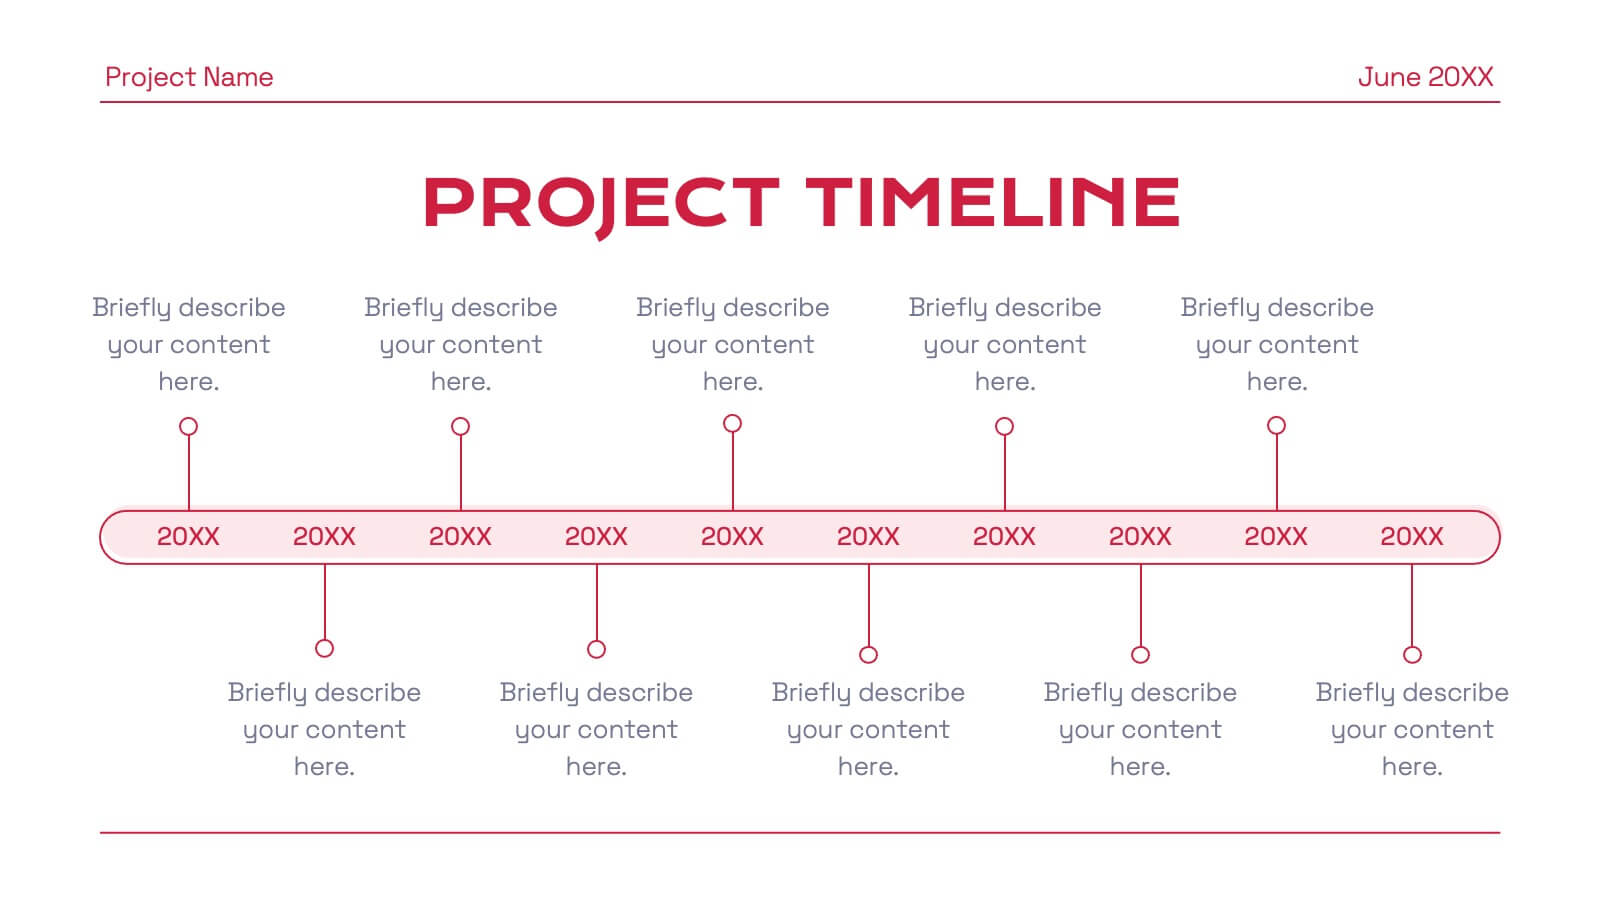
Rental Business Milestone Timeline Presentation
Showcase your company's growth journey with this clean Rental Business Milestone Timeline layout. Designed for tracking key achievements, it features a horizontal timeline with icons and customizable date markers. Perfect for business reviews or investor updates, it’s fully editable in PowerPoint, Keynote, and Google Slides for a professional presentation


8 slides
End-to-End Supply Chain Optimization
Enhance your supply chain efficiency with this dynamic circular diagram slide. Ideal for logistics experts, supply chain strategists, and consultants, this template visually captures the continuous flow of an 8-step supply chain cycle. Each step is customizable with editable icons and text in PowerPoint, Keynote, and Google Slides.


6 slides
Amortization Schedule Infographic
An amortization schedule is a detailed table that outlines the repayment of a loan over time. This infographic can be a helpful way to visually explain the repayment schedule of a loan or mortgage. Divide it into sections, including an introduction, explanation of terms, example calculations, and key takeaways. Compatible with Powerpoint, Keynote, and Google Slides. Use icons or visuals to represent loan-related concepts, such as a house for mortgages, a money bag for payments, or a graph for interest rates. The line graphs included can show the decreasing principal balance over time, with interest and principal portions highlighted.


4 slides
Project Proposal Executive Summary Presentation
Optimize your project presentations with the 'Project Proposal Executive Summary' template. Crafted to clearly showcase your project’s most crucial elements, this template uses visuals and concise text to highlight objectives and deliverables effectively. Ideal for professionals preparing proposals in PowerPoint, Keynote, or Google Slides.


6 slides
Editable Puzzle Infographic
Piece together complex data with our Editable Puzzle Infographic, compatible with Powerpoint, Google Slides, and Keynote. This engaging infographic is designed to help presenters visually connect different pieces of information in a cohesive and understandable way. The puzzle pieces are a metaphor for how individual components fit into a larger strategy or concept, making it perfect for collaborative projects or educational models. The infographic is fully customizable, allowing you to adapt the colors, text, and arrangement to fit your specific needs. With this puzzle infographic, you can make your presentations more interactive ensuring your audience can see the big picture every time.


4 slides
Minimal Title Page Variations Presentation
Highlight key ideas with style using the Minimal Title Page Variations Presentation. These clean and colorful layouts feature bold numbers, pastel text boxes, and abstract 3D artwork to instantly draw attention. Perfect for agendas, summaries, or content previews. Includes multiple layout options and is fully editable in PowerPoint, Keynote, and Google Slides.


7 slides
Business Plan Strategy Infographic
A business plan is a written document that outlines a company's goals and the strategy it will use to achieve those goals. This infographic template is a comprehensive roadmap for how a business intends to operate, grow, and succeed in its market. Compatible with Powerpoint, Keynote, and Google Slides. This template is meticulously designed to help you craft a well-structured business plan, empowering entrepreneurs and professionals to navigate their journey to success. Let this be your compass as you navigate the complexities of entrepreneurship and strive for business excellence!


21 slides
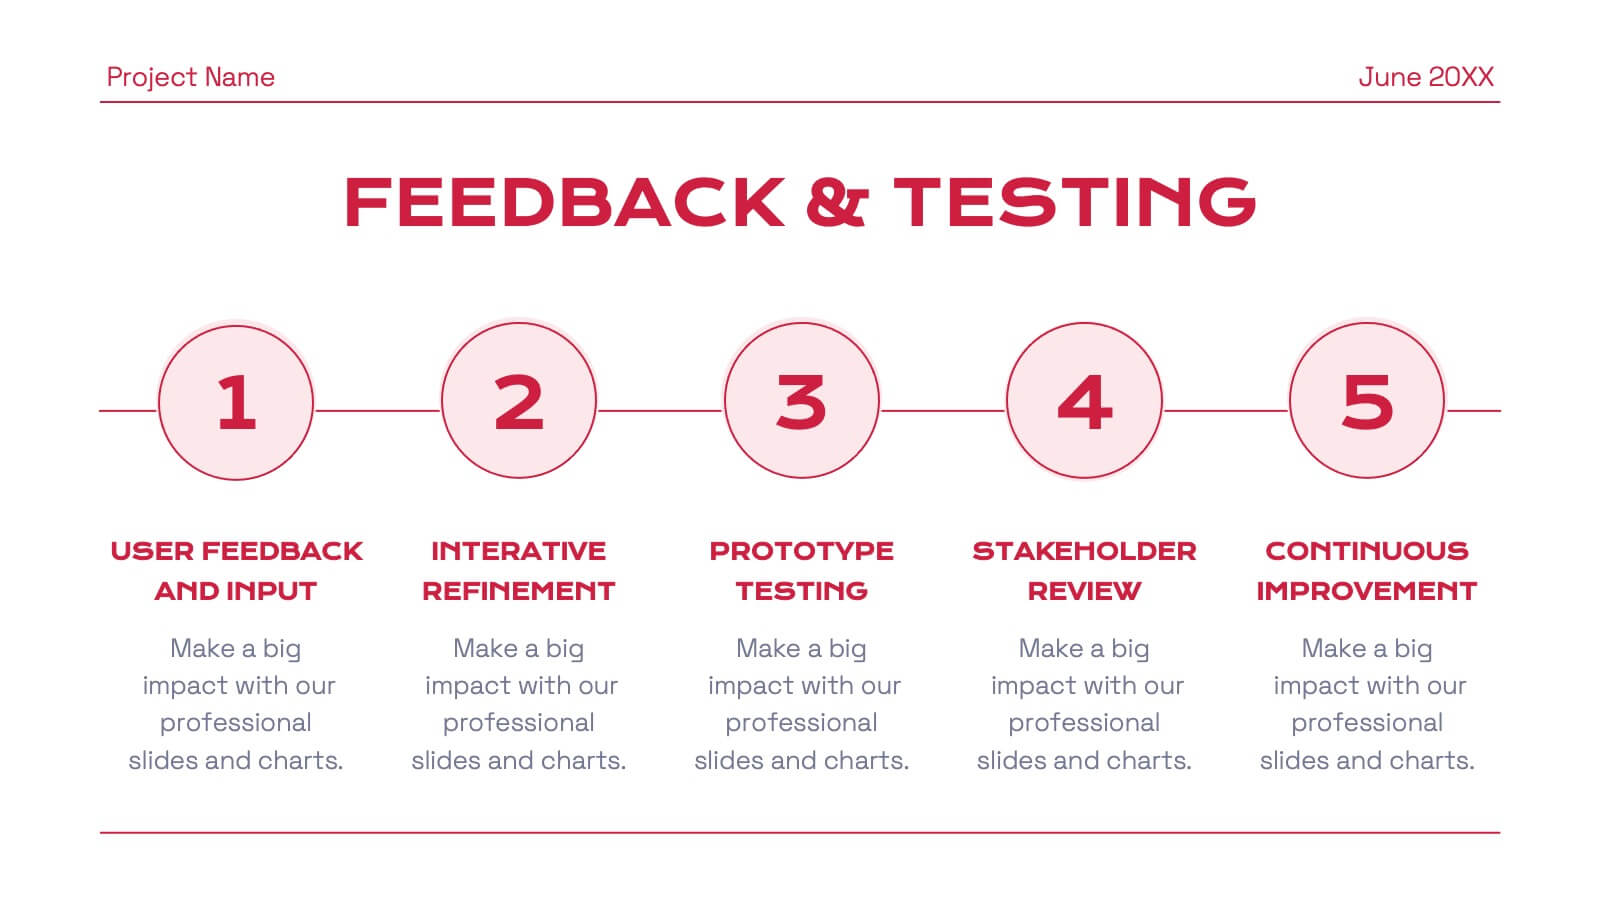
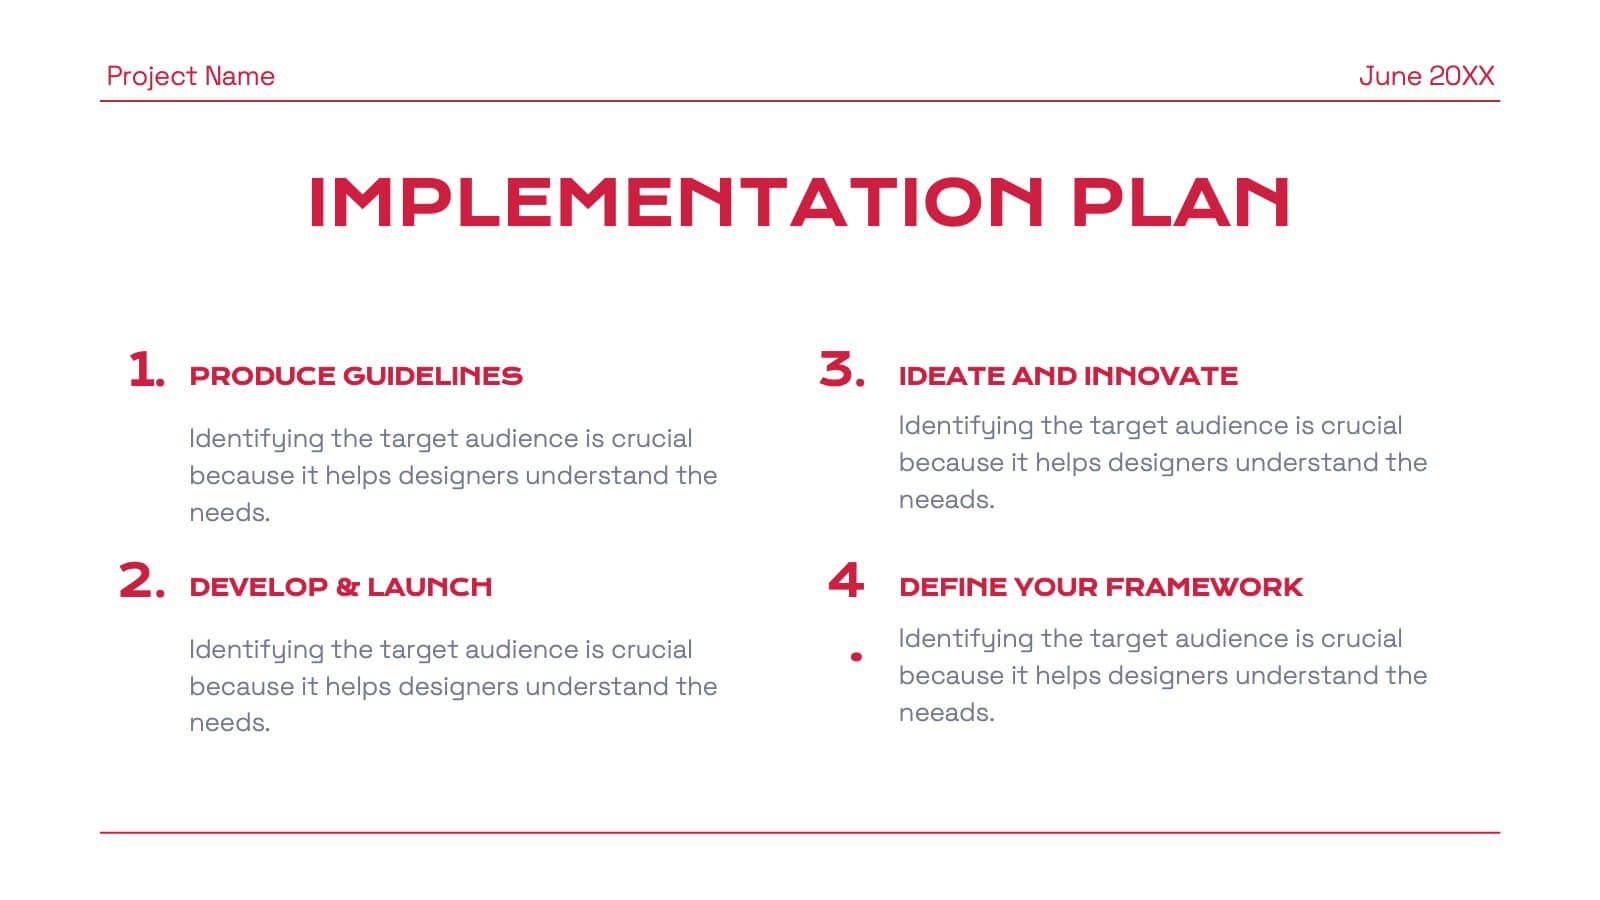
Dewspire Project Management Plan Presentation
Streamline your project planning process with this visually striking and organized presentation template. Perfectly designed to communicate every stage of your project management, it features sections for problem analysis, objectives, and the scope of work. The timeline, budget breakdown, and resource allocation slides ensure your plans are both clear and actionable. Highlight team expertise with dedicated meet the team layouts and showcase your commitment to quality through evaluation criteria and risk management plans. Ideal for team presentations or client proposals, this template supports PowerPoint, Google Slides, and Keynote, offering full customization for seamless adaptability. Deliver your project vision with confidence and precision!


5 slides
Water Industry Infographics
The Water Industry encompasses the management, treatment, distribution, and conservation of water resources. It plays a vital role in ensuring access to clean and safe water for various purposes. These infographic templates can serve as an effective educational tool for organizations, educational institutions, and environmental groups. This aims to inspire individuals and communities to make a positive impact by adopting sustainable water practices and contributing to the preservation of this vital resource. They are designed to inform about the importance of water conservation, sustainability, and efficient water management.