


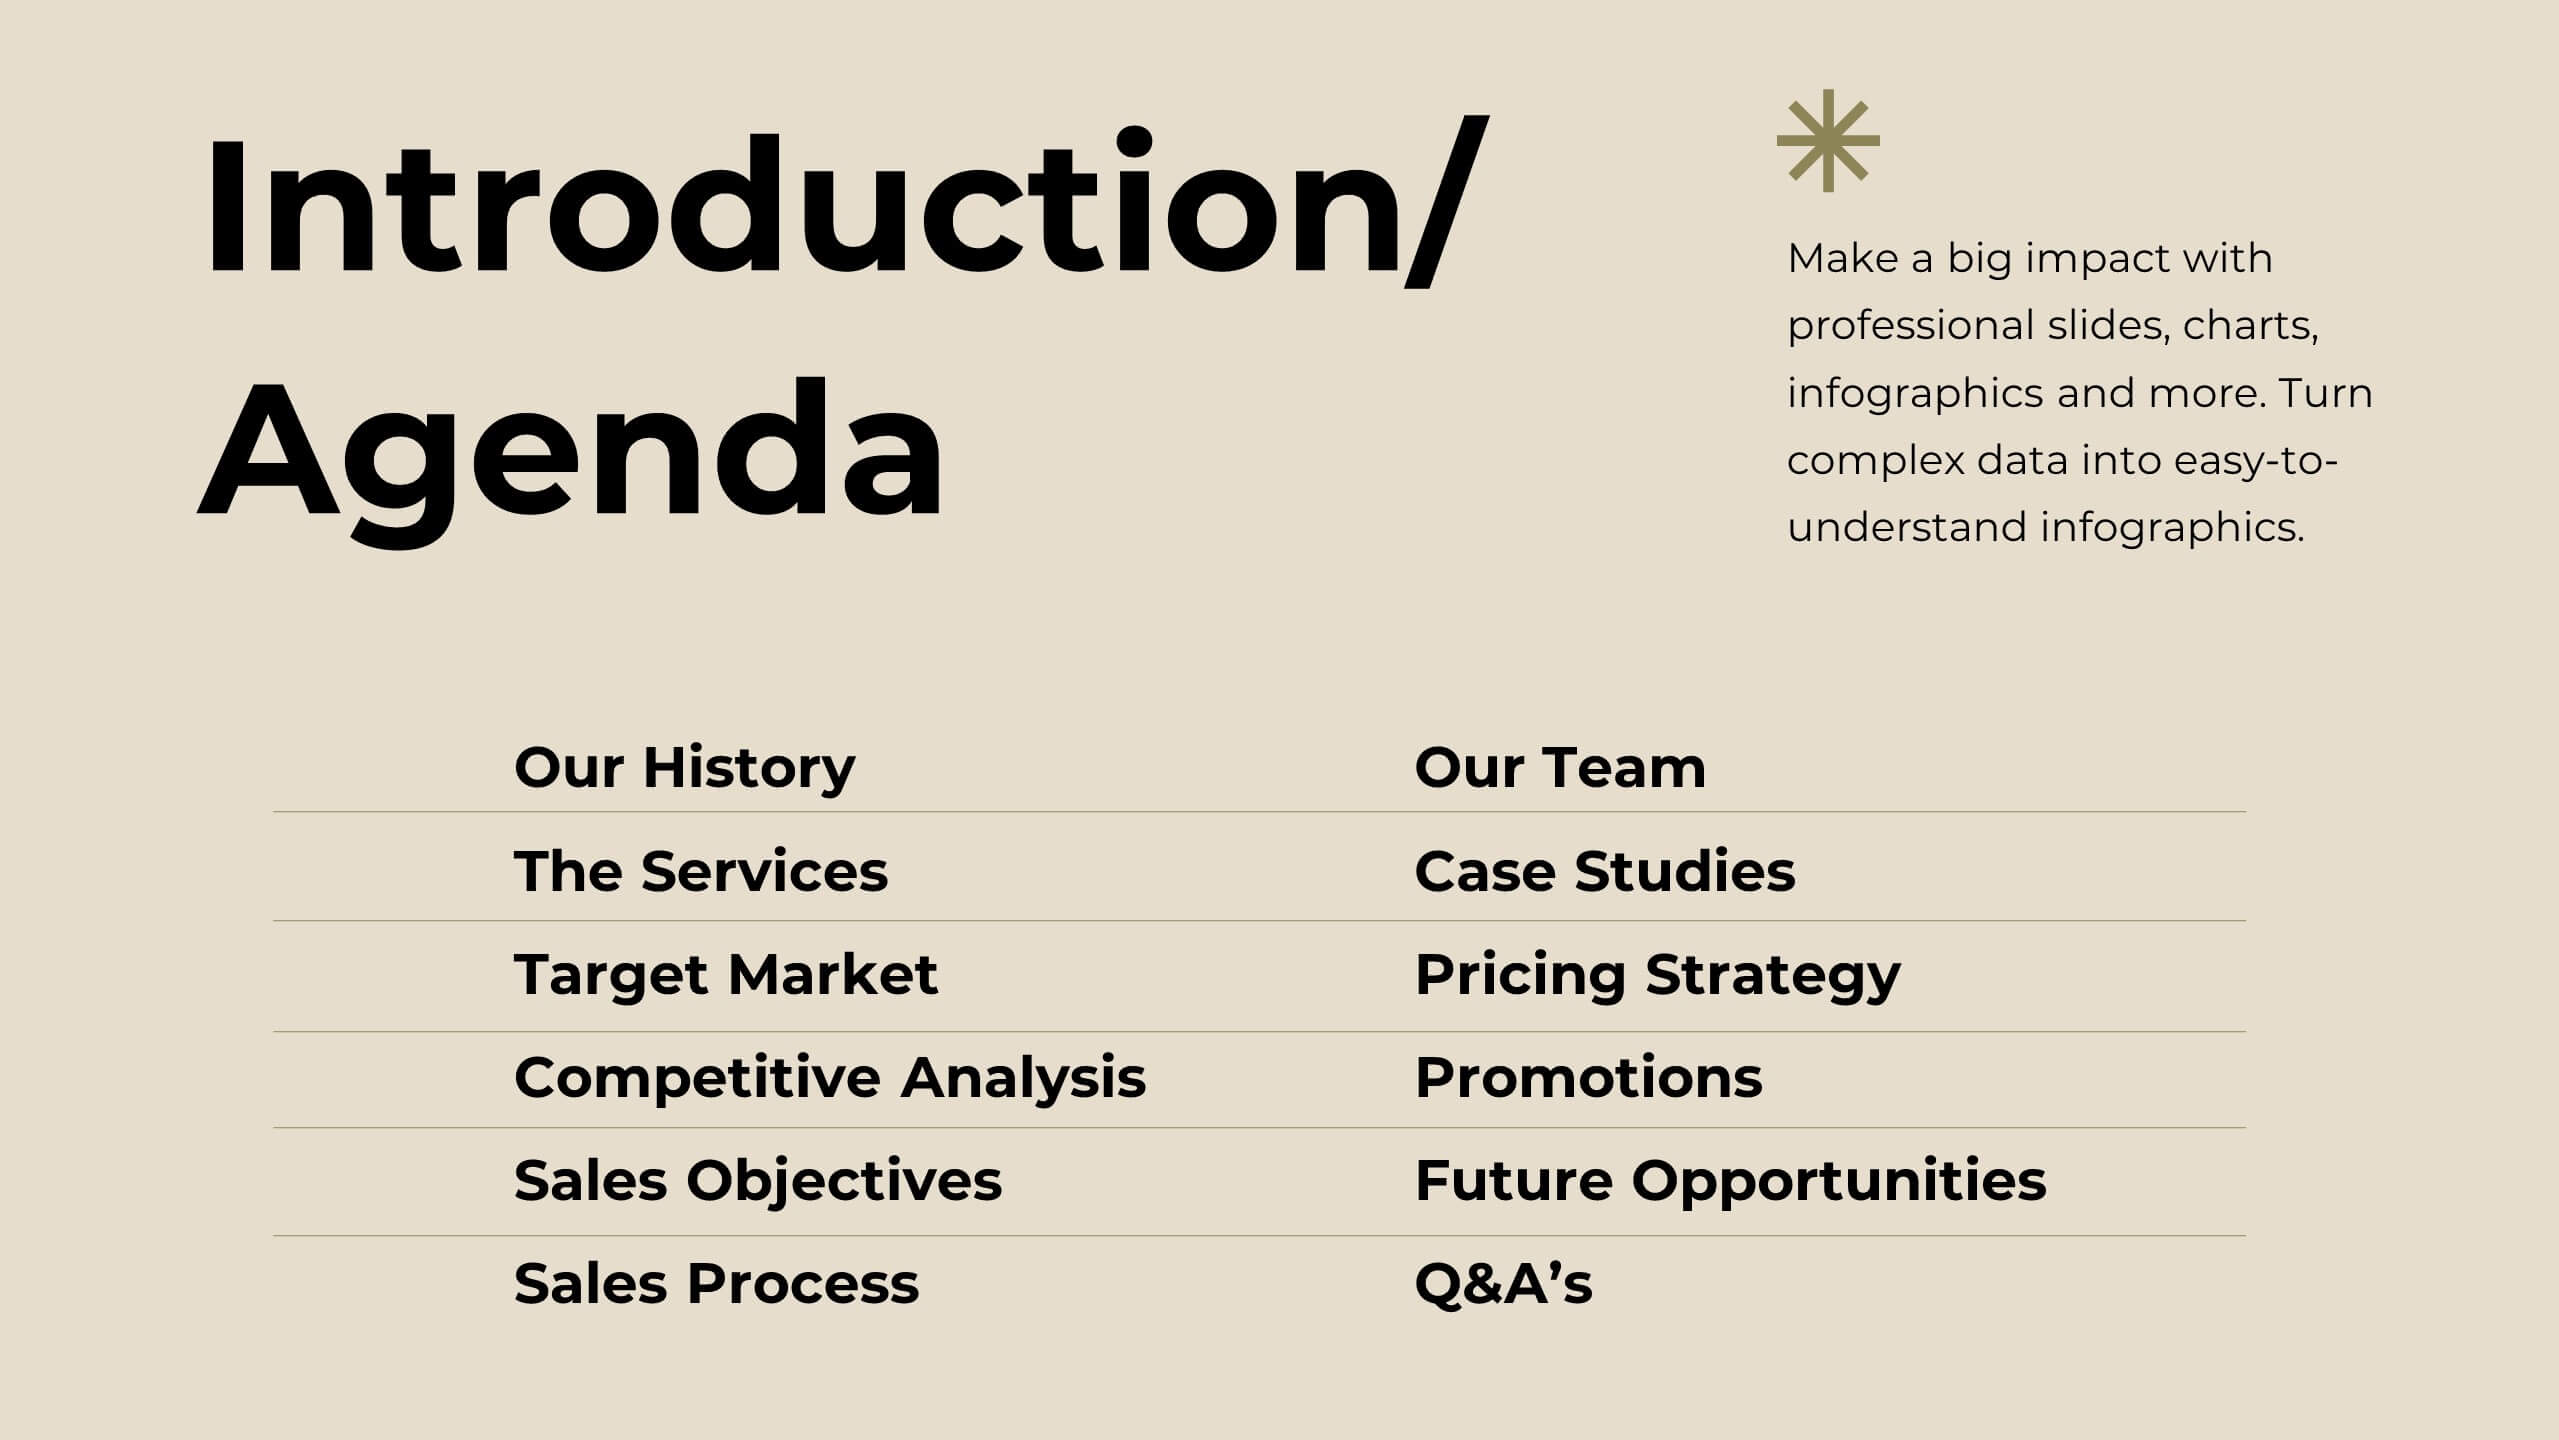
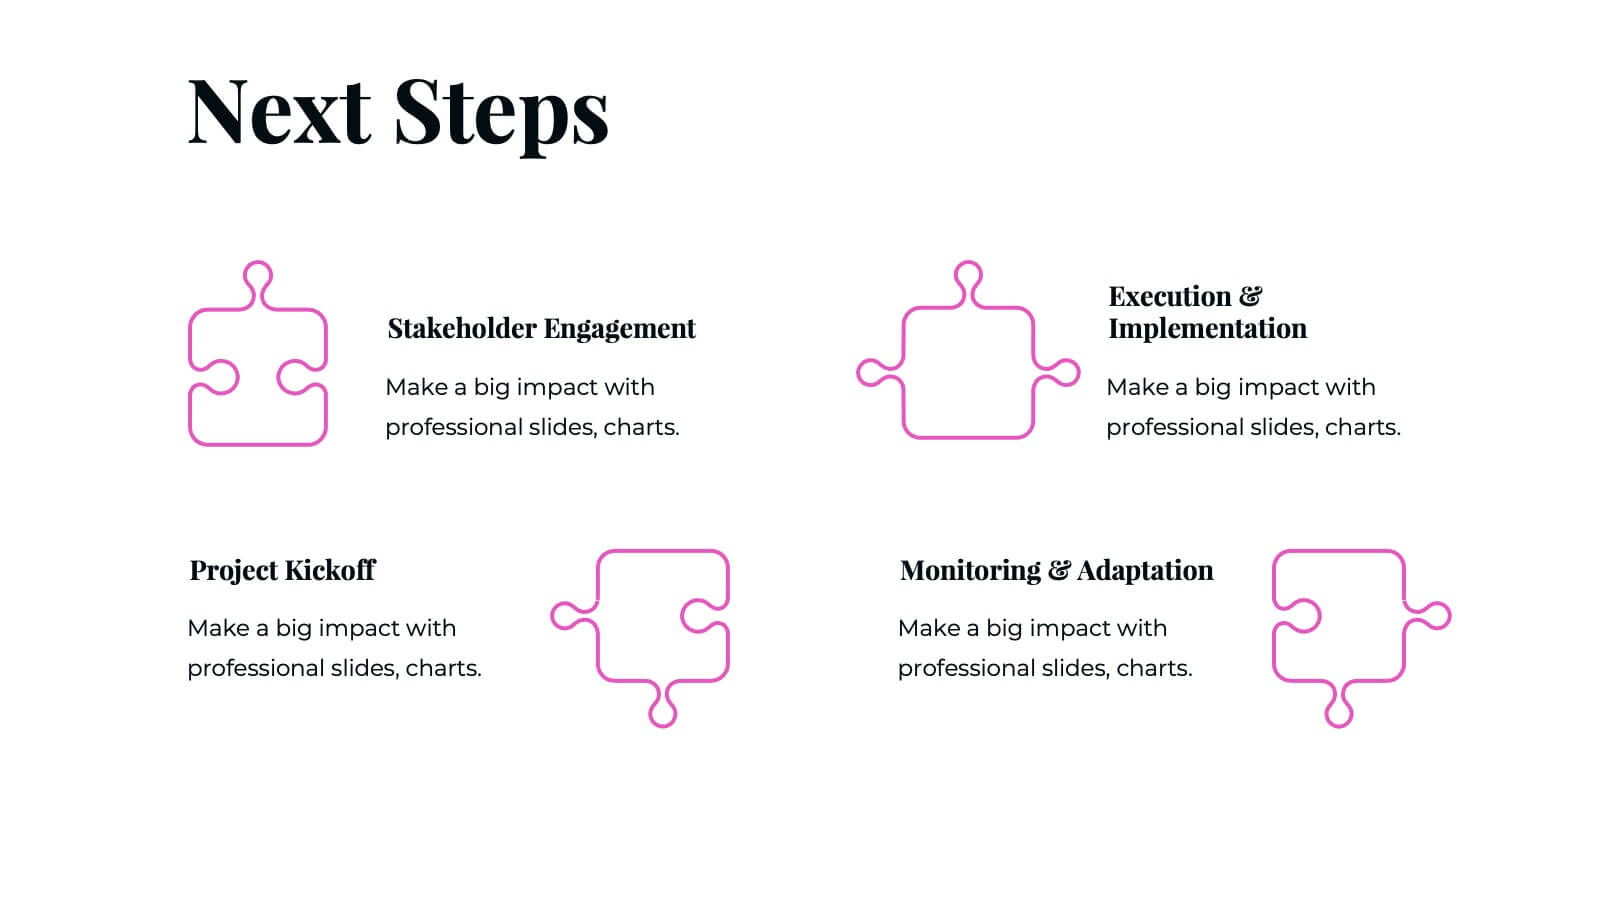
Features
- 5 Unique slides
- Fully editable and easy to edit in Microsoft Powerpoint, Keynote and Google Slides
- 16:9 widescreen layout
- Clean and professional designs
- Export to JPG, PDF or send by email


Do you have any questions?
Recommend


25 slides
The Power of HIIT Presentation
Supercharge your fitness routine with this high-energy presentation on the power of HIIT. Covering key benefits like fat burning, muscle endurance, metabolism boost, and time-efficient workouts, this template helps break down the science behind high-intensity interval training. Fully customizable and compatible with PowerPoint, Keynote, and Google Slides for a seamless presentation experience.


4 slides
Onboarding 30-60-90 Roadmap Presentation
Simplify your onboarding strategy with the Onboarding 30–60–90 Roadmap Presentation. This clean, visual layout breaks down employee integration into three distinct timeframes—30, 60, and 90 days—each with space for goals, tasks, or milestones. Perfect for HR teams, managers, and trainers. Fully editable in Canva, PowerPoint, Keynote, and Google Slides.


20 slides
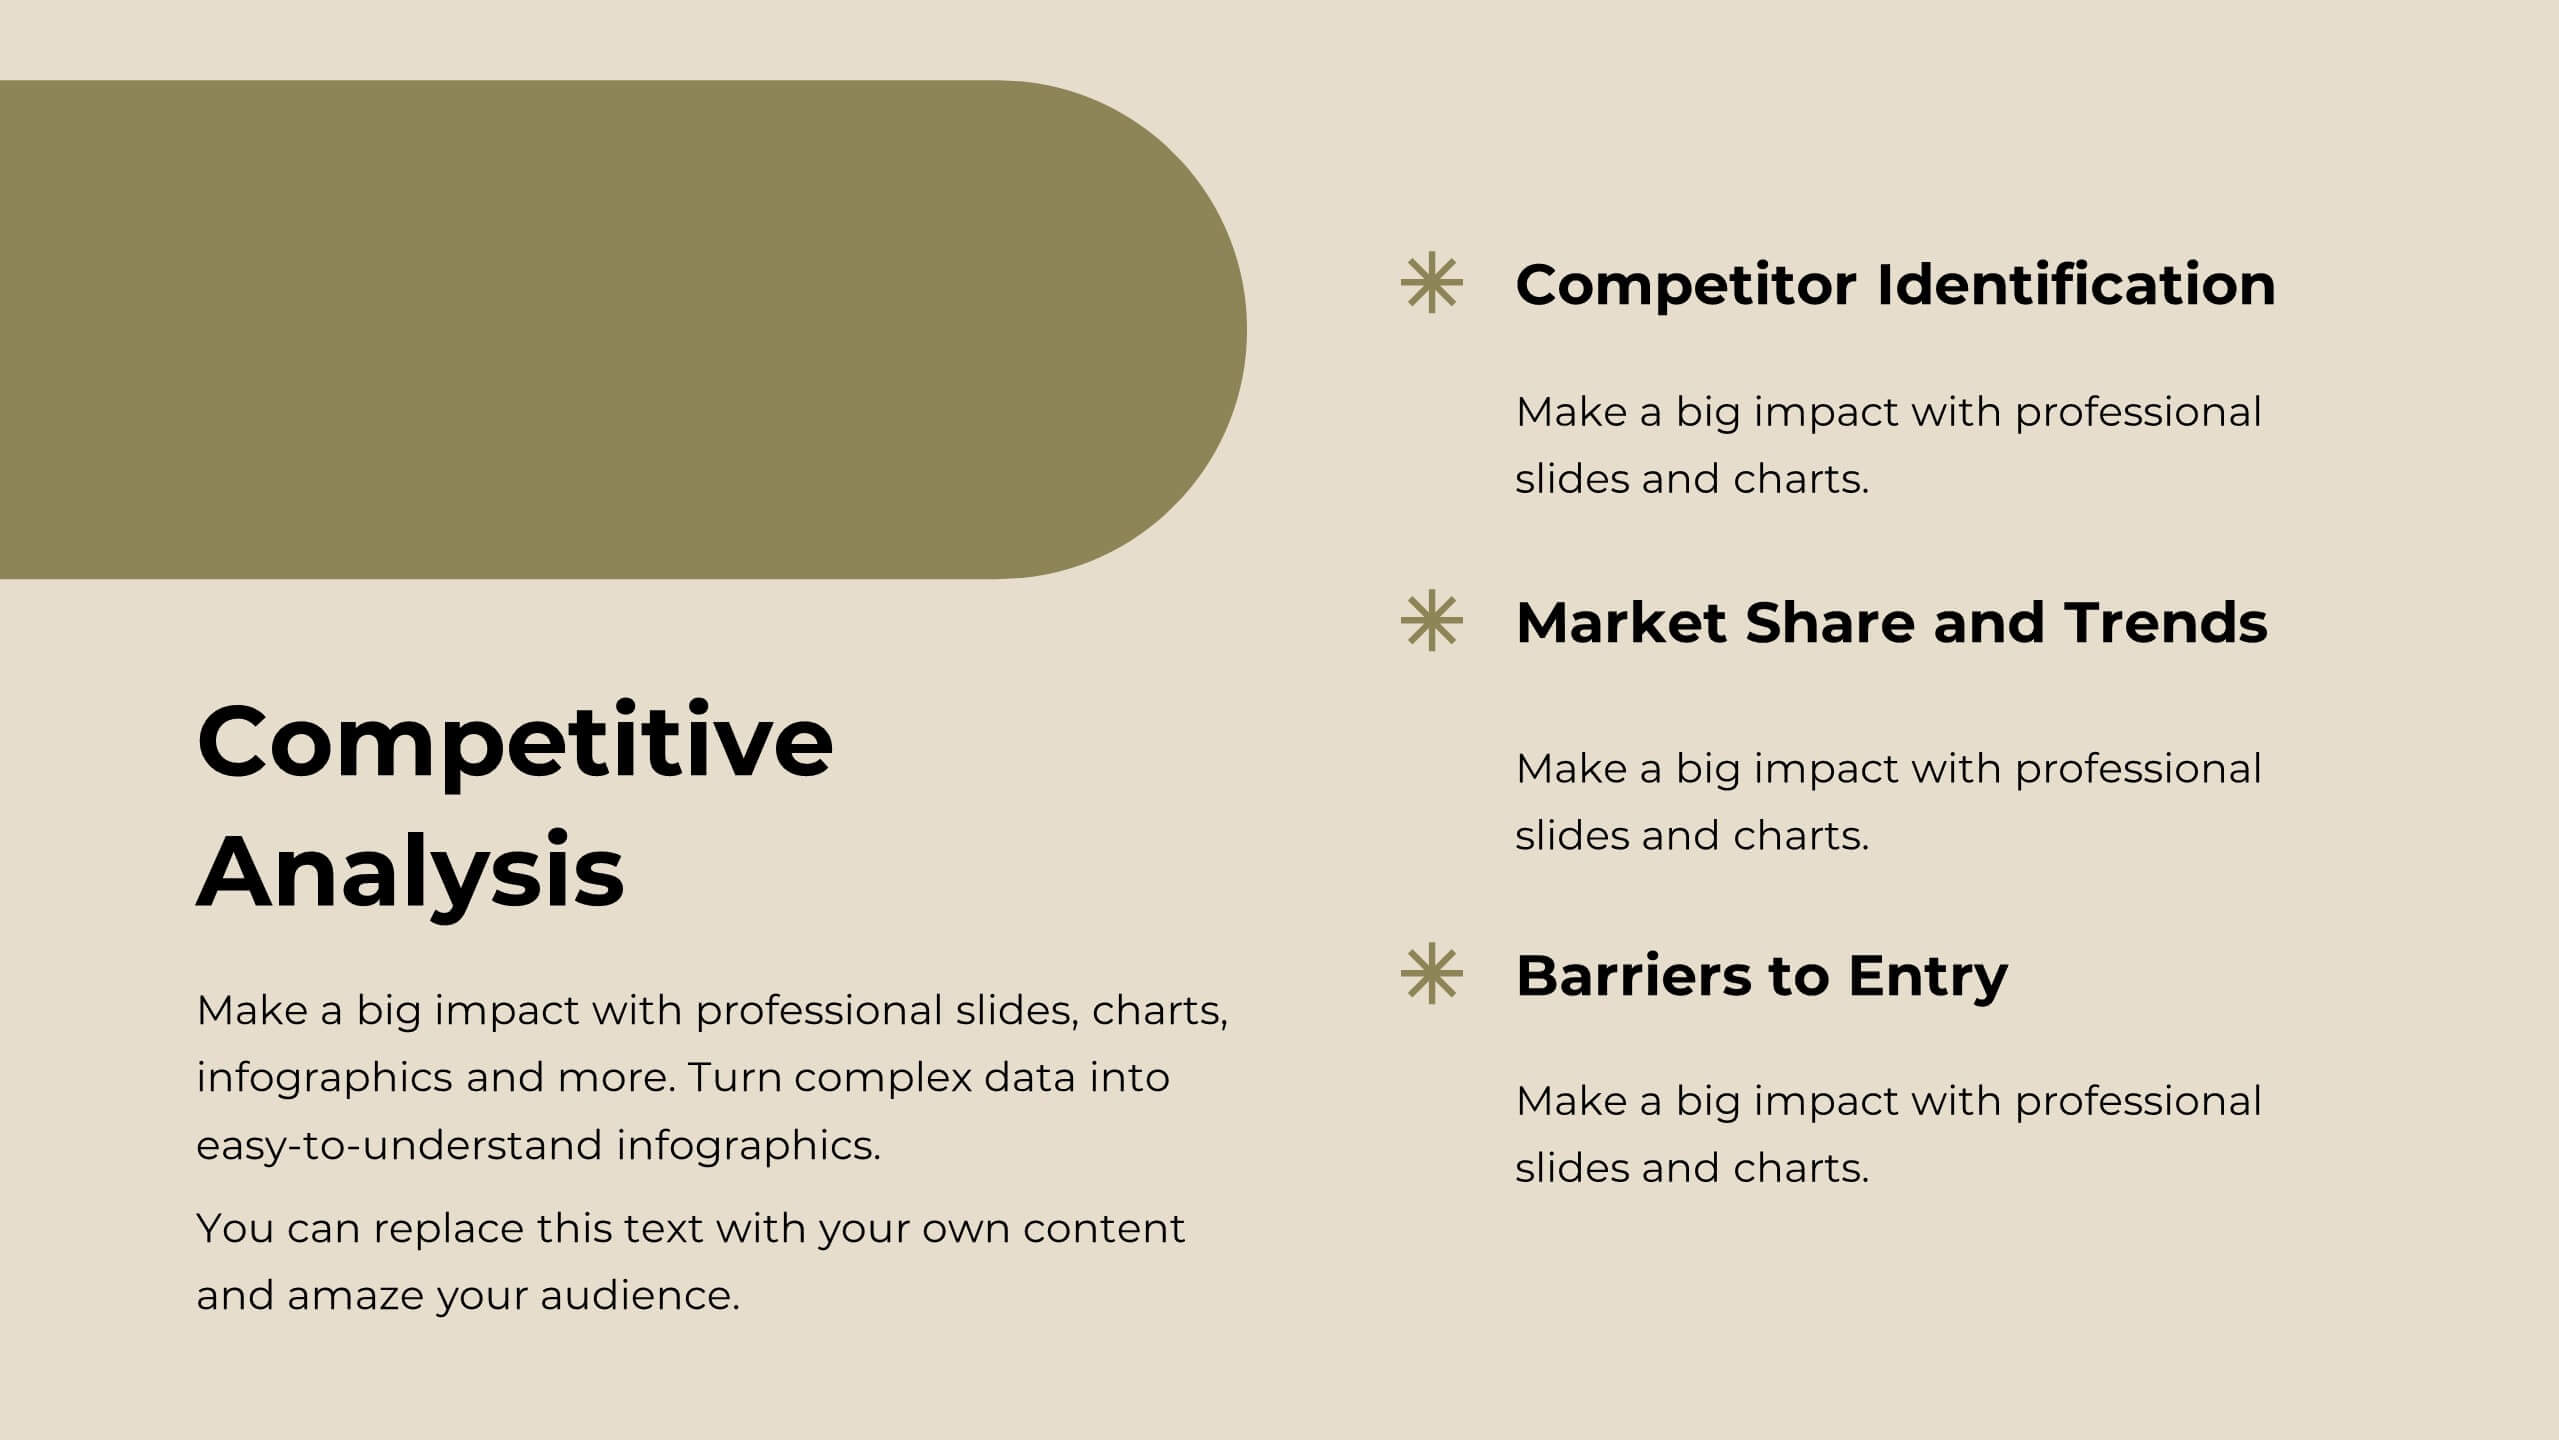
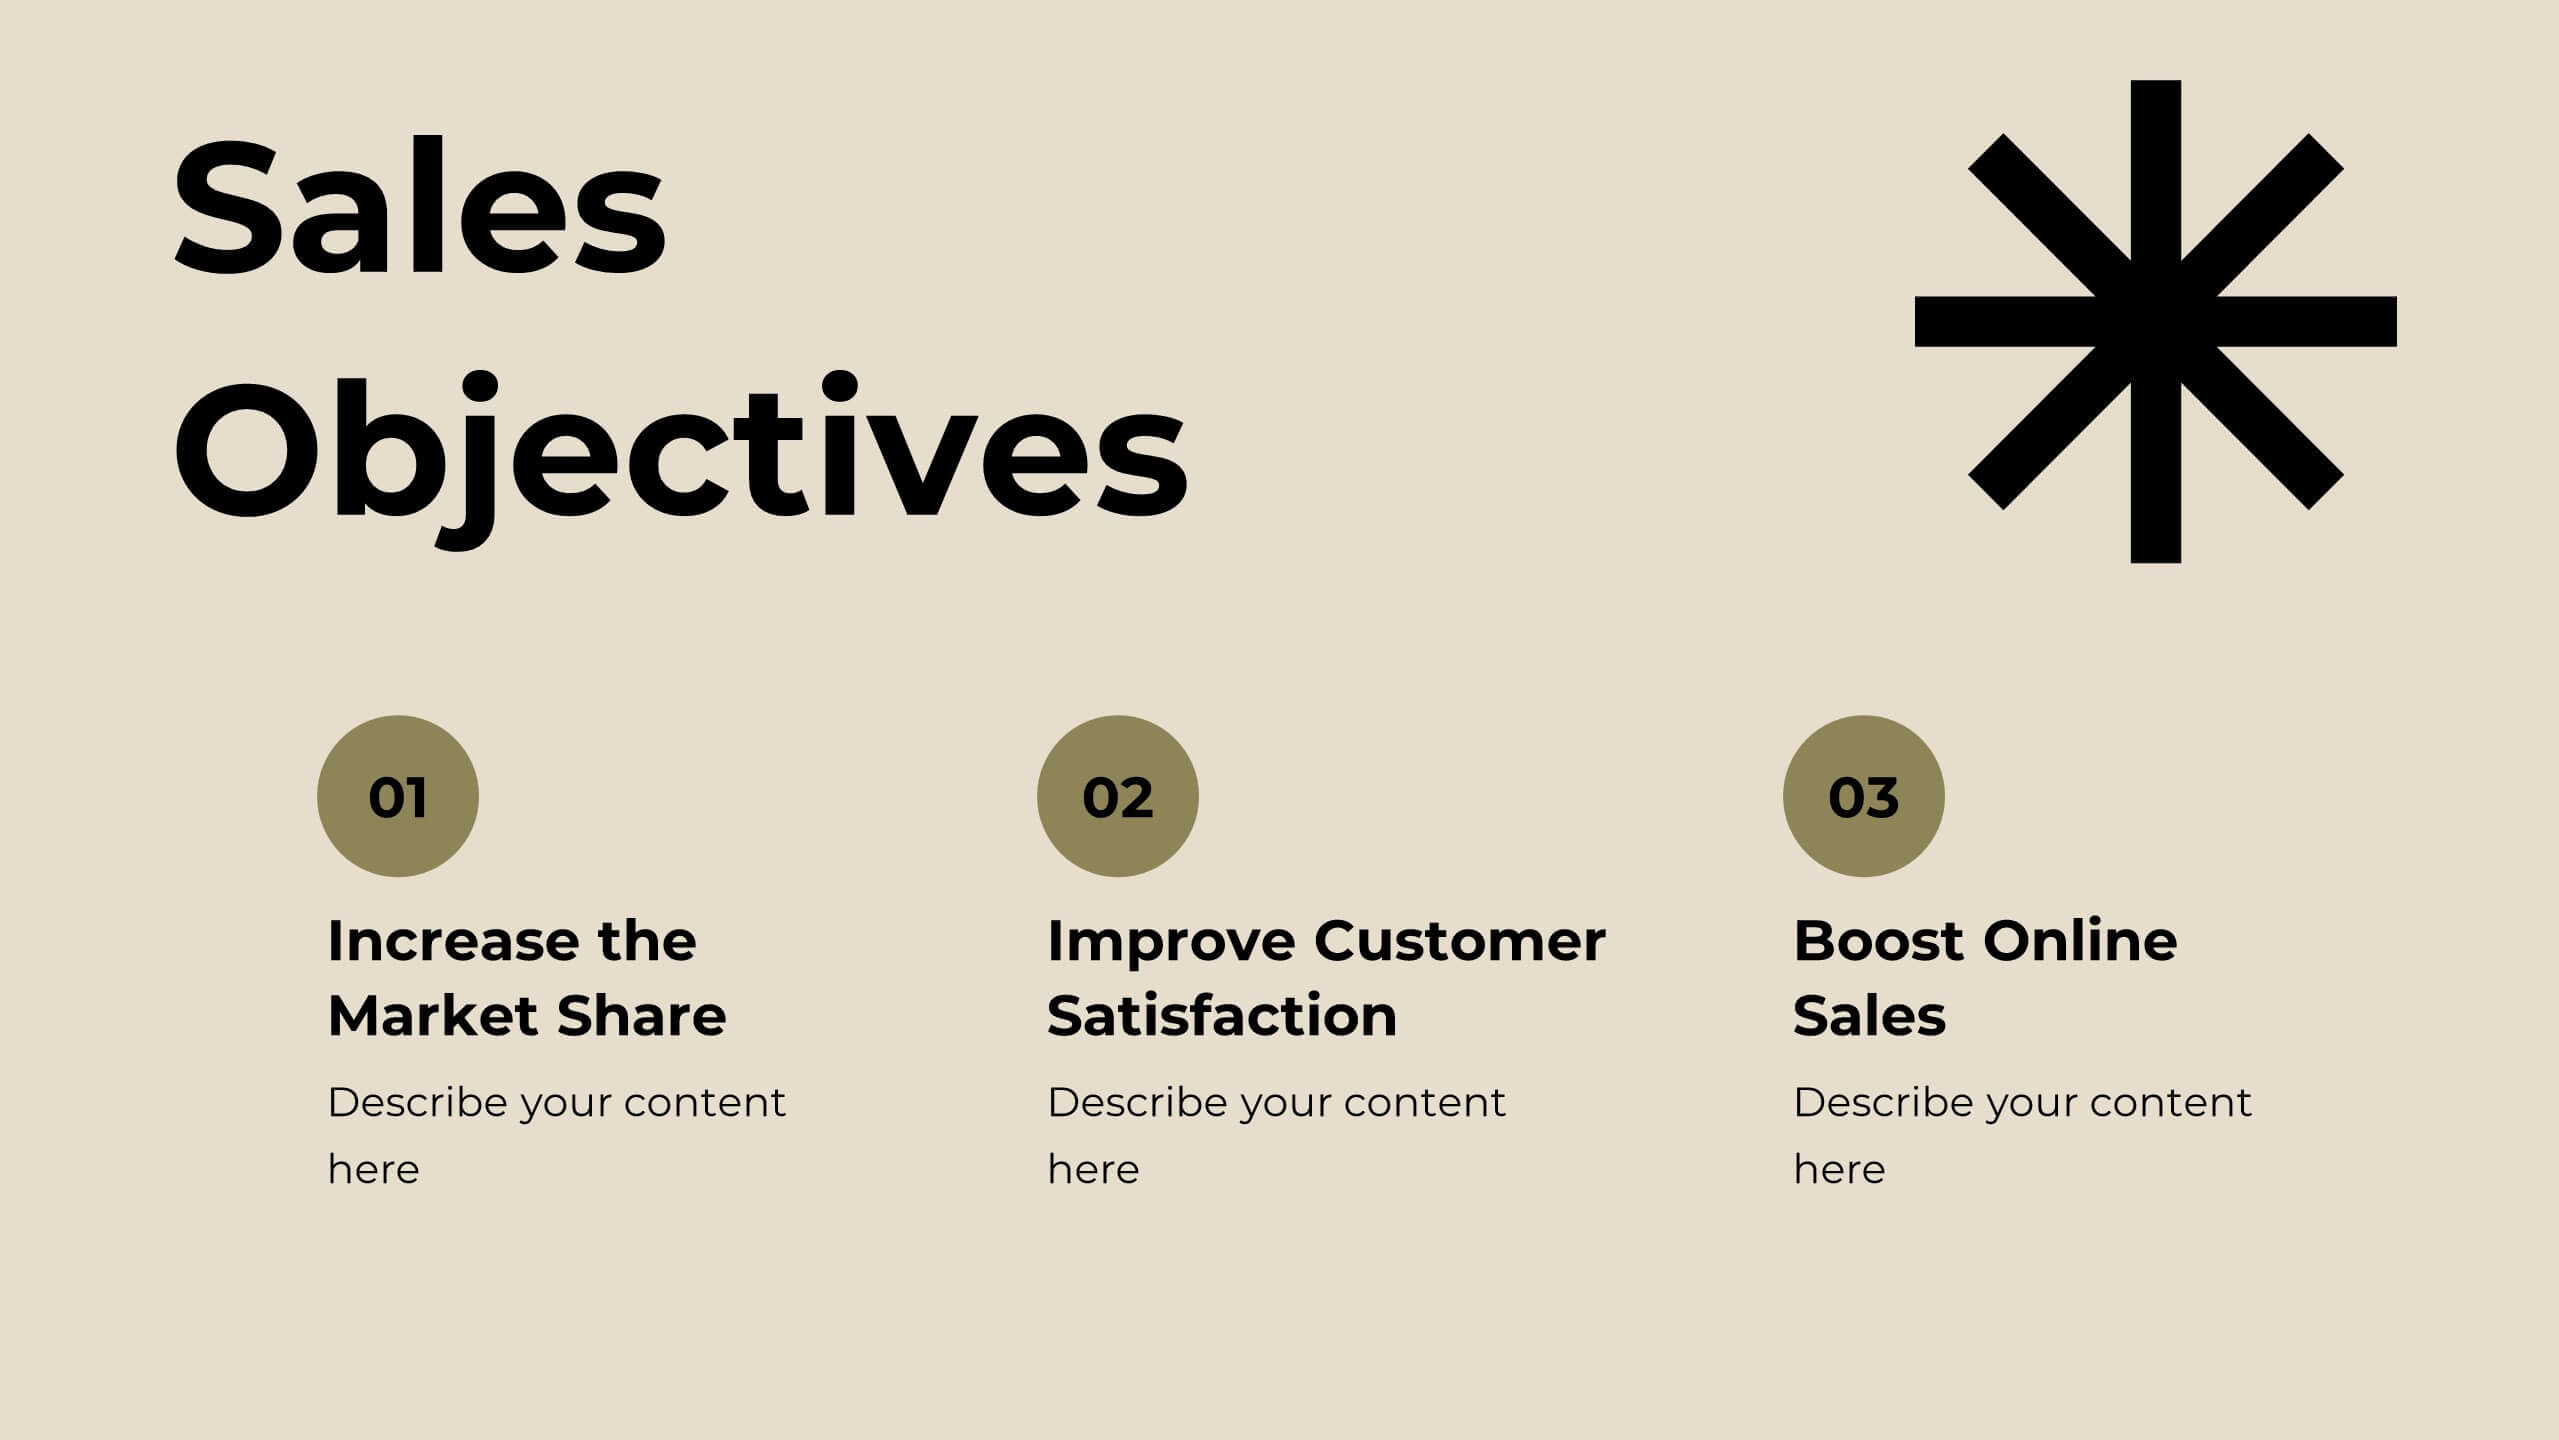
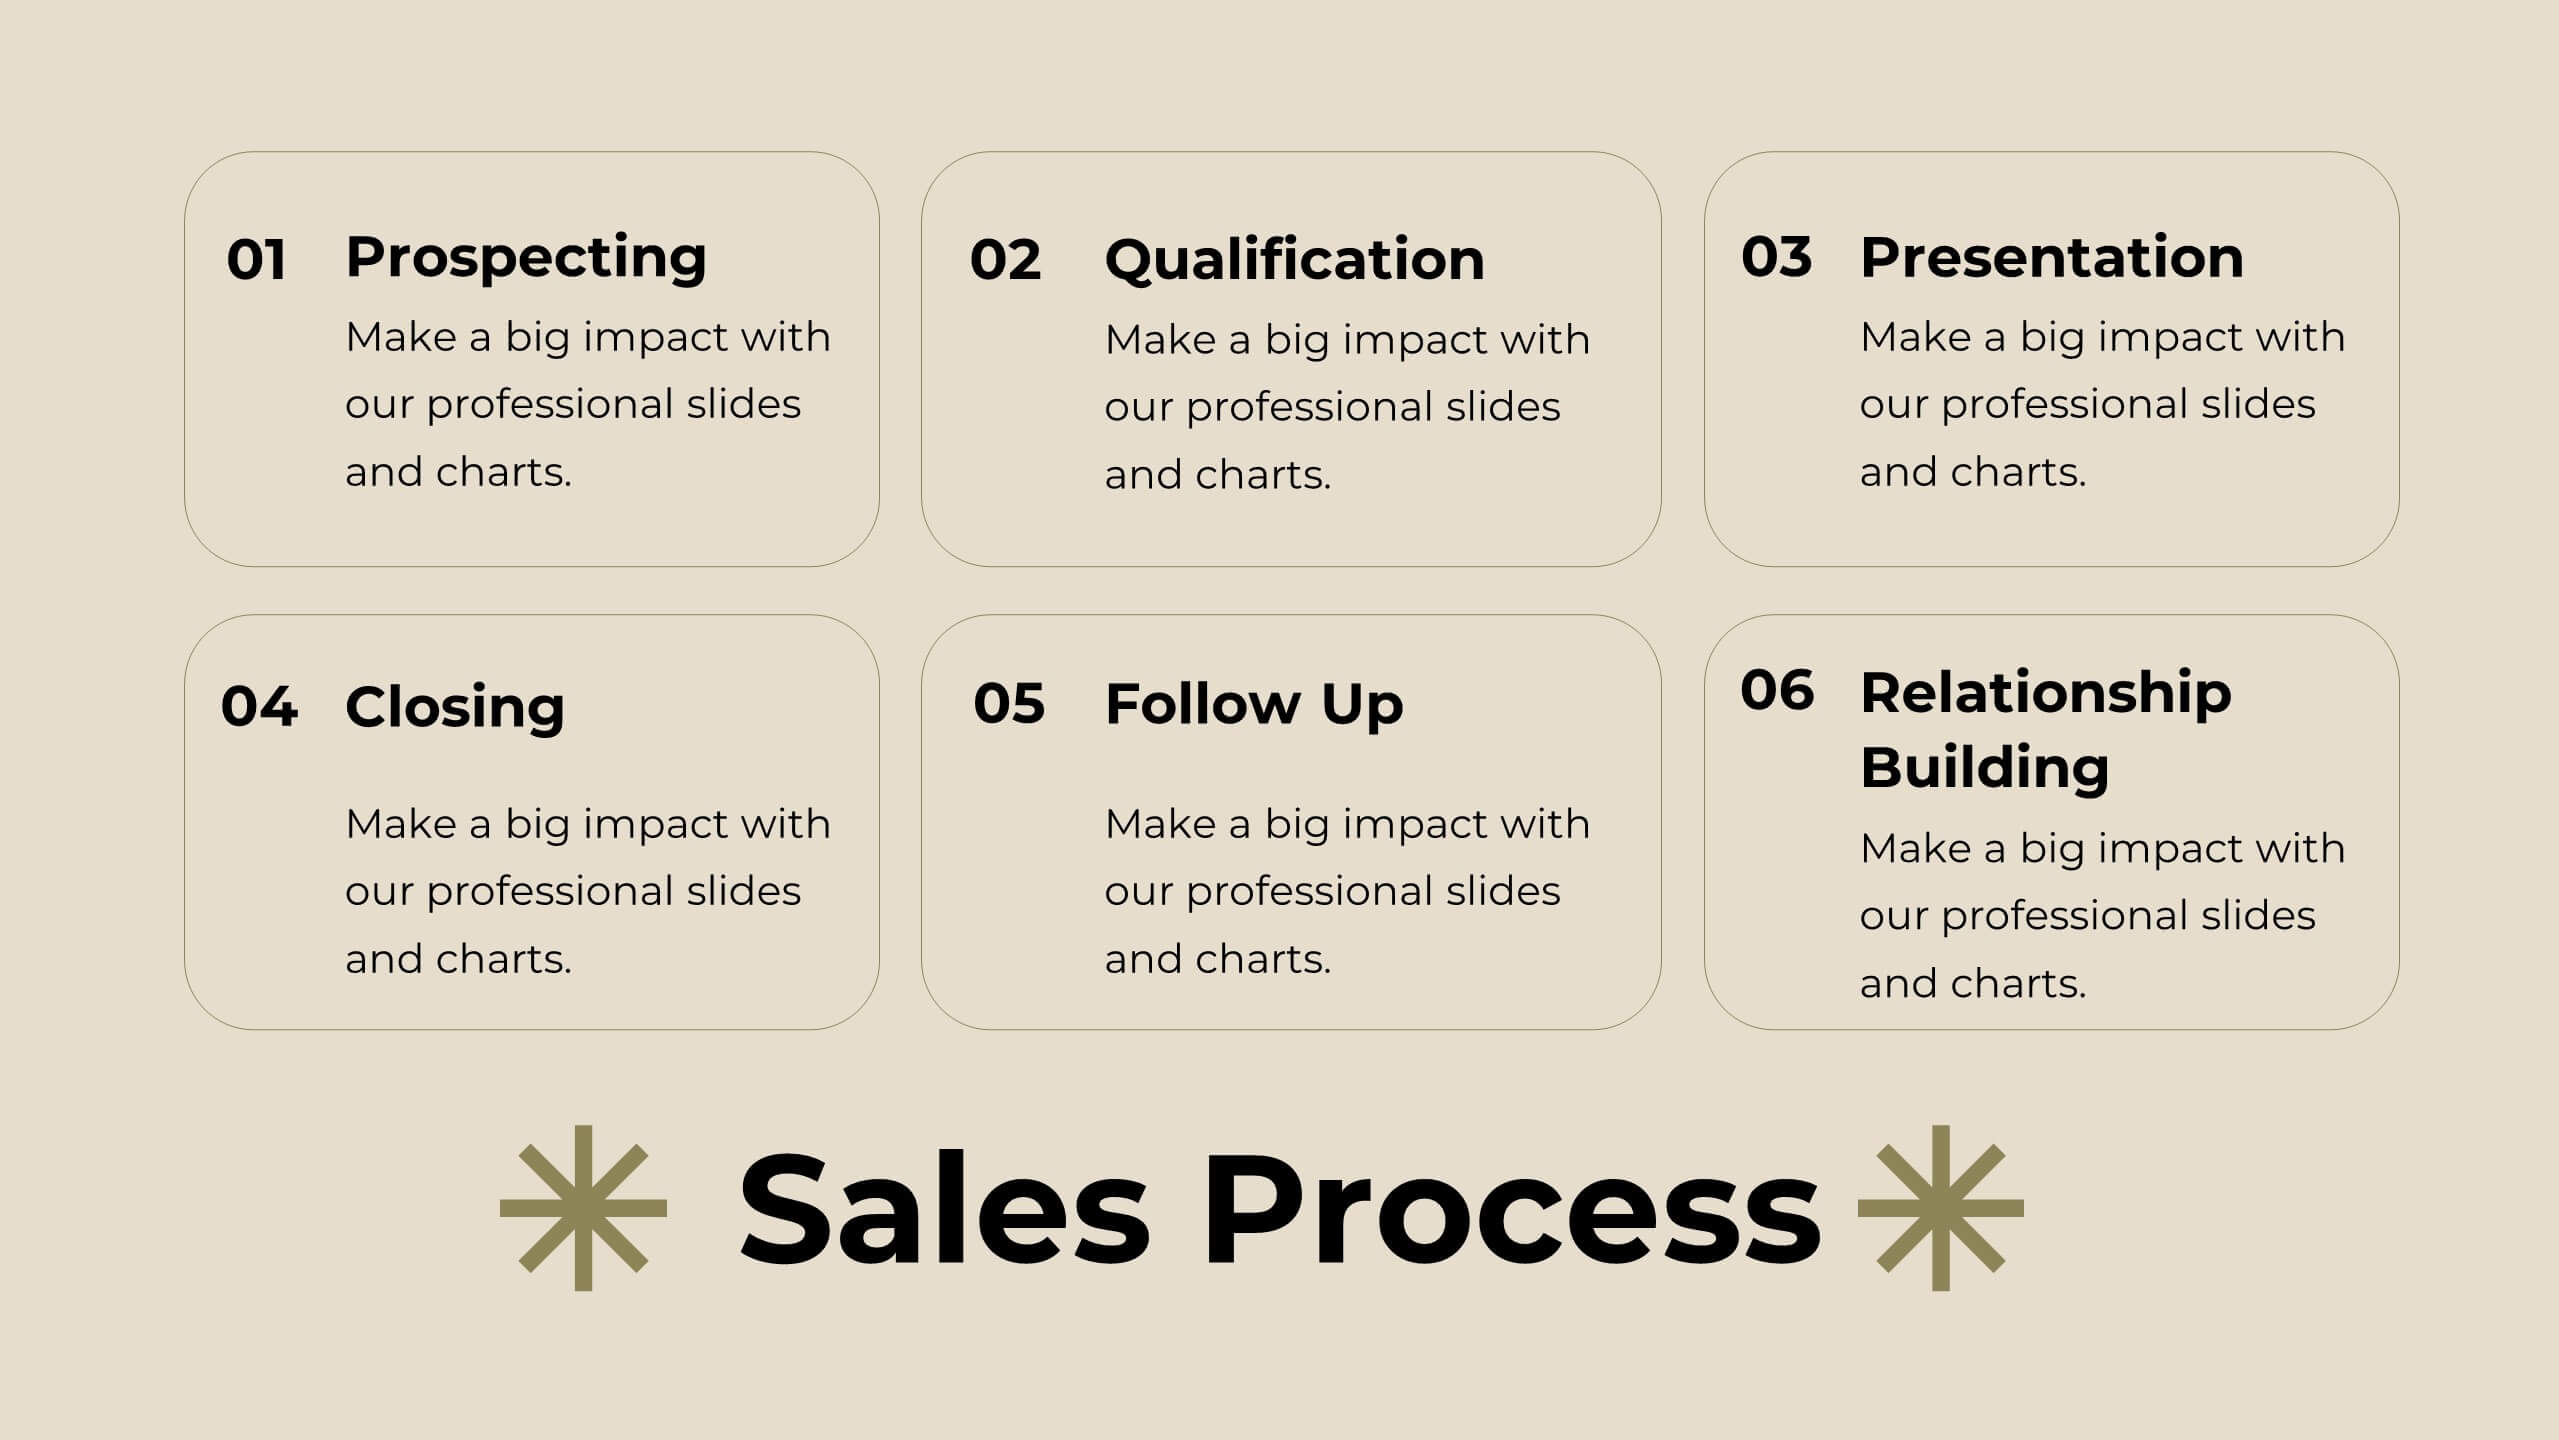
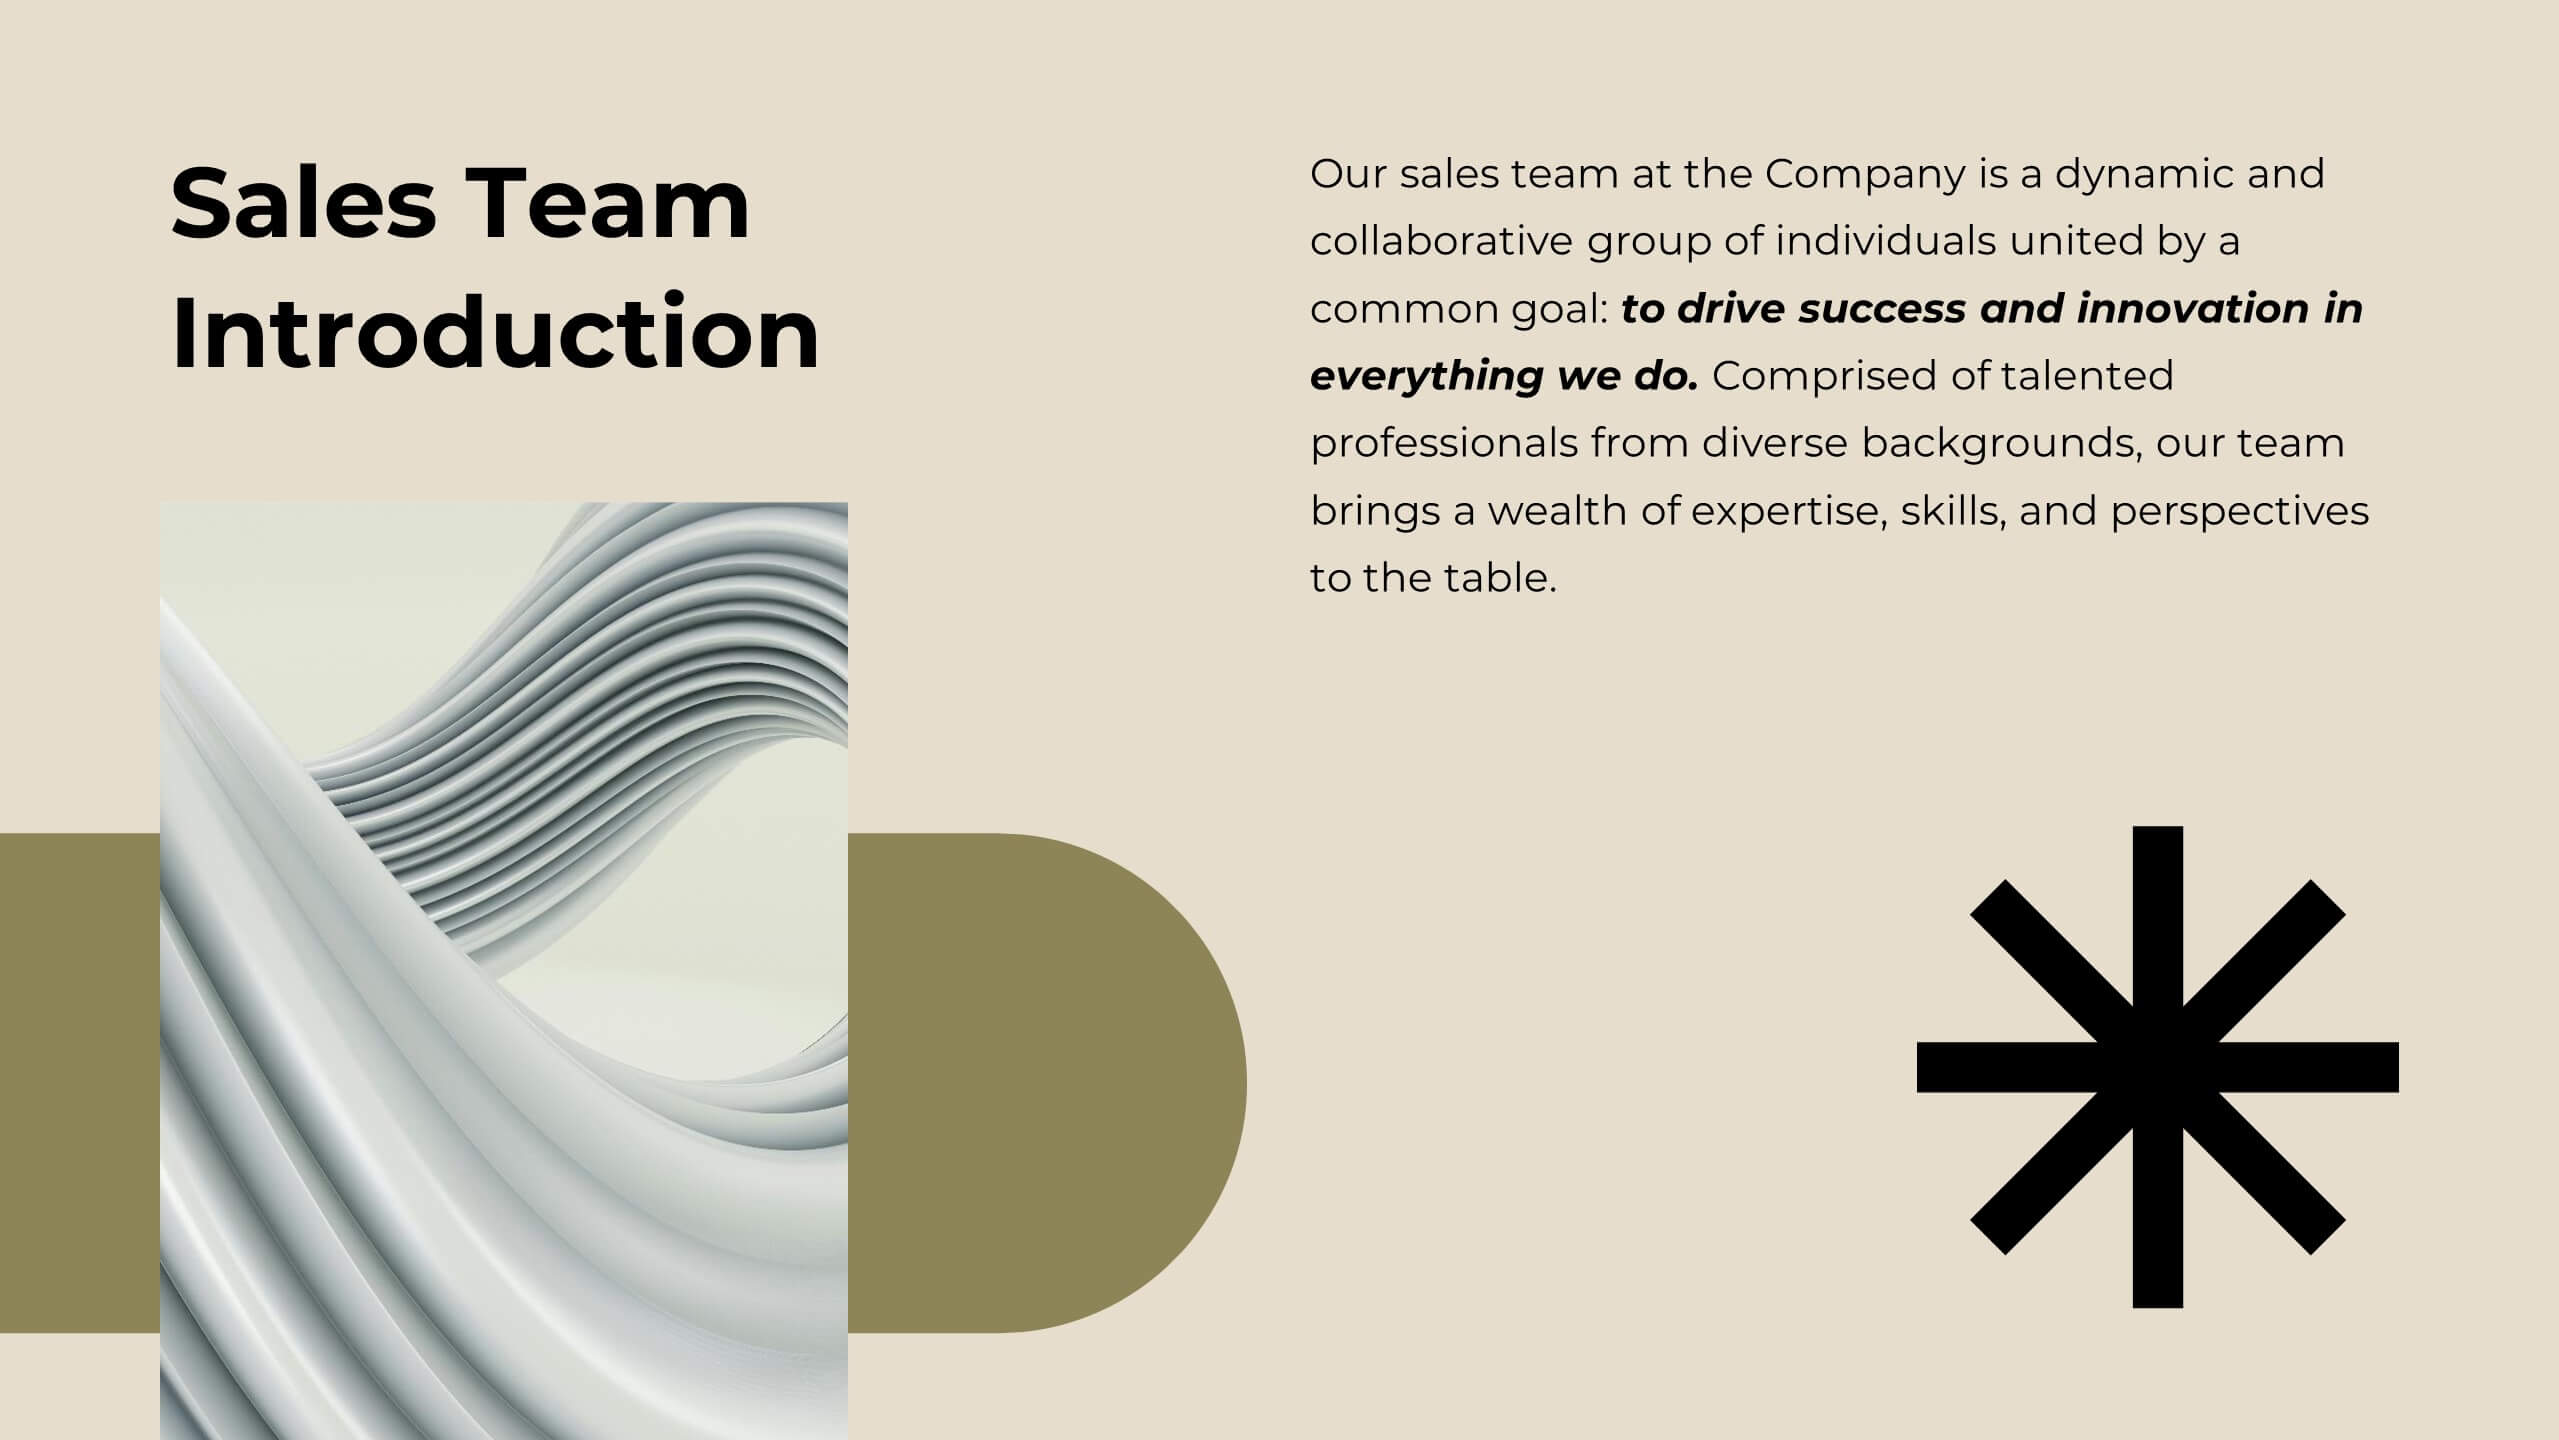
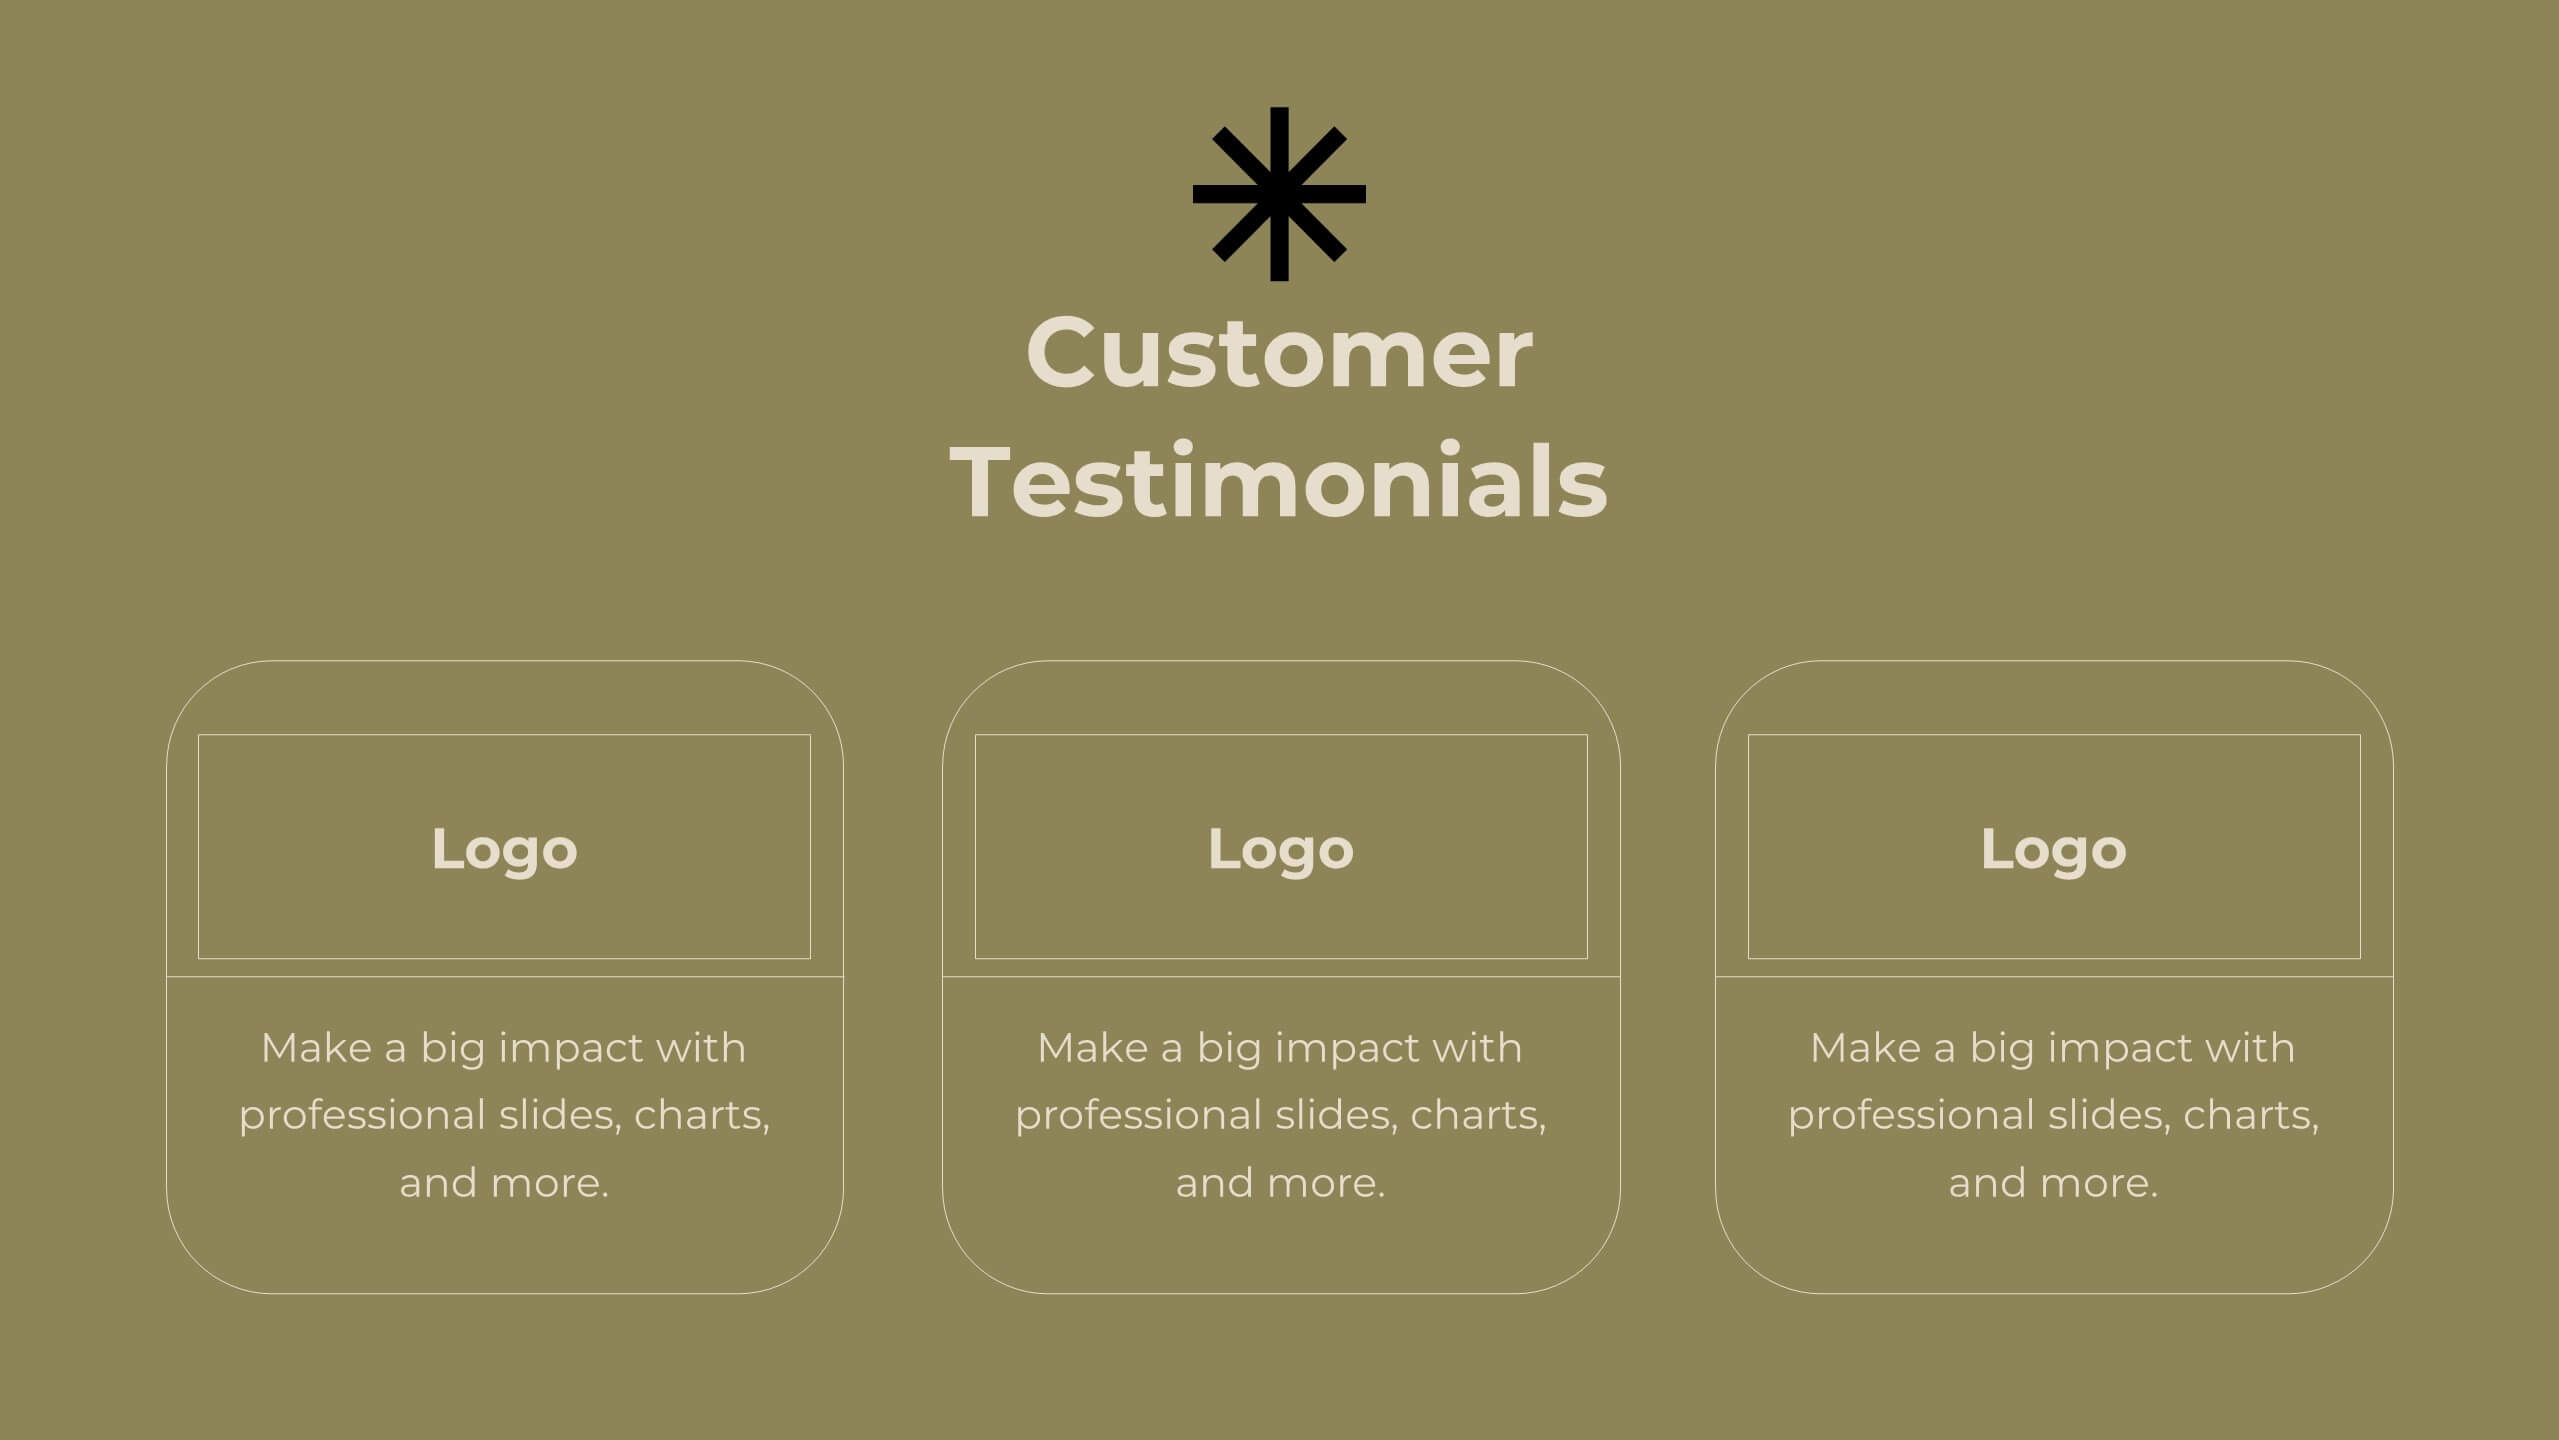
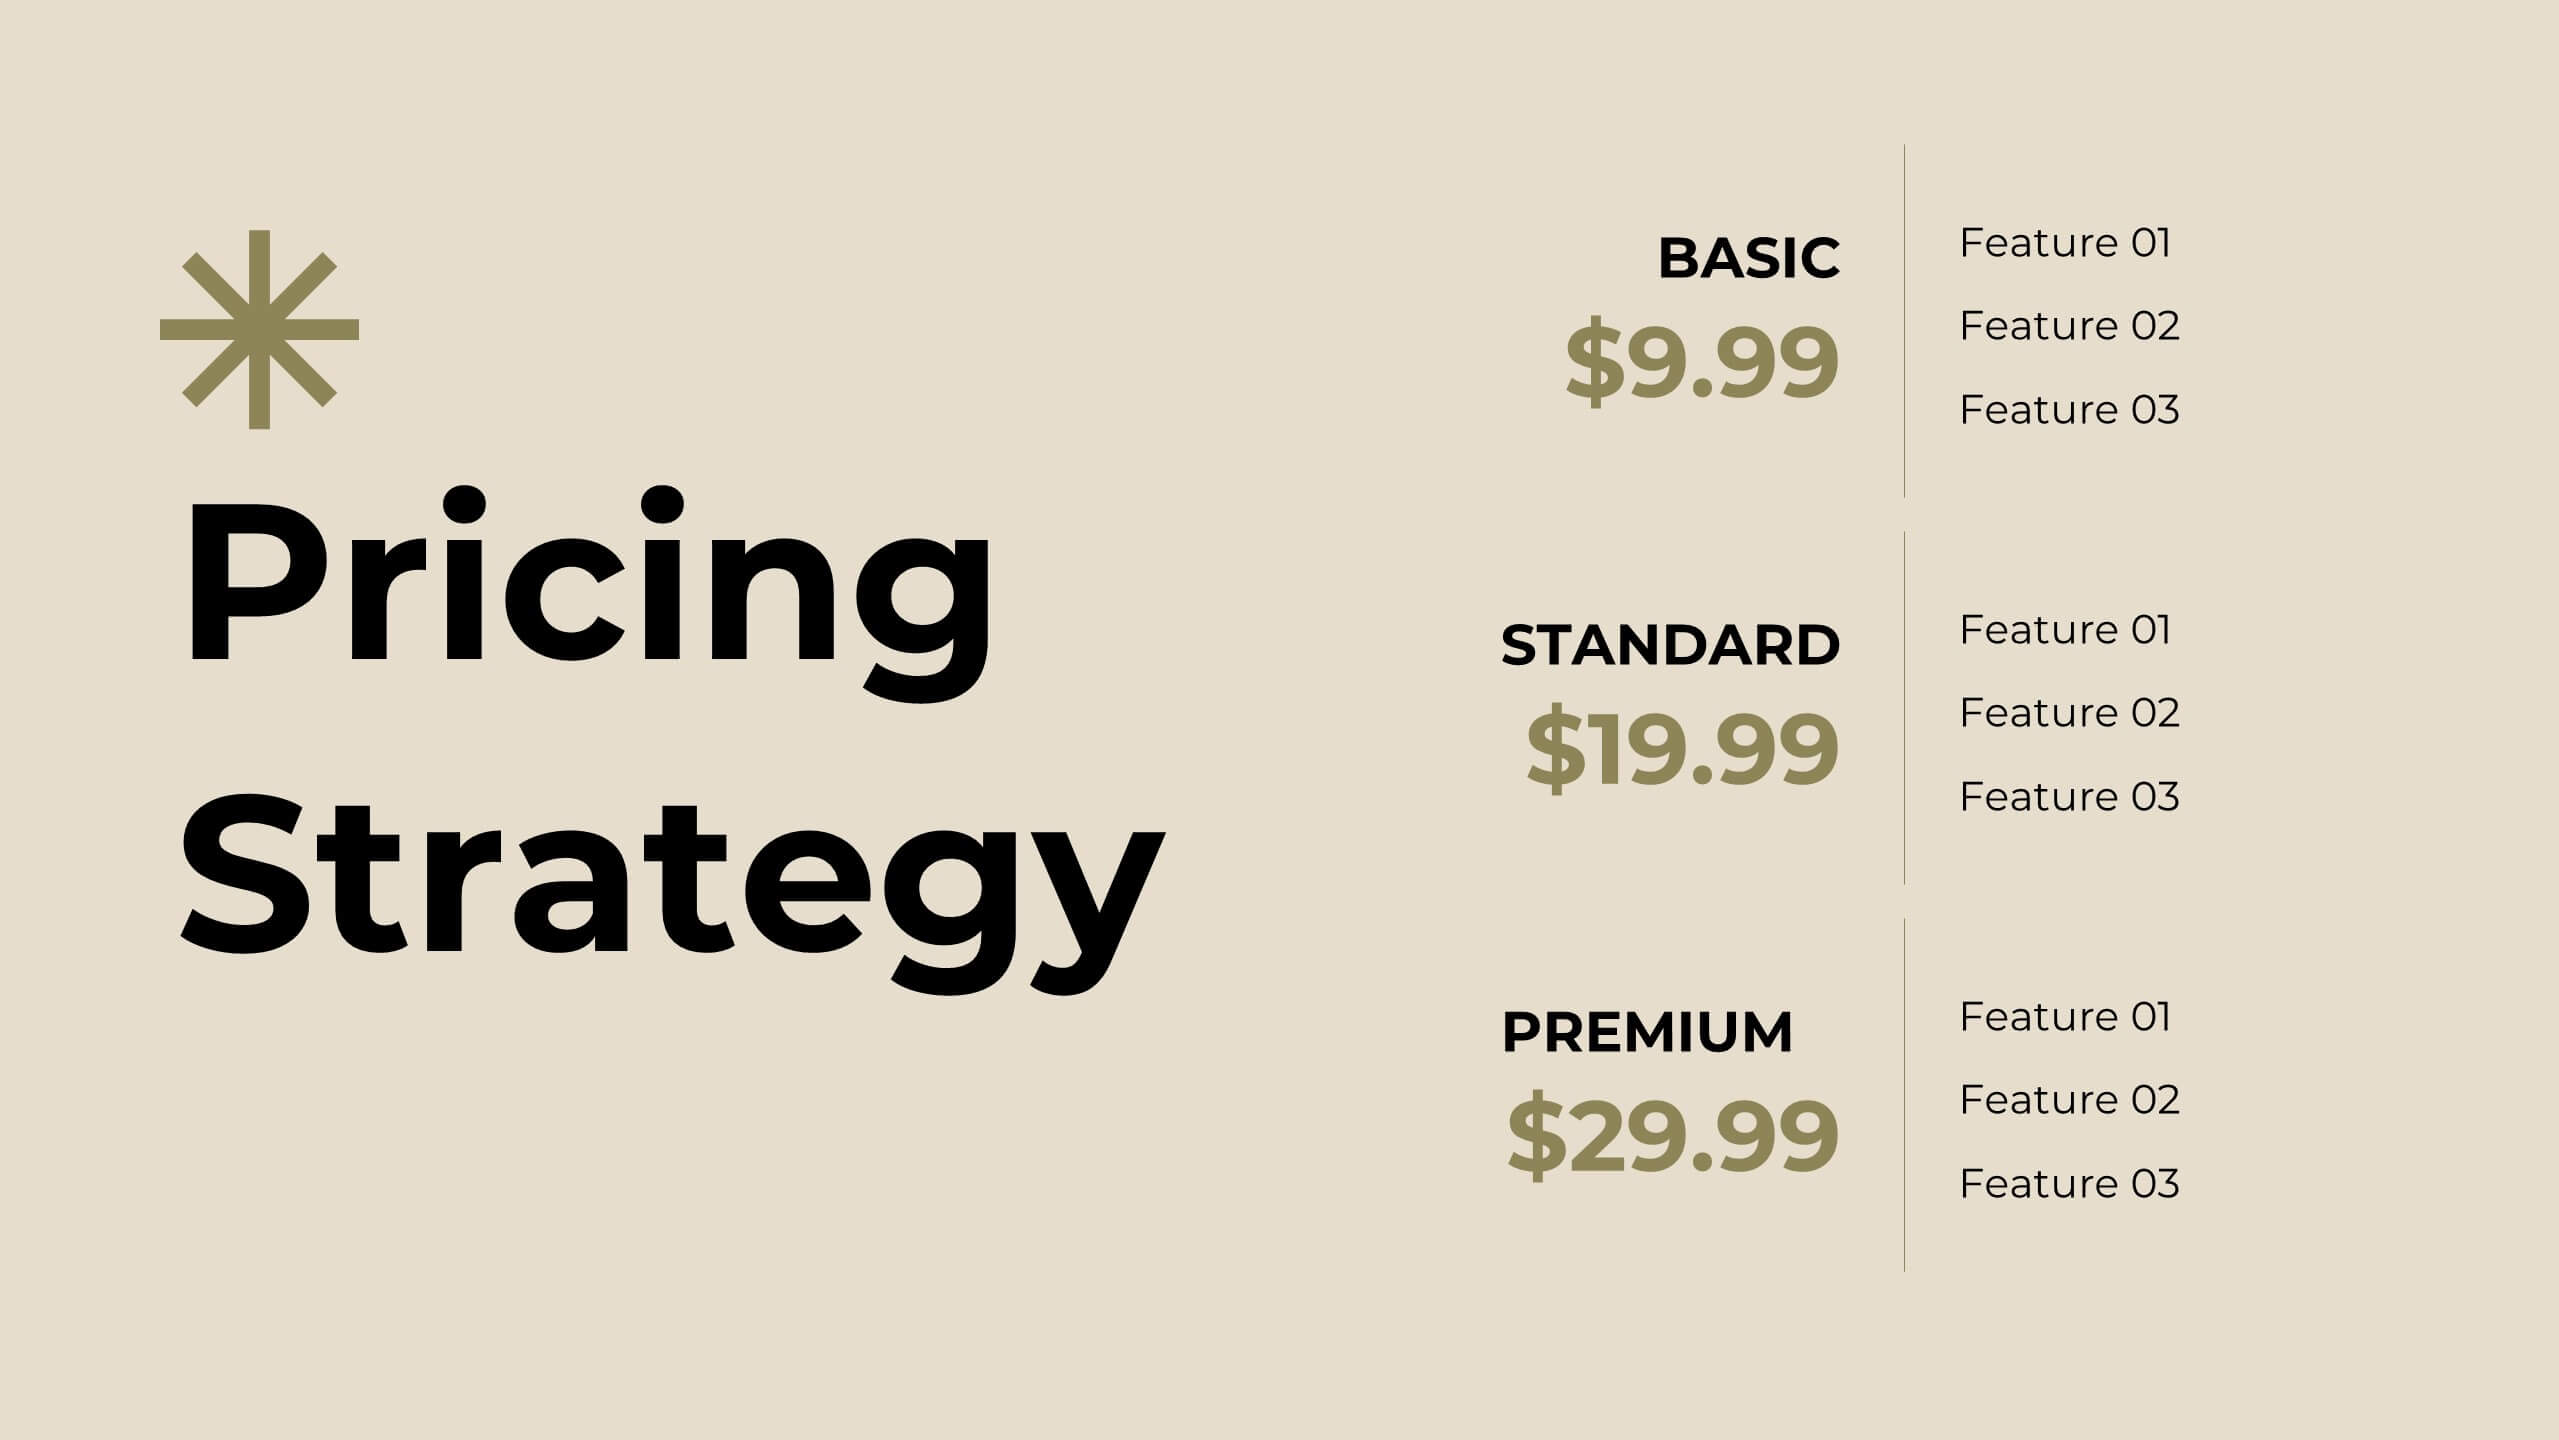
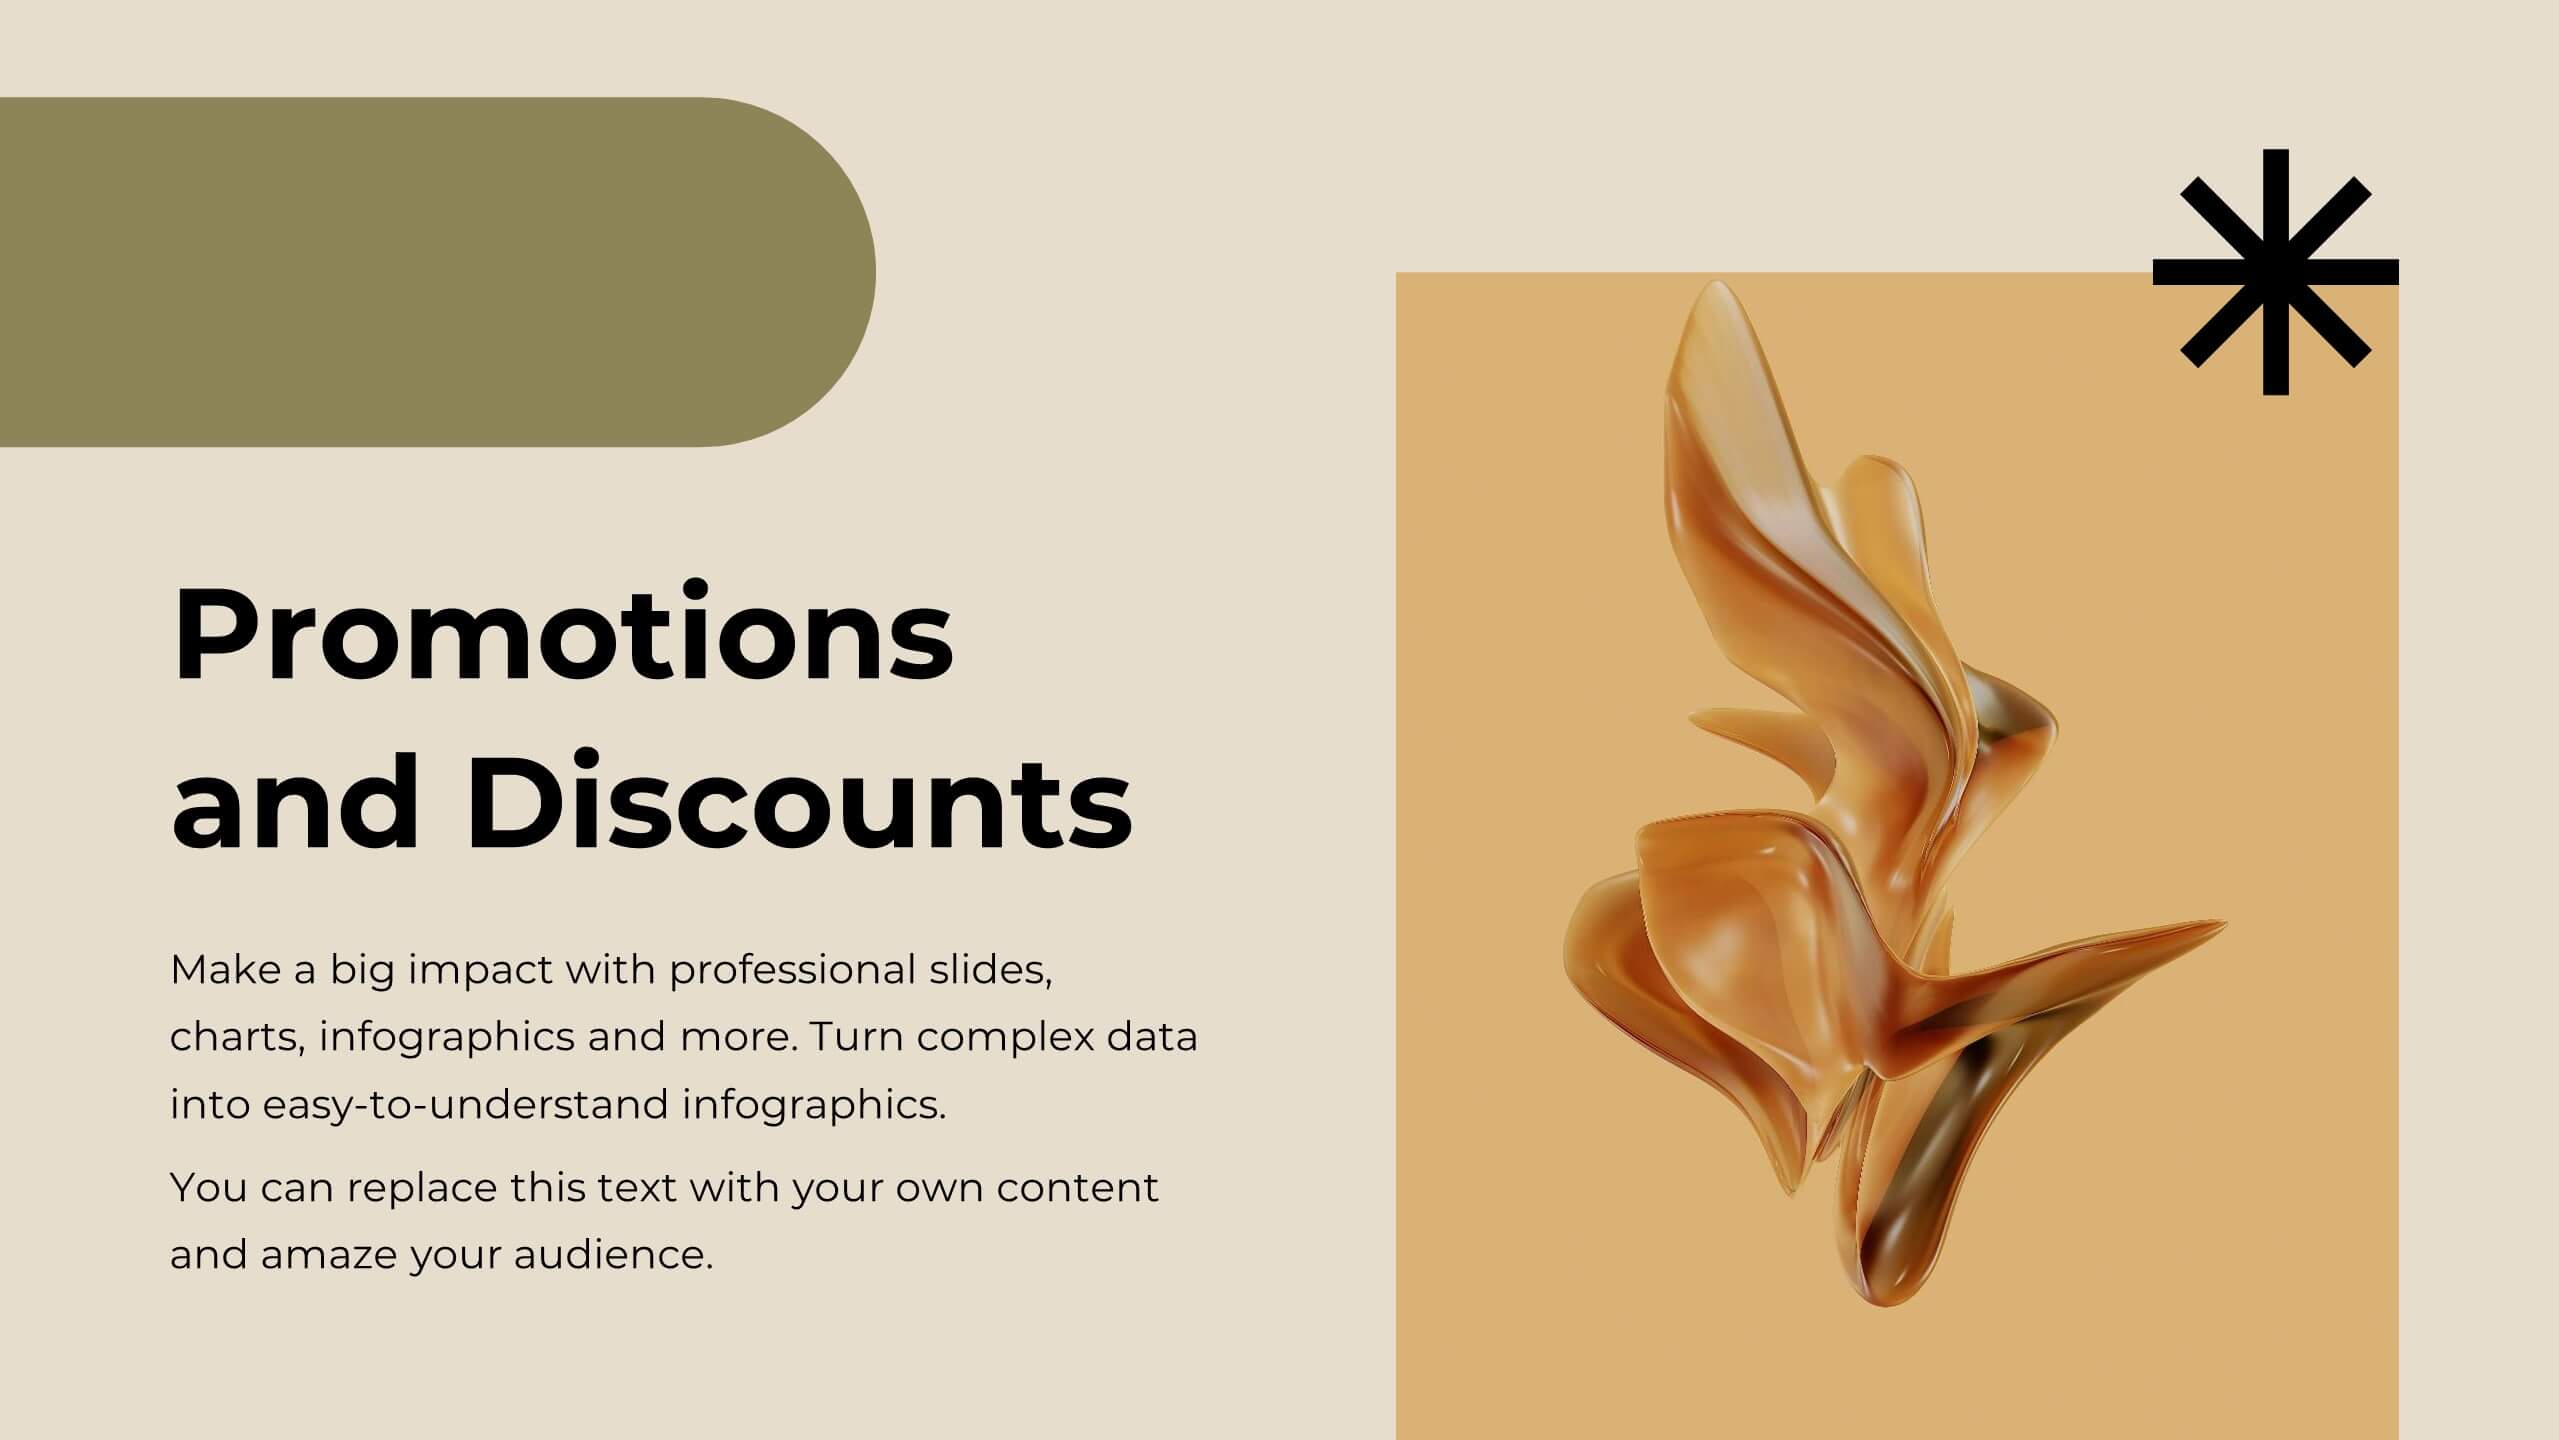
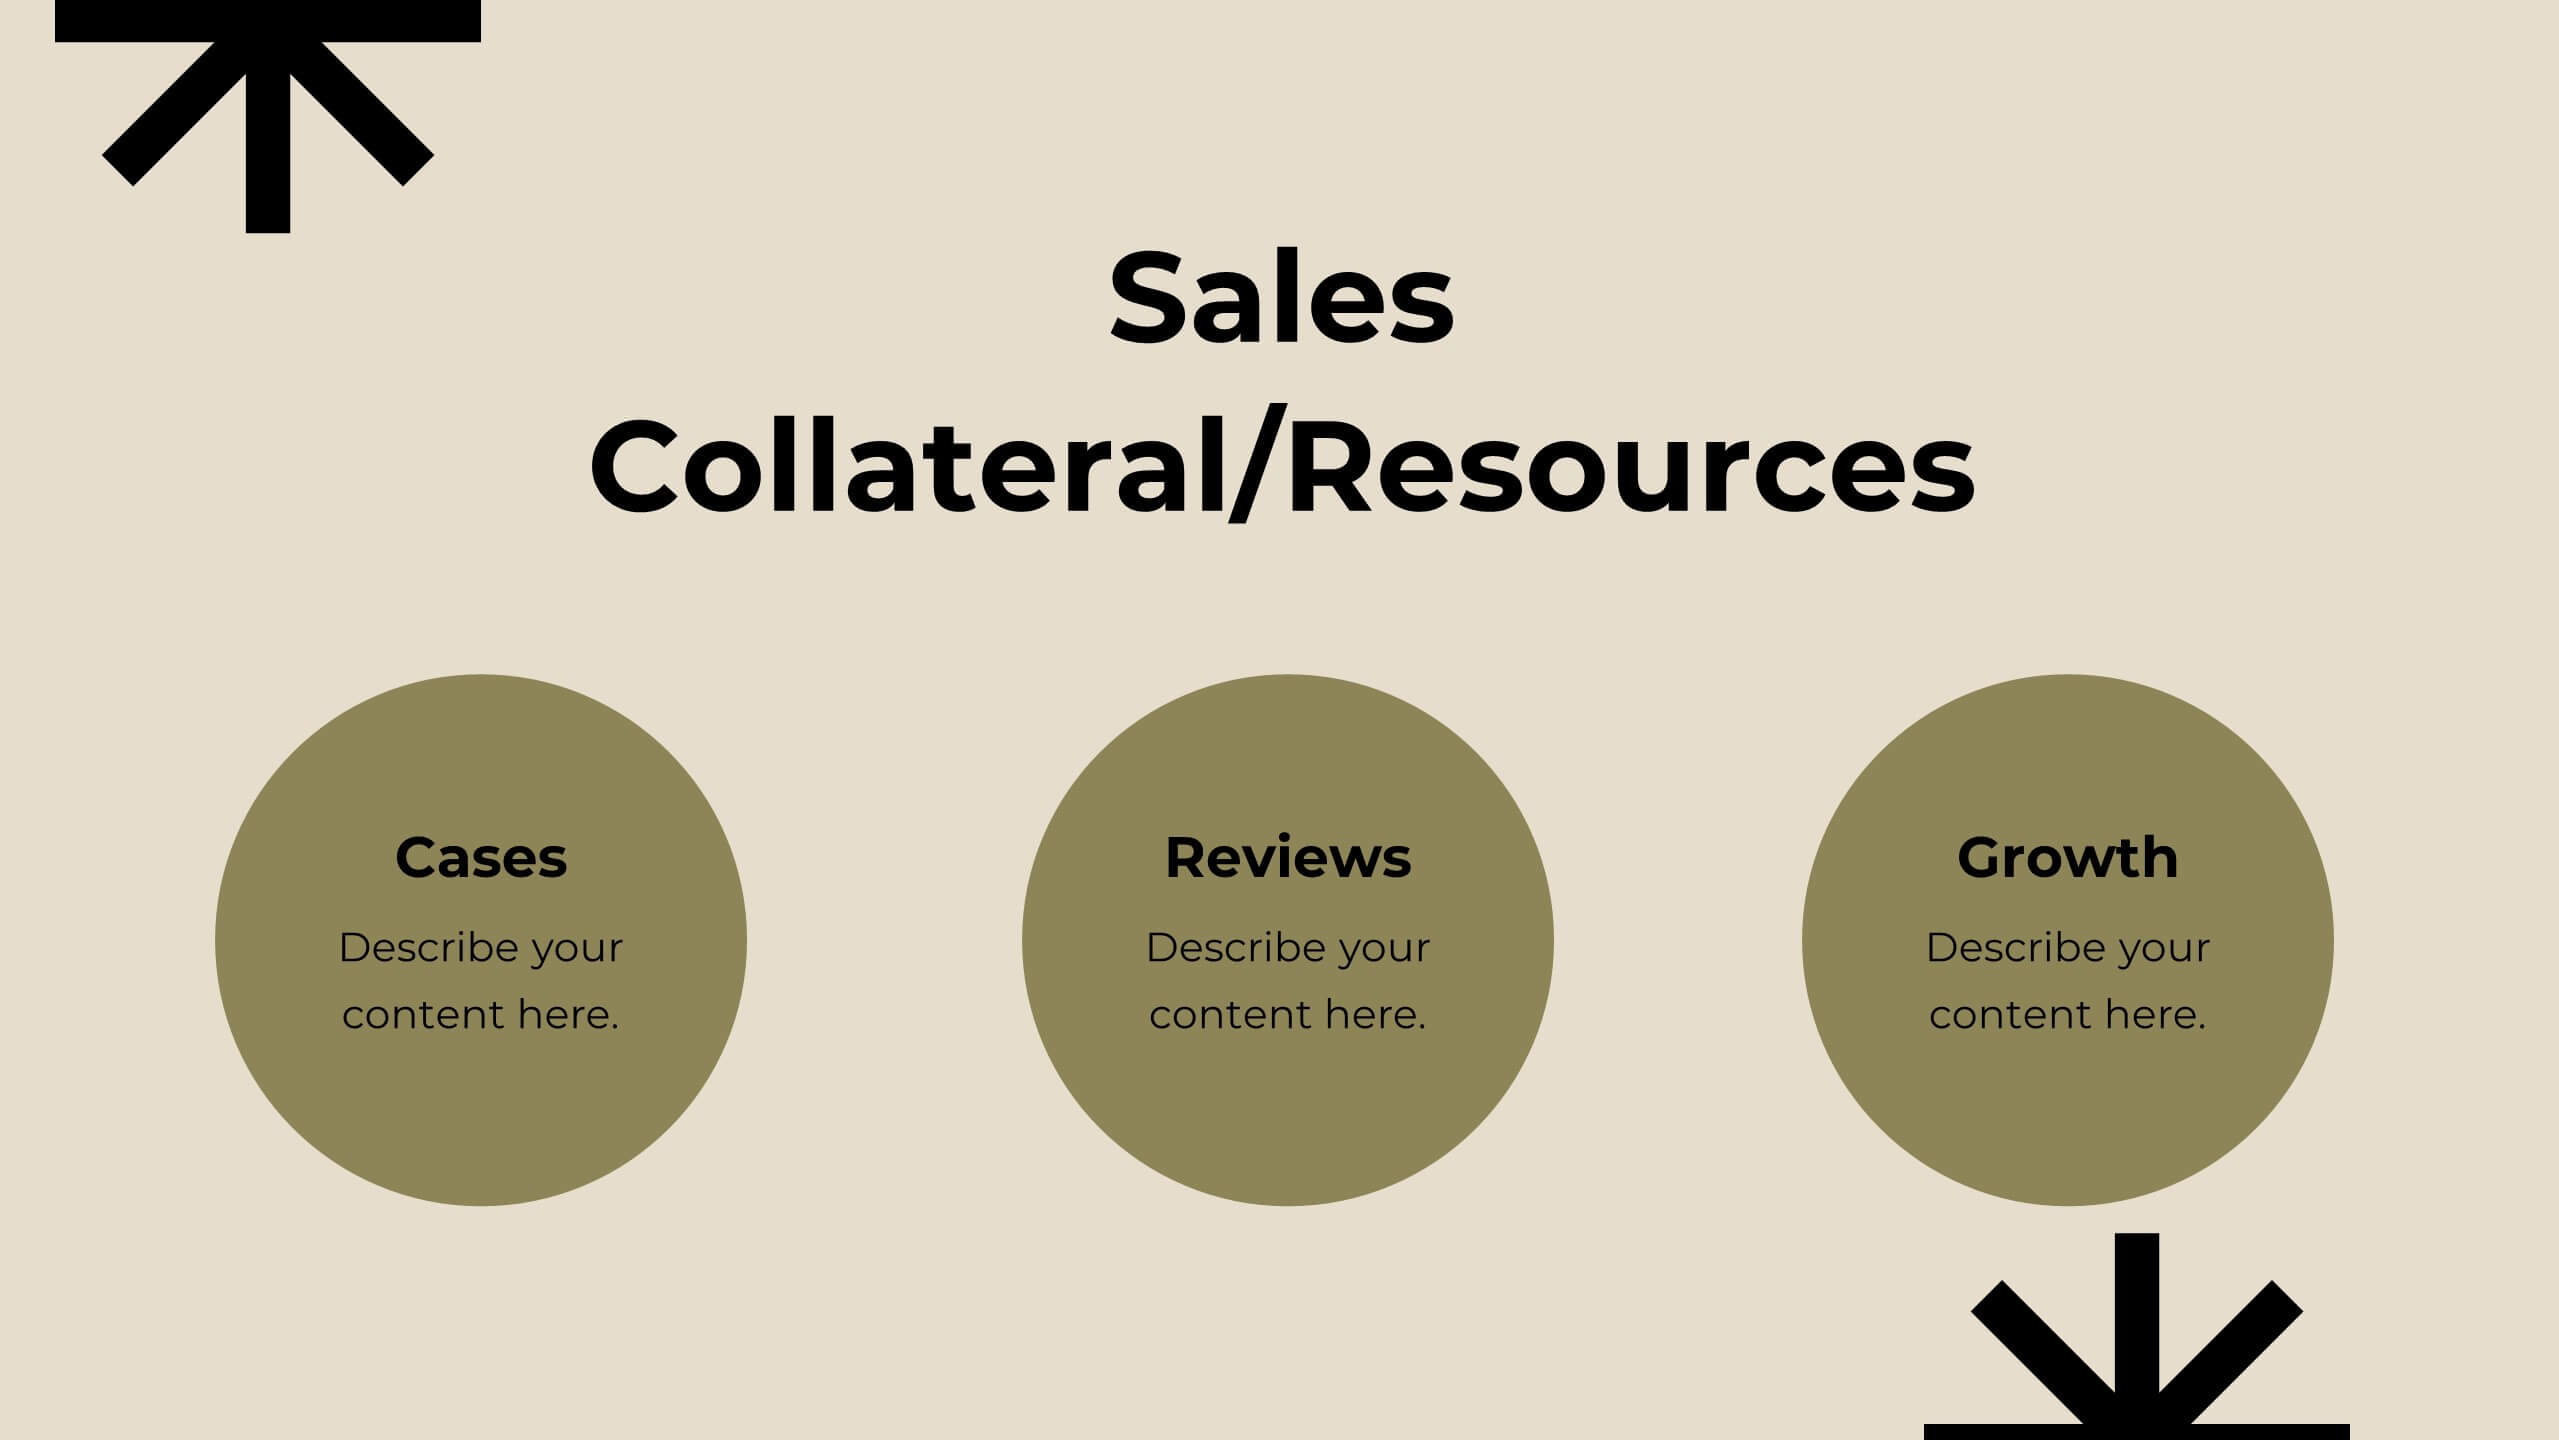
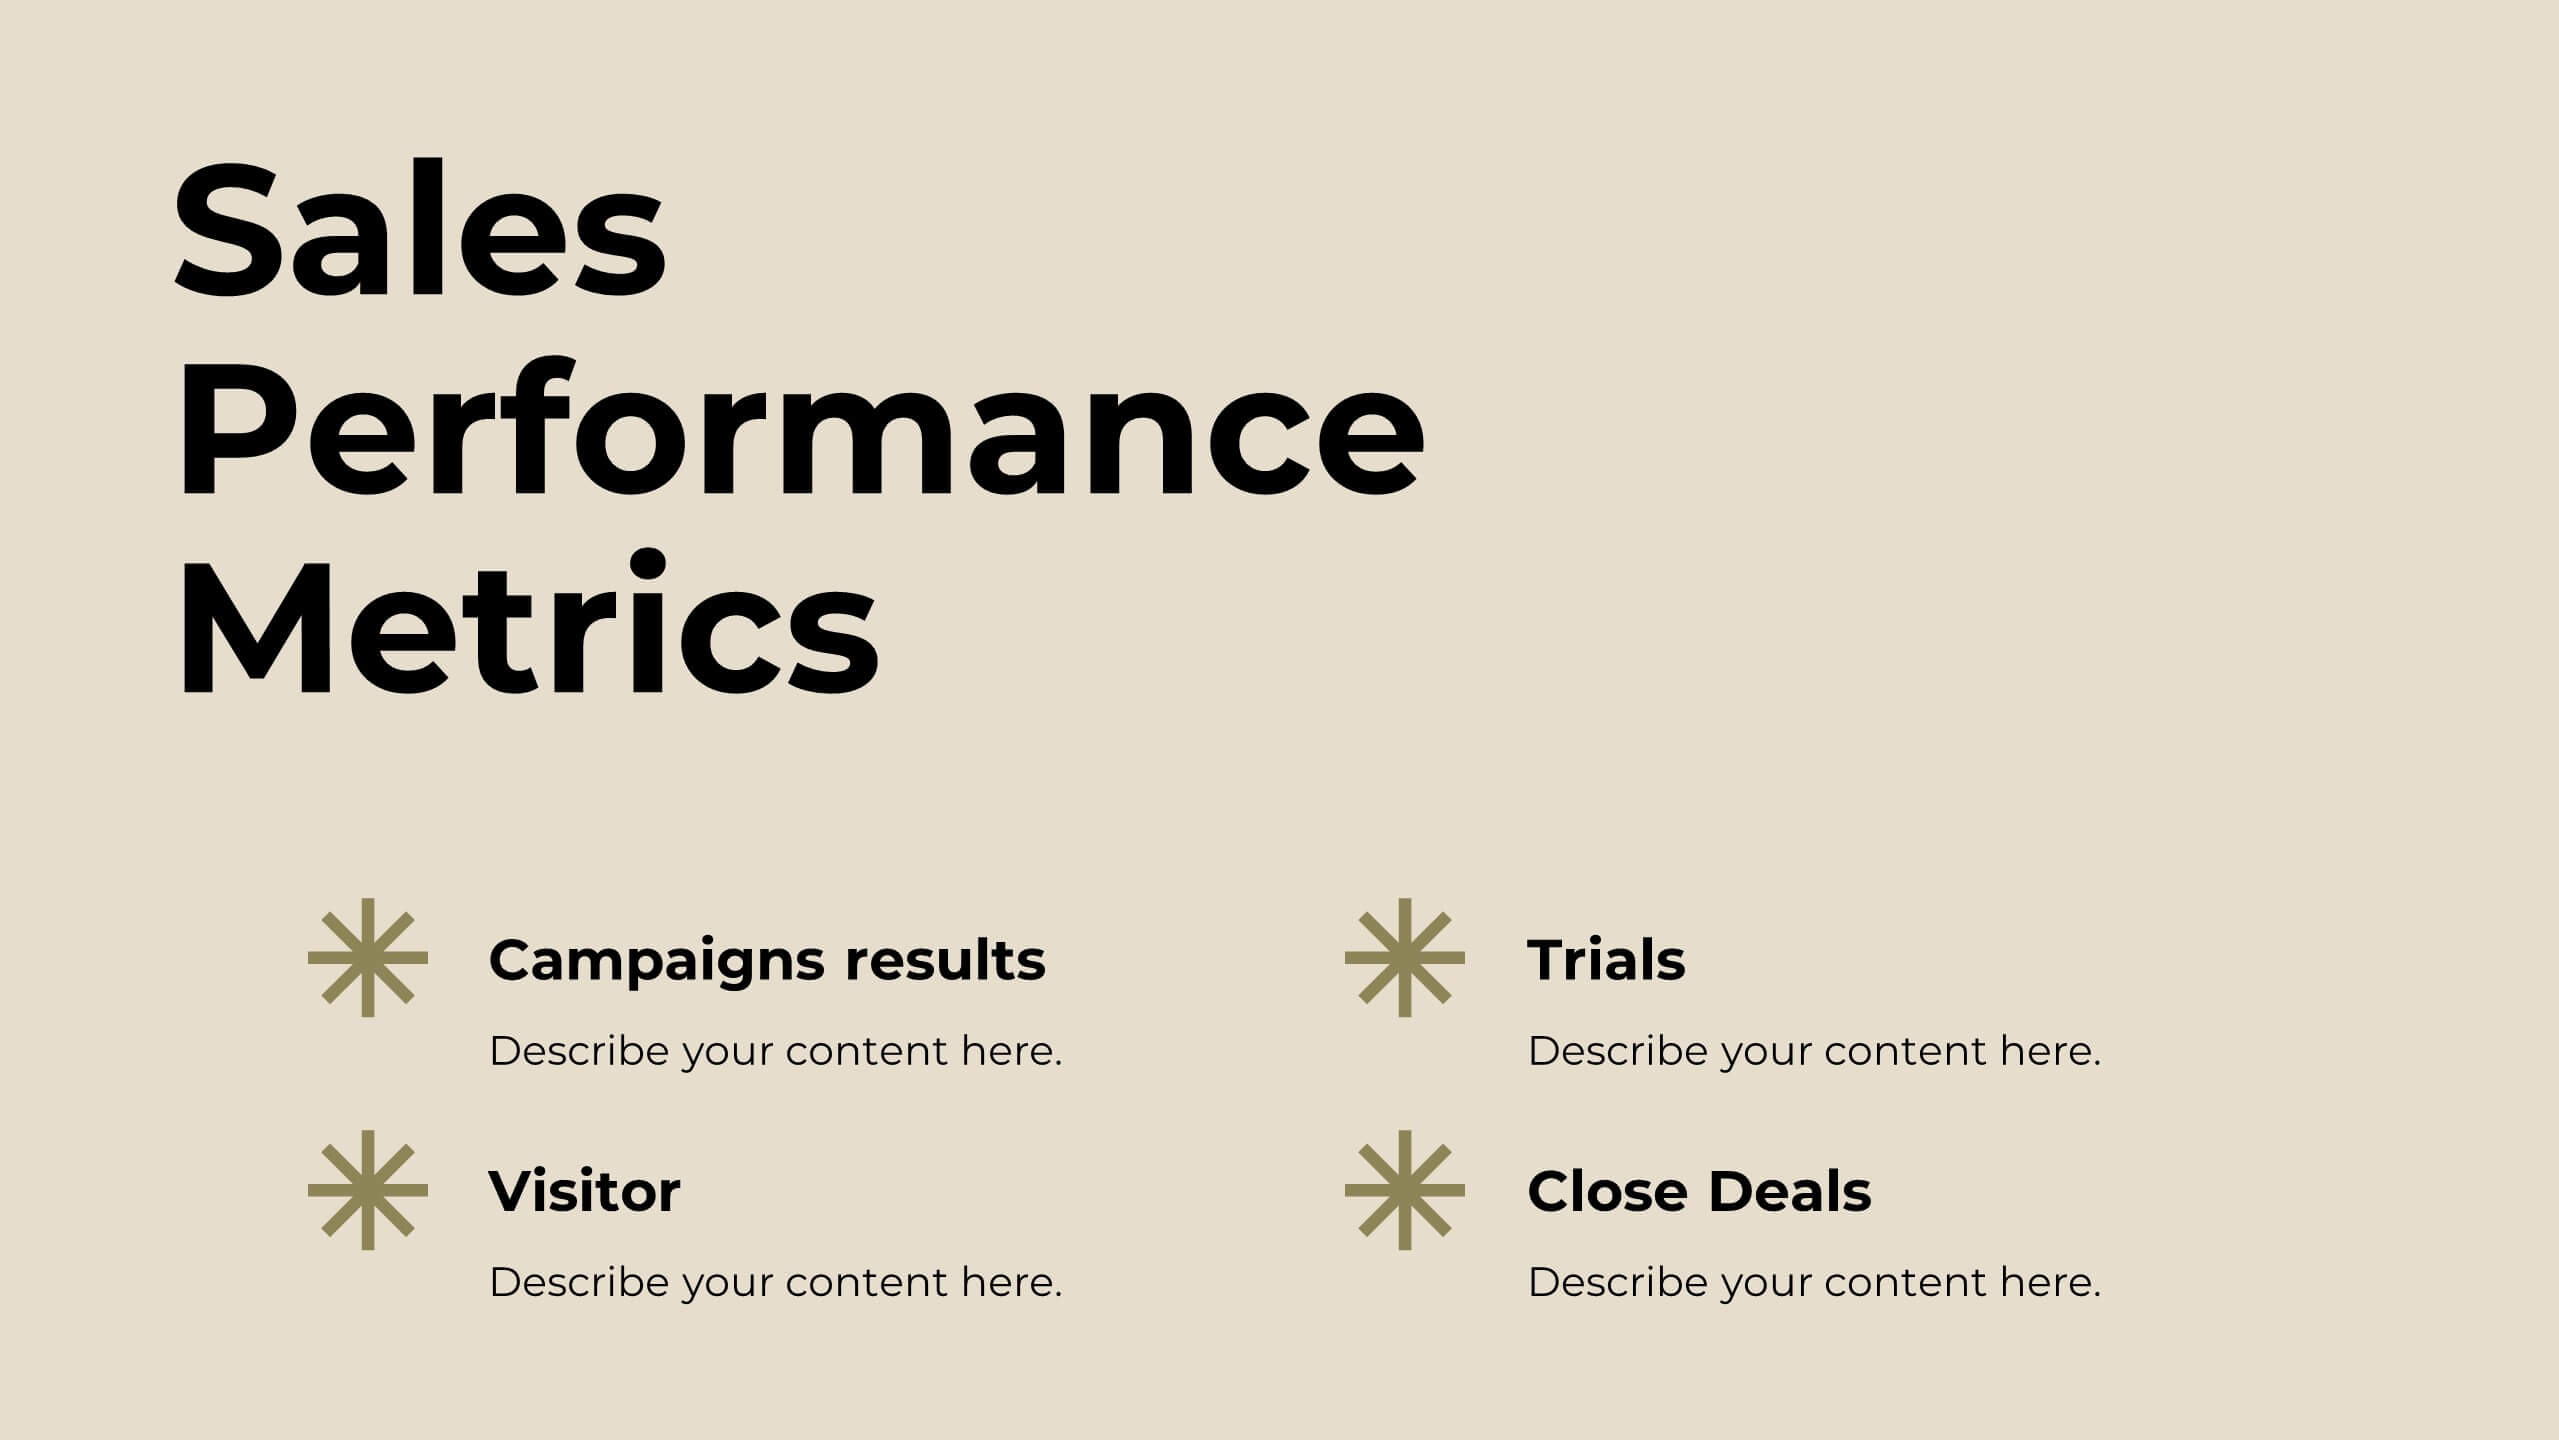
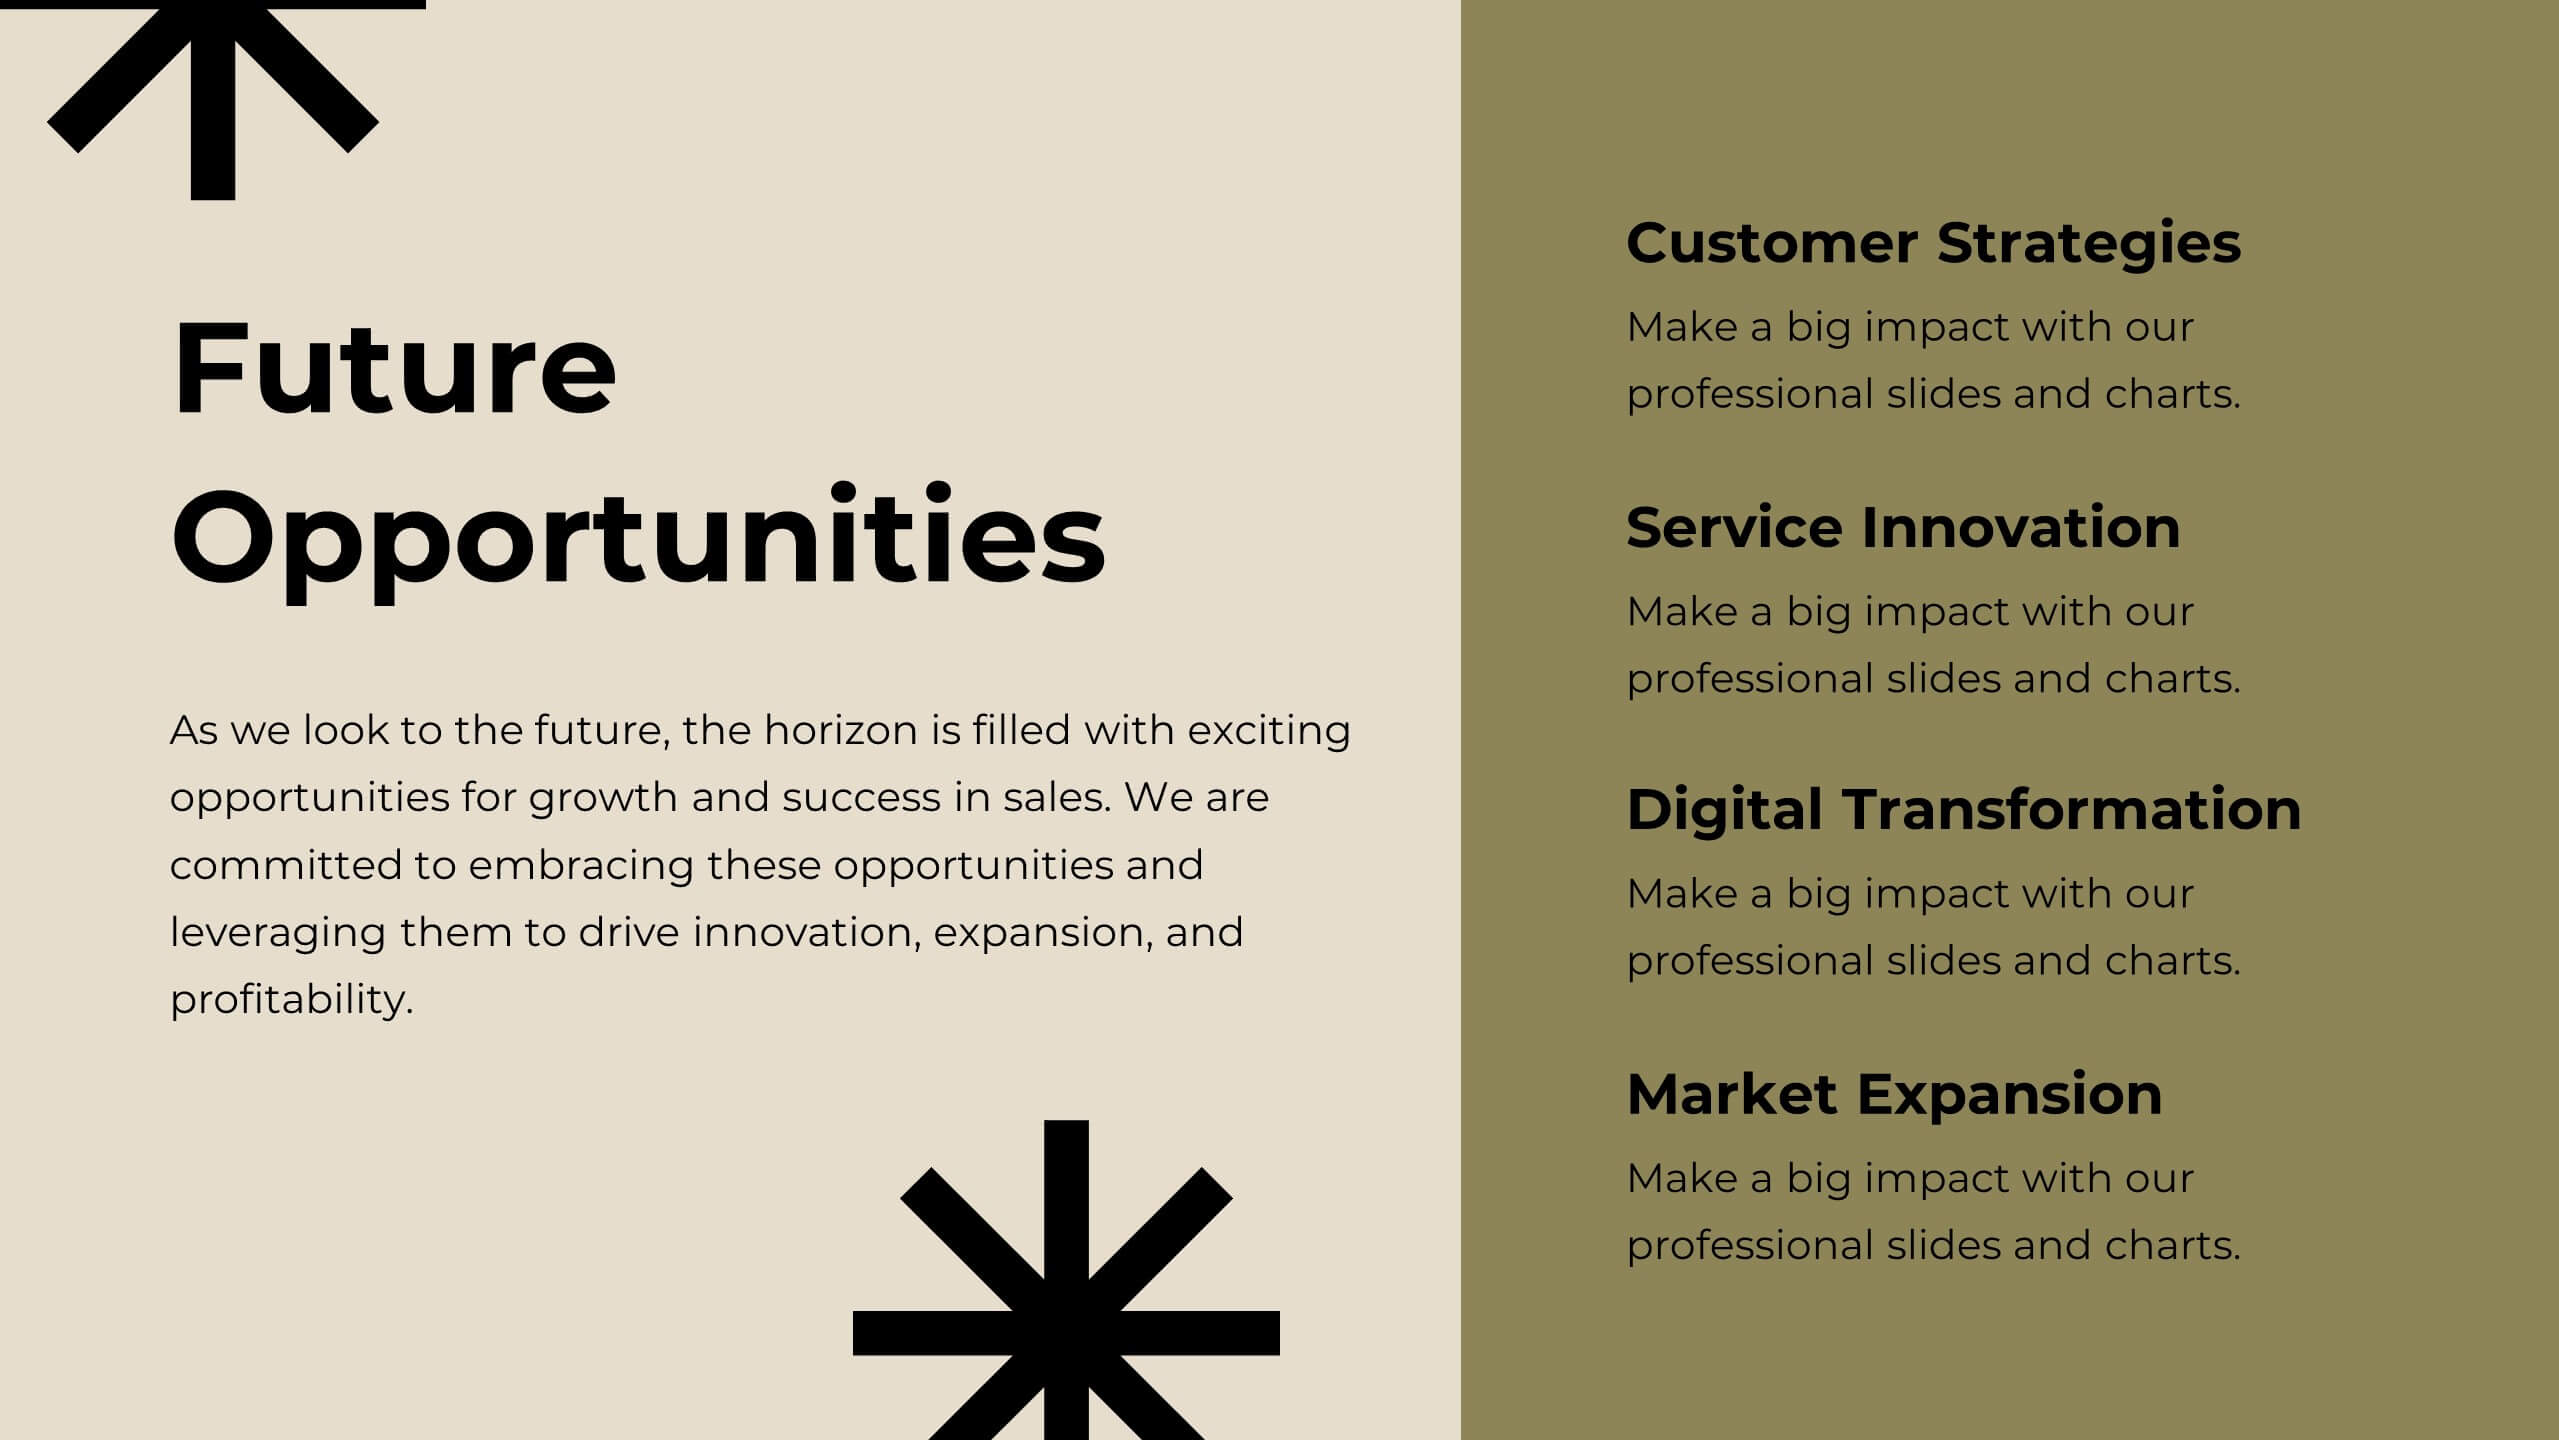
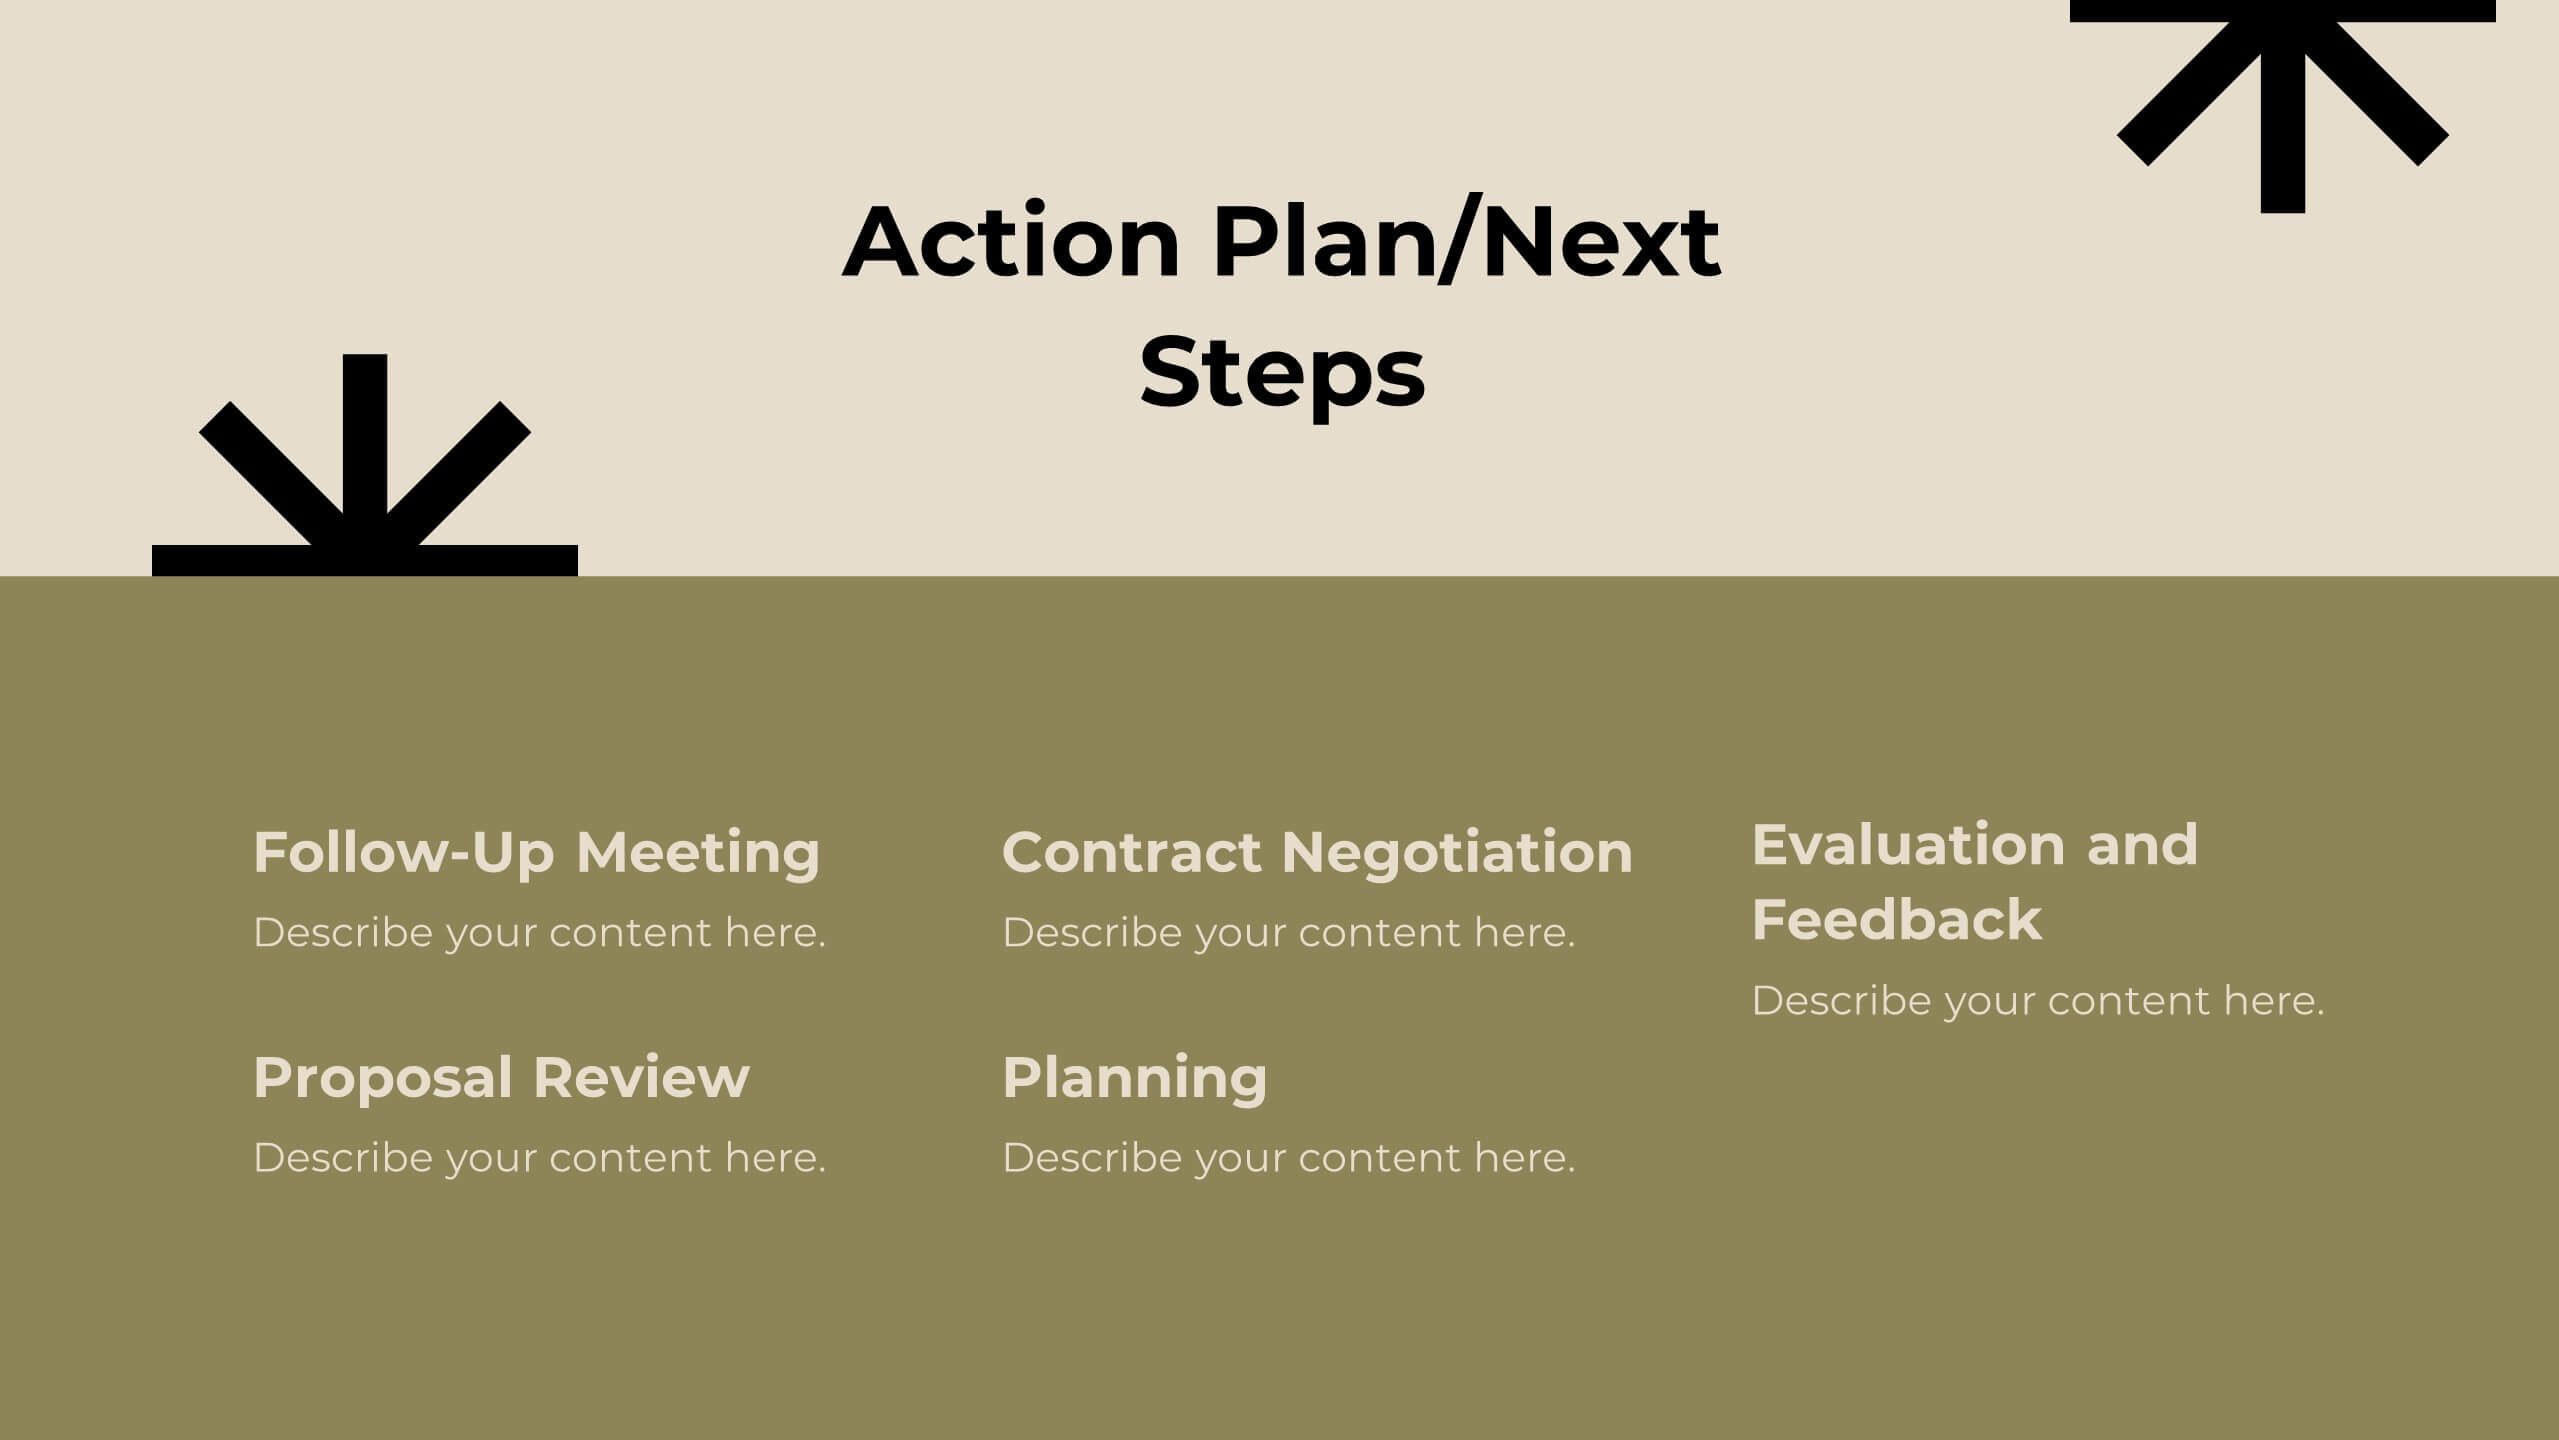
Opal Sales Pitch Deck Presentation
Boost your sales strategy with this sleek pitch deck template! Perfect for detailing your company overview, sales objectives, and pricing strategy, it includes slides for competitive analysis and customer testimonials. Engage your audience with clear, professional visuals and structured content. Compatible with PowerPoint, Keynote, and Google Slides for seamless presentations on any platform.


6 slides
Dynamic Chart Visual Toolkit Presentation
Visualize data at a glance with the Dynamic Chart Visual Toolkit Presentation. This modern slide set combines revenue boxes, line trends, and circular progress charts to showcase performance metrics or KPIs effectively. Clean, minimal, and fully editable in Canva, PowerPoint, Keynote, or Google Slides—perfect for reports, dashboards, and marketing updates.


6 slides
Business Milestone Timeline Presentation
Showcase key achievements and future goals with the Business Milestone Timeline Presentation. This visually engaging template allows you to highlight crucial company events, project phases, or strategic plans in a clear, structured format. Ideal for corporate reporting, business growth tracking, and investor presentations. Fully customizable and compatible with PowerPoint, Keynote, and Google Slides.


5 slides
Monthly Financial Report Infographics
Dive into financial analytics with our monthly financial report infographics template. This indispensable tool, designed for finance professionals, managers, and business owners, comes in a stimulating mix of orange, pink, and green, reflecting the dynamic nature of finance. The template stands out with creative graphics, detailed icons, and designated areas for images that encapsulate various financial parameters. Ideal for depicting key statistics, trends, and financial insights in a clear, engaging manner, this vertical-style infographic template is perfect for simplifying complex data, ensuring your monthly reports are both comprehensive and captivating.
6 slides
Arrow Mapping for Growth Journey
Showcase progress and strategic development using the Arrow Mapping for Growth Journey Presentation. This vibrant arrow-style roadmap is designed to highlight five key stages—perfect for illustrating phases of growth, milestones, or business transformations. Use it to map out project timelines, organizational development, or customer onboarding flows. Fully editable in PowerPoint, Keynote, and Google Slides, it’s ideal for business strategists, consultants, and marketing teams.


5 slides
Lean Six Sigma Business Strategy
Present your continuous improvement plan with this visually compelling Lean Six Sigma pyramid slide. Each layer represents a key phase—Define, Measure, Analyze, Improve, and Control—making it ideal for team training, process mapping, or performance reviews. Fully editable in PowerPoint, Keynote, and Google Slides.


7 slides
Subsistence Agriculture Infographic
Bring the essence of sustainability to your presentations with our Subsistence Agriculture infographic, designed for seamless integration with Powerpoint, Keynote, and Google Slides. This infographic is perfect for educators, agricultural professionals, and sustainability advocates who need to convey the importance of self-sufficient farming practices and their impact on local communities. Our Subsistence Agriculture infographic illustrates the fundamentals of agriculture that relies on the self-production of food by individuals and small communities. It highlights how this method supports sustainability, food security, and ecological balance. The visually engaging elements emphasize traditional farming techniques, crop diversity, and the role of agriculture in rural livelihoods. By incorporating this infographic into your presentations, you present a compelling narrative on the significance of subsistence farming in today's world. It not only educates your audience on the basics but also inspires discussions on the broader implications for global food systems. Use this infographic to effectively communicate the value of subsistence agriculture in maintaining community resilience and environmental stewardship.


22 slides
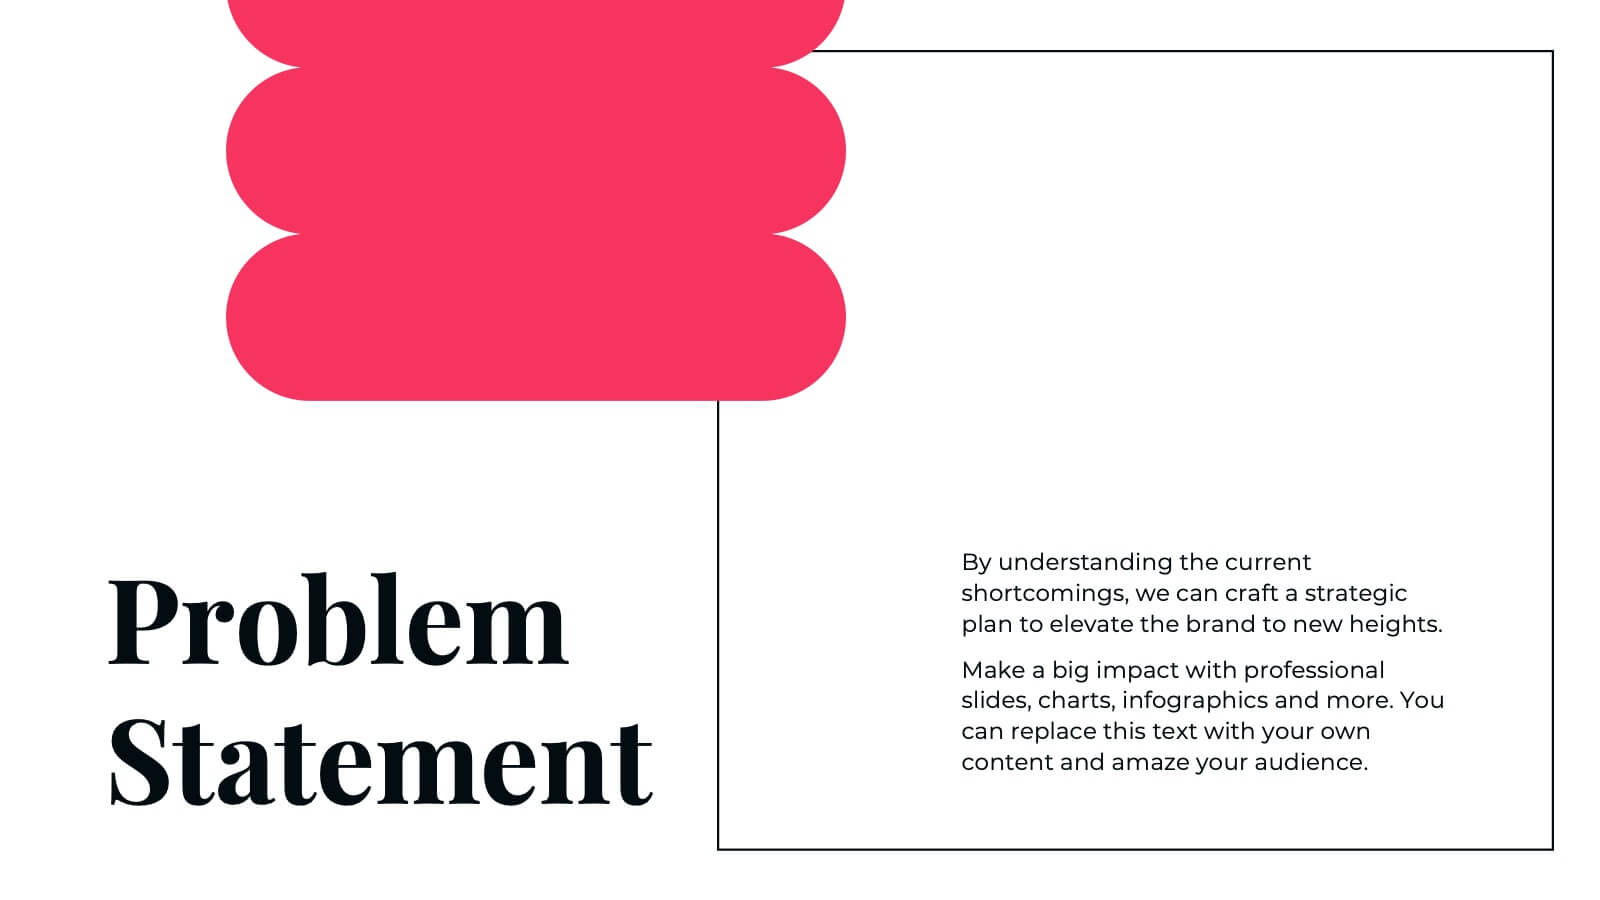
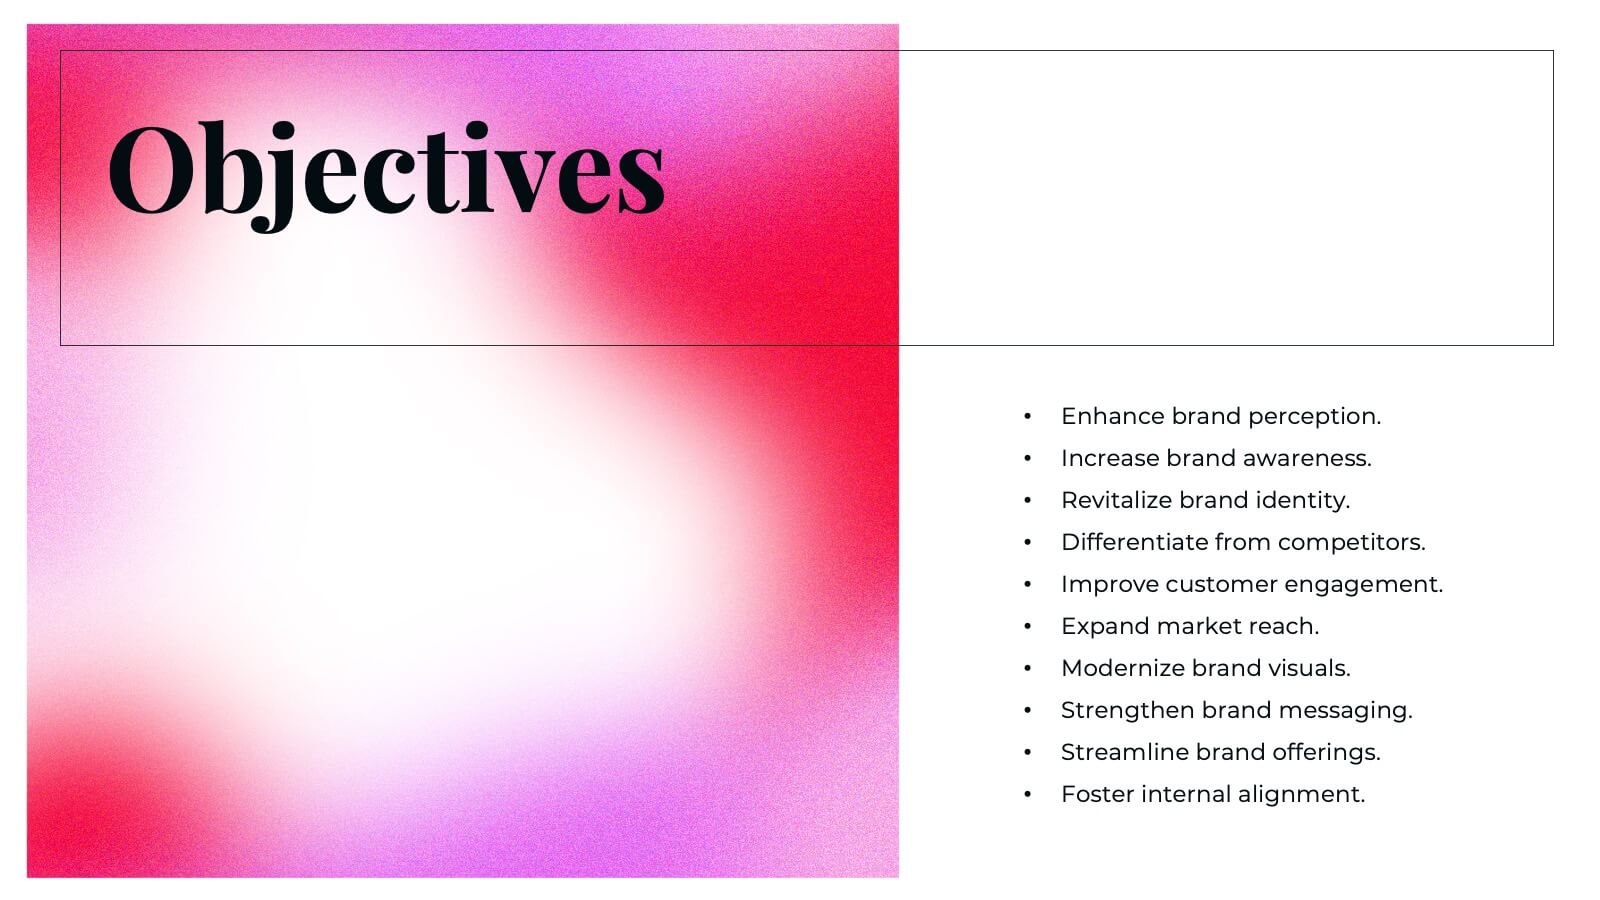
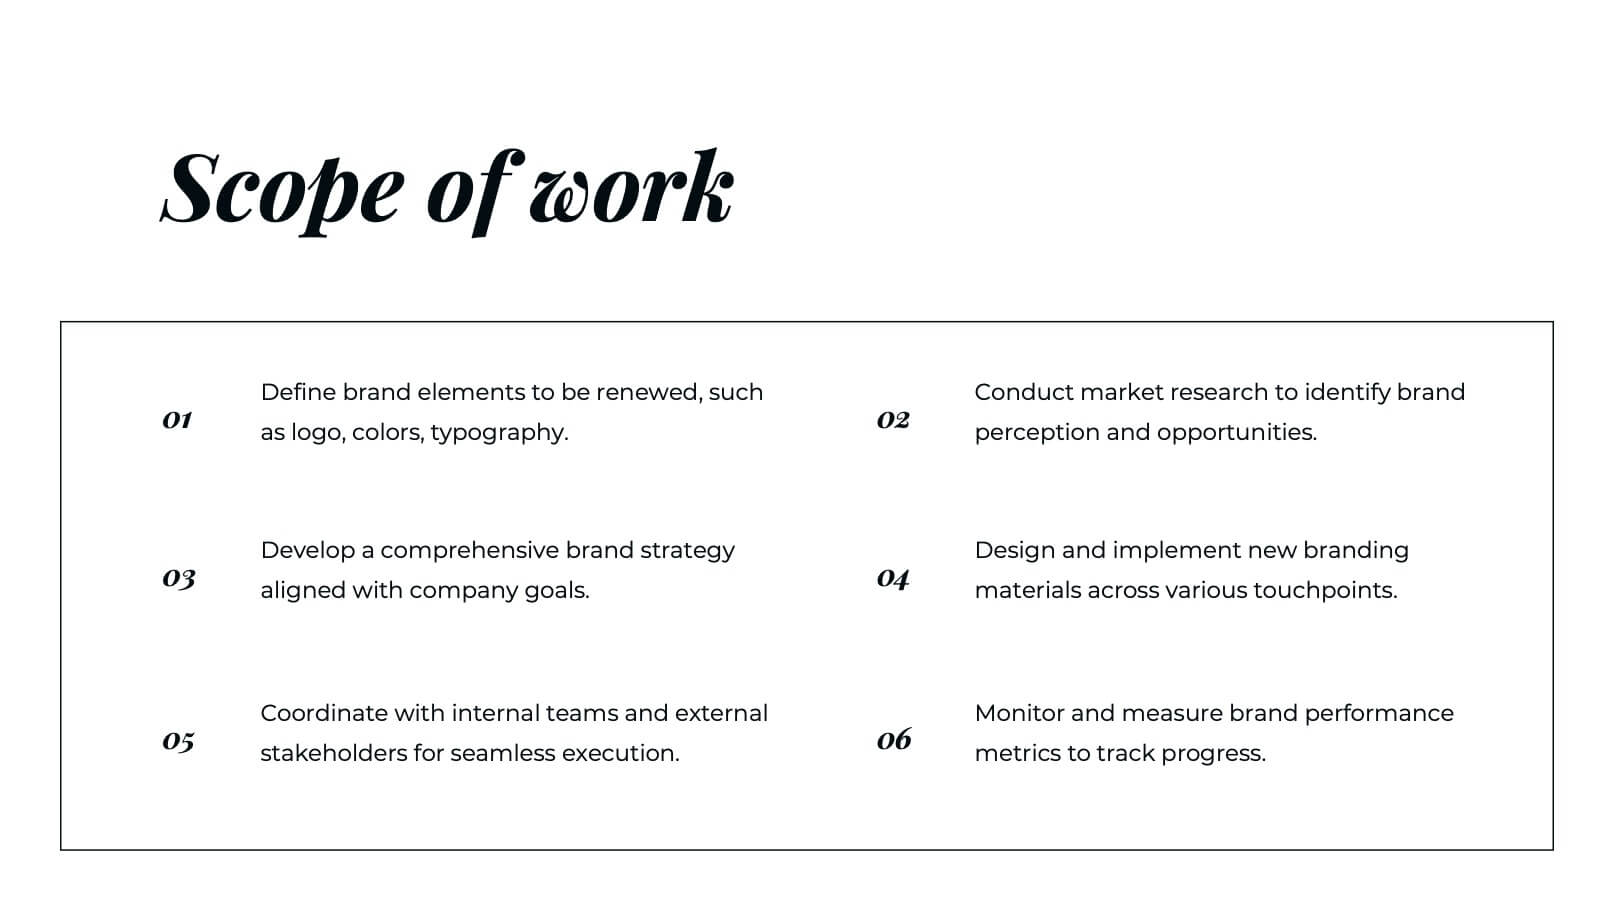
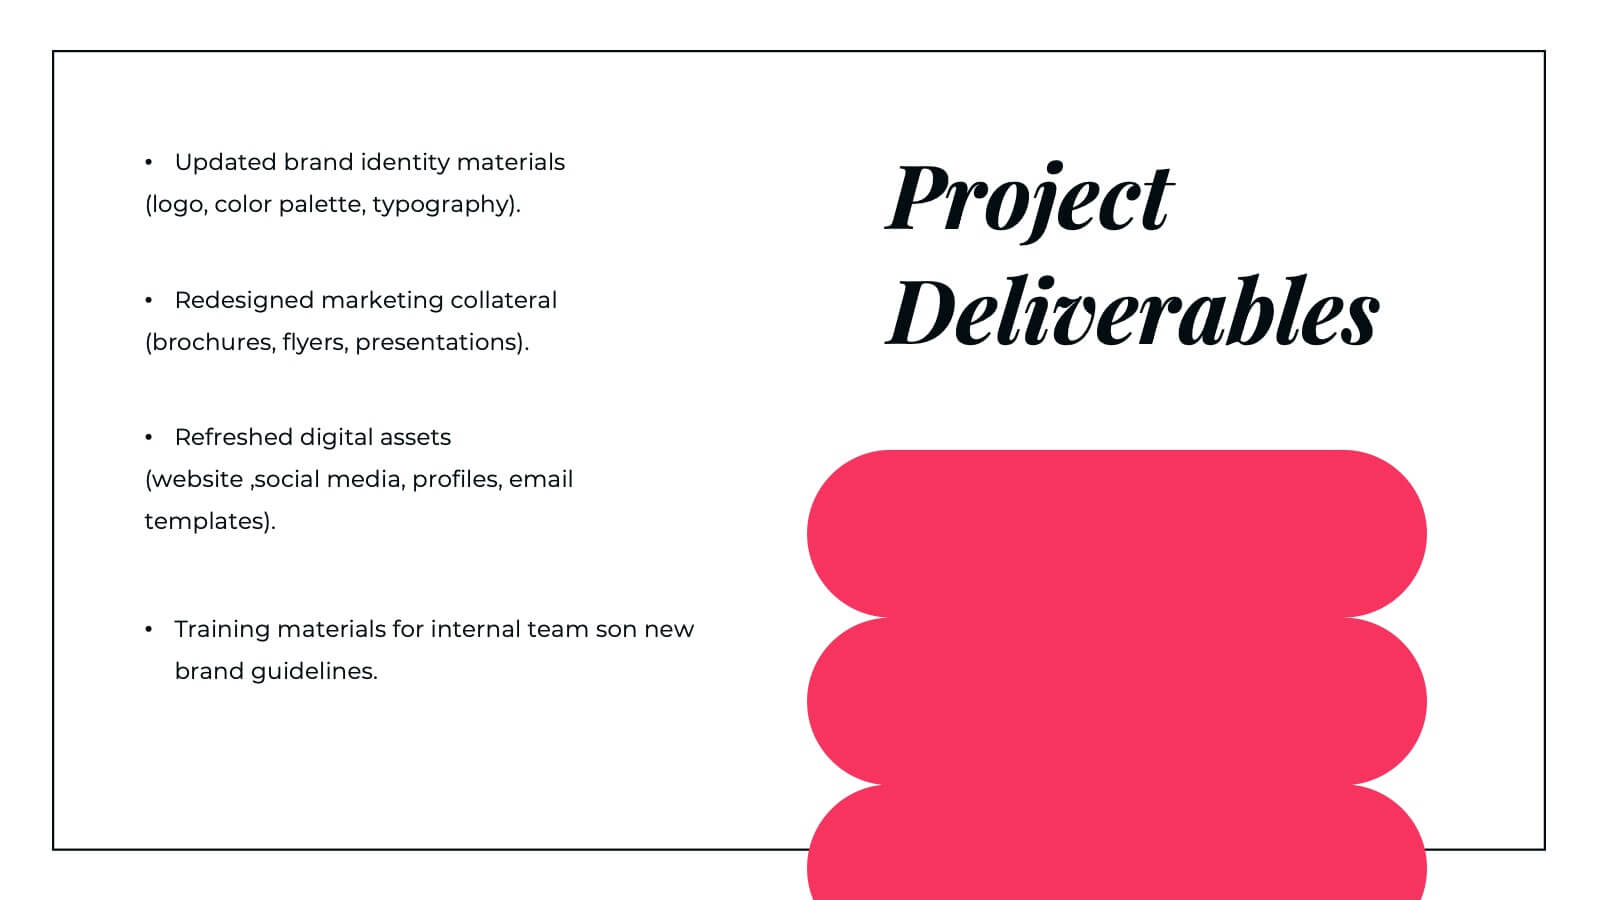
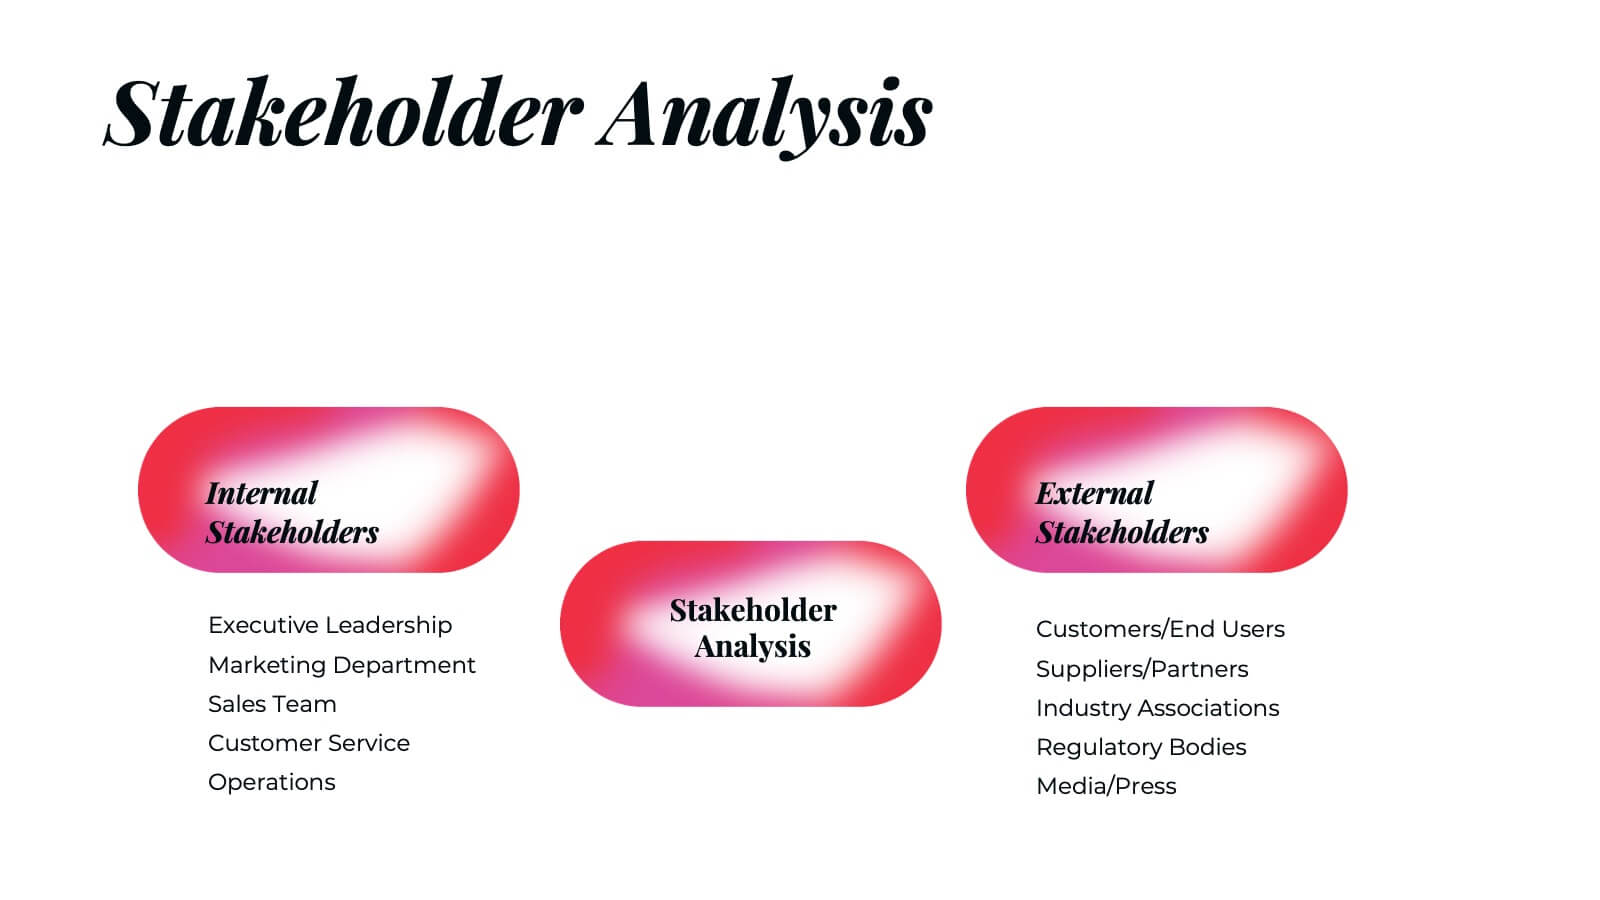
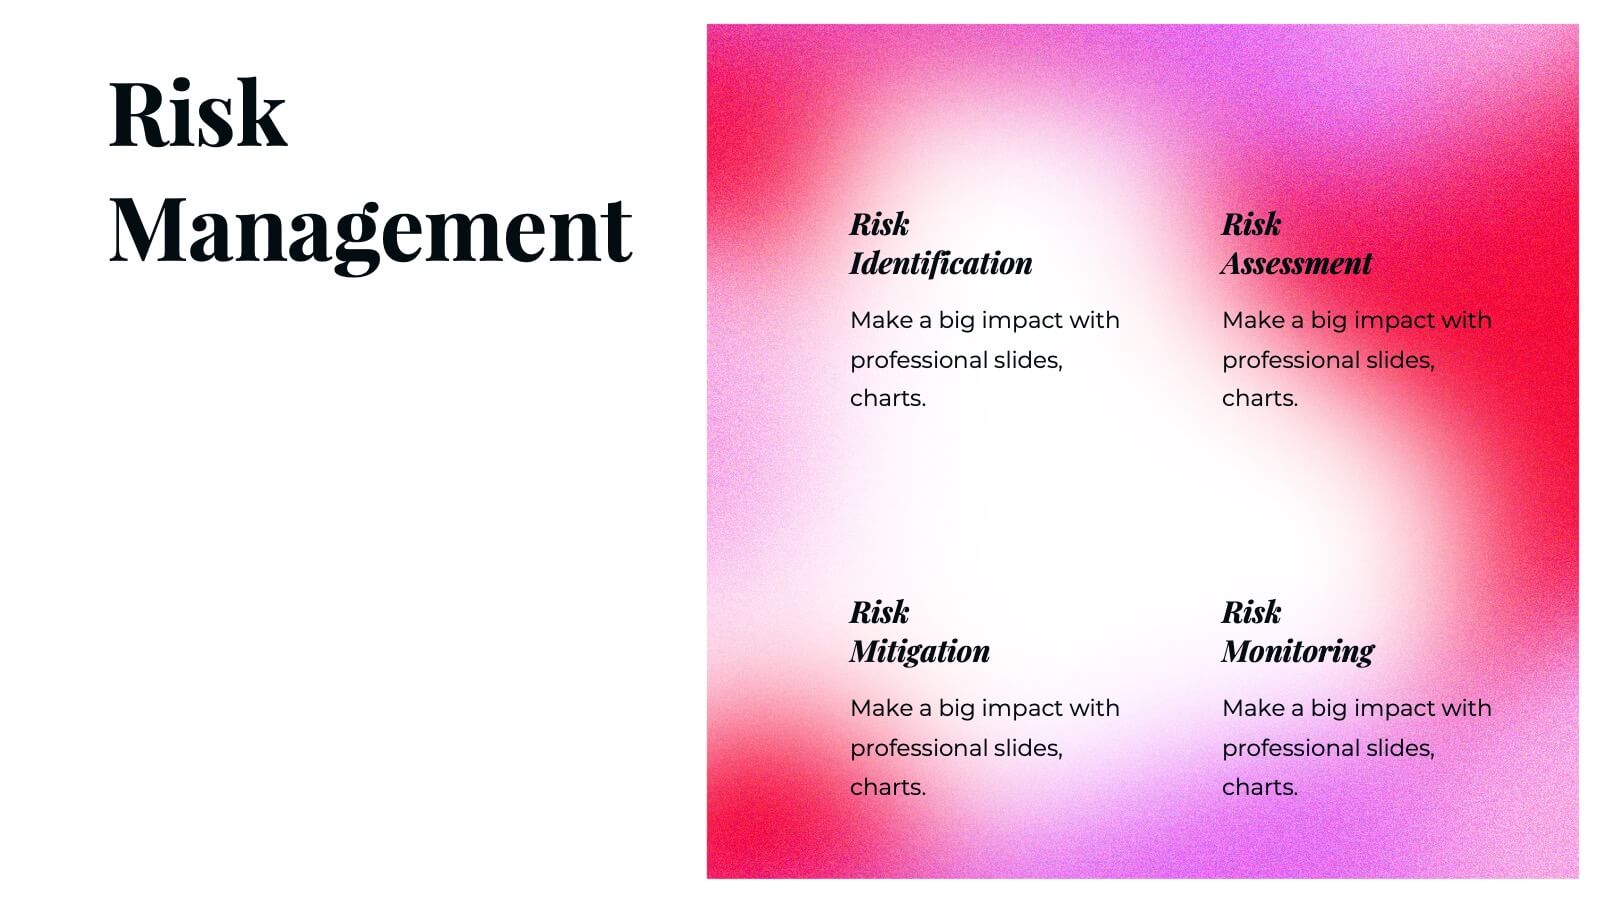
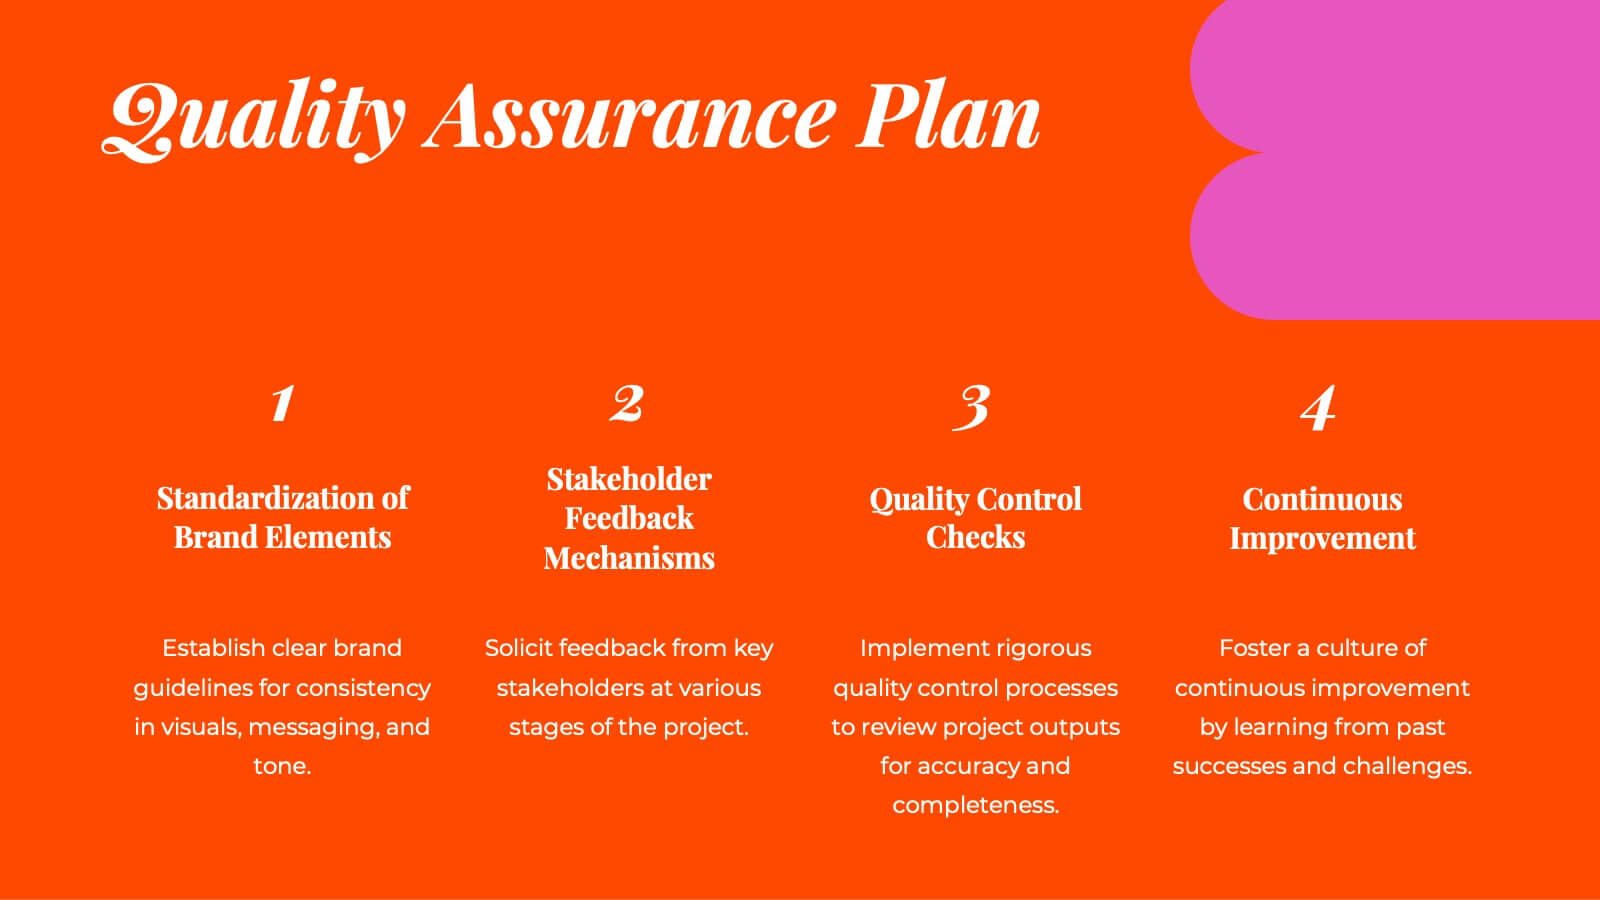
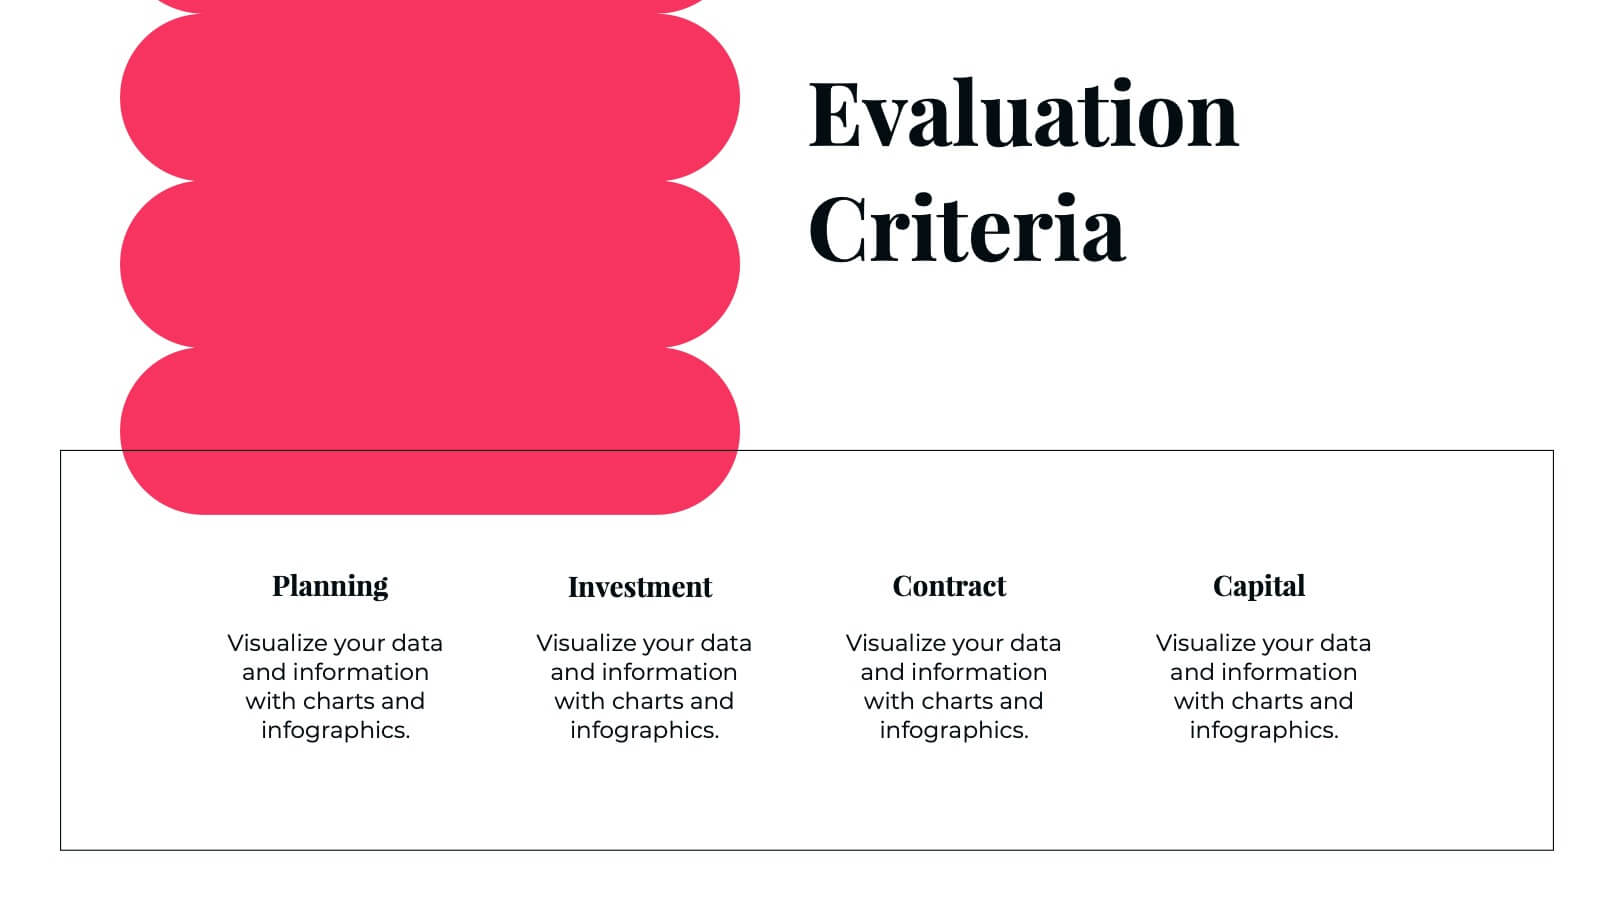
Moonstone Detailed Project Execution Plan Presentation
Create a compelling project execution plan with this vibrant and well-structured presentation template! Covering every key aspect from problem statements and objectives to risk management and quality assurance, this template provides a clear roadmap for your project. It’s perfect for organizing timelines, budget breakdowns, and stakeholder analysis. Compatible with PowerPoint, Keynote, and Google Slides for smooth presentations.


6 slides
Financial Credit Card Analysis Presentation
The Financial Credit Card Analysis presentation template offers a comprehensive visual tool for comparing different aspects of credit card features. Designed for clarity and impact, this template showcases key data points like interest rates, reward programs, fees, and user benefits across multiple cards in a color-coded format. Each segment is clearly labeled for easy understanding, making it an excellent choice for financial analysts, advisors, or anyone presenting credit card options to clients or within financial education workshops. The modular design allows for customizable sections to adapt to specific needs or to highlight particular cards or features effectively.


4 slides
Employee Training and Development
Train smarter, not harder—with this bold funnel-style visual that maps your employee development journey from initial training to measurable impact. It's perfect for illustrating progress, performance shifts, or development stages across teams or roles. Fully customizable in PowerPoint, Keynote, and Google Slides for smooth integration into any professional presentation.


6 slides
Weekly Gantt Schedule Management
Plan smarter, work smoother with the Weekly Gantt Schedule Management Presentation. This clean and structured timeline slide helps you map out tasks across the week, ideal for managing team workloads, tracking progress, and aligning project deadlines. Fully editable in PowerPoint, Keynote, and Google Slides to match your workflow.


6 slides
Achieving Career Success Presentation
Achieve your professional goals with the Achieving Career Success Presentation template. Designed for career coaches, professionals, and personal development strategists, this slide deck helps outline key milestones, success strategies, and growth trajectories in a visually compelling way. With a sleek, modern layout and clear step-by-step structure, this template is fully customizable and compatible with PowerPoint, Keynote, and Google Slides.


6 slides
Funding Request Project Proposal
Visually communicate your project's financial needs using this tiered Funding Request Project Proposal slide. With a stacked layout ideal for outlining budget categories or funding stages, it’s perfect for grant applications, investor decks, or internal pitches. Fully customizable in PowerPoint, Keynote, and Google Slides.


6 slides
Security Strategy and Risk Management Presentation
Keep your data safe and your strategy sharp with this modern, professional template built to explain protection frameworks, risk mitigation, and security planning. Its clean visuals make complex concepts easy to understand for teams and clients alike. Fully compatible with PowerPoint, Keynote, and Google Slides for effortless editing and presentation.


6 slides
Aviation Center Infographic
An aviation center refers to a facility or institution that is dedicated to activities related to aviation, which includes the design, development, manufacturing, maintenance, operation, and training associated with aircraft and aerospace technology. This engaging infographic template provides a concise and visually appealing overview of an aviation center's facilities, services, and offerings. This infographic plays a vital role in advancing the aviation industry, conducting research, offering training, and providing resources for aviation professionals and enthusiasts. This is the perfect template to encourage potential pilots and aviation enthusiasts.