


Features
- 10 Unique slides
- Fully editable and easy to edit in Microsoft Powerpoint, Keynote and Google Slides
- 16:9 widescreen layout
- Clean and professional designs
- Export to JPG, PDF or send by email


Do you have any questions?
Recommend


5 slides
Breast Cancer Month Awareness Infographics
Embrace the cause with our breast cancer month awareness infographics, a vital tool in disseminating crucial information during this significant period. Crafted with a harmonious blend of pink and white, this template serves not just as a visual aid but as a beacon of knowledge and support. It's designed for healthcare professionals, advocates, and educators looking to spread awareness and facts about breast cancer. The style is distinctly informative yet tenderly crafted, keeping the sensitivity of the topic in mind. It incorporates purposeful graphics and icons. This template is an asset for those aiming to inspire action, educate audiences, and offer hope through information.


7 slides
Startup Infographic Presentation Template
A Startup Infographic is a visual representation of information related to starting a new business, including important data, statistics, and information about the process of launching a startup company. The aim of our startup infographic is for you to present information in an easily digestible and visually appealing manner. Help to communicate complex concepts to an audience and the steps involved in starting a new business. Use this template to make presentations that’ll blow your audience away. This layout is flexible, adaptable and compatible with Powerpoint, Keynote, and Google Slides.


7 slides
South America Political Map Infographic
Dive into the vibrant landscapes of South America with our detailed map infographic. Infused with the pure essence of white, the depth of blue, and the vivacity of green, our template beautifully mirrors South America's diverse topography and culture. Enhanced with spot-on infographics, representative icons, and country-centric image placeholders, it offers a panoramic view of this dynamic continent. Seamlessly constructed for Powerpoint, Keynote, or Google Slides. An indispensable asset for educators, travelers, geographers, or businesses eyeing the South American market. Venture with clarity; let every slide be an exploration of South America's wonders.


6 slides
Natural Food Infographics
The "Natural Food" infographic template is a fresh and appealing visual tool, meticulously designed for PowerPoint, Keynote, and Google Slides. This template is an excellent resource for nutritionists, food bloggers, and organic food marketers looking to present the benefits, sources, and variety of natural foods in an engaging manner. This template vividly showcases the spectrum of natural foods, including fruits, vegetables, grains, and proteins, emphasizing their health benefits, nutritional values, and sustainable sourcing. Its layout is perfect for educating audiences about healthy eating habits, organic farming, and the positive environmental impact of choosing natural foods. The design is as refreshing as the topic it represents, with a color scheme that is vibrant and earthy. This not only makes the presentation visually enticing but also resonates with the themes of health, vitality, and environmental consciousness. Whether used in a workshop, a marketing campaign, or an educational seminar, this template ensures that the wholesome goodness of "Natural Food" is presented in a visually stunning, informative, and appetizing manner.


6 slides
Asia Colonization Map Infographics
Discover the versatility of our Asia Colonization Map infographic template, a powerful tool for visualizing the historical impact of colonization across the diverse continent of Asia. This template is fully compatible with popular presentation software like PowerPoint, Keynote, and Google Slides, enabling effortless customization to suit your specific needs. The Asia Colonization Map infographic template offers a robust foundation for illustrating colonization timelines, colonial powers, and regions affected by colonization throughout Asia's rich history. Whether you're a historian, educator, or simply intrigued by Asia's colonial past, this template provides a user-friendly platform to create engaging presentations and informative materials. Impress your audience with this SEO-optimized Asia Colonization Map infographic template, expertly designed for clarity and ease of use. Tailor it to showcase the historical narratives, impact, and legacies of colonization in Asia, making it a valuable asset for your projects and presentations. Start crafting your personalized infographic today!


10 slides
Concept Mapping with Bubble Map
Break down complex ideas into visual clusters with this hexagon-style concept mapping template. Designed to organize information into thematic groups, it's ideal for brainstorming, mind mapping, or presenting strategies and workflows. Each section uses color-coded bubble maps for easy navigation. Fully editable in PowerPoint, Keynote, and Google Slides.


8 slides
Annual Business Performance Report Presentation
Visualize your company’s progress with the Annual Business Performance Report Presentation. This sleek, data-driven template combines donut charts and bar graphs to showcase KPIs, milestones, and key achievements. Perfect for year-end summaries and stakeholder updates. Fully editable in Canva, PowerPoint, and Google Slides for easy customization and professional results.


21 slides
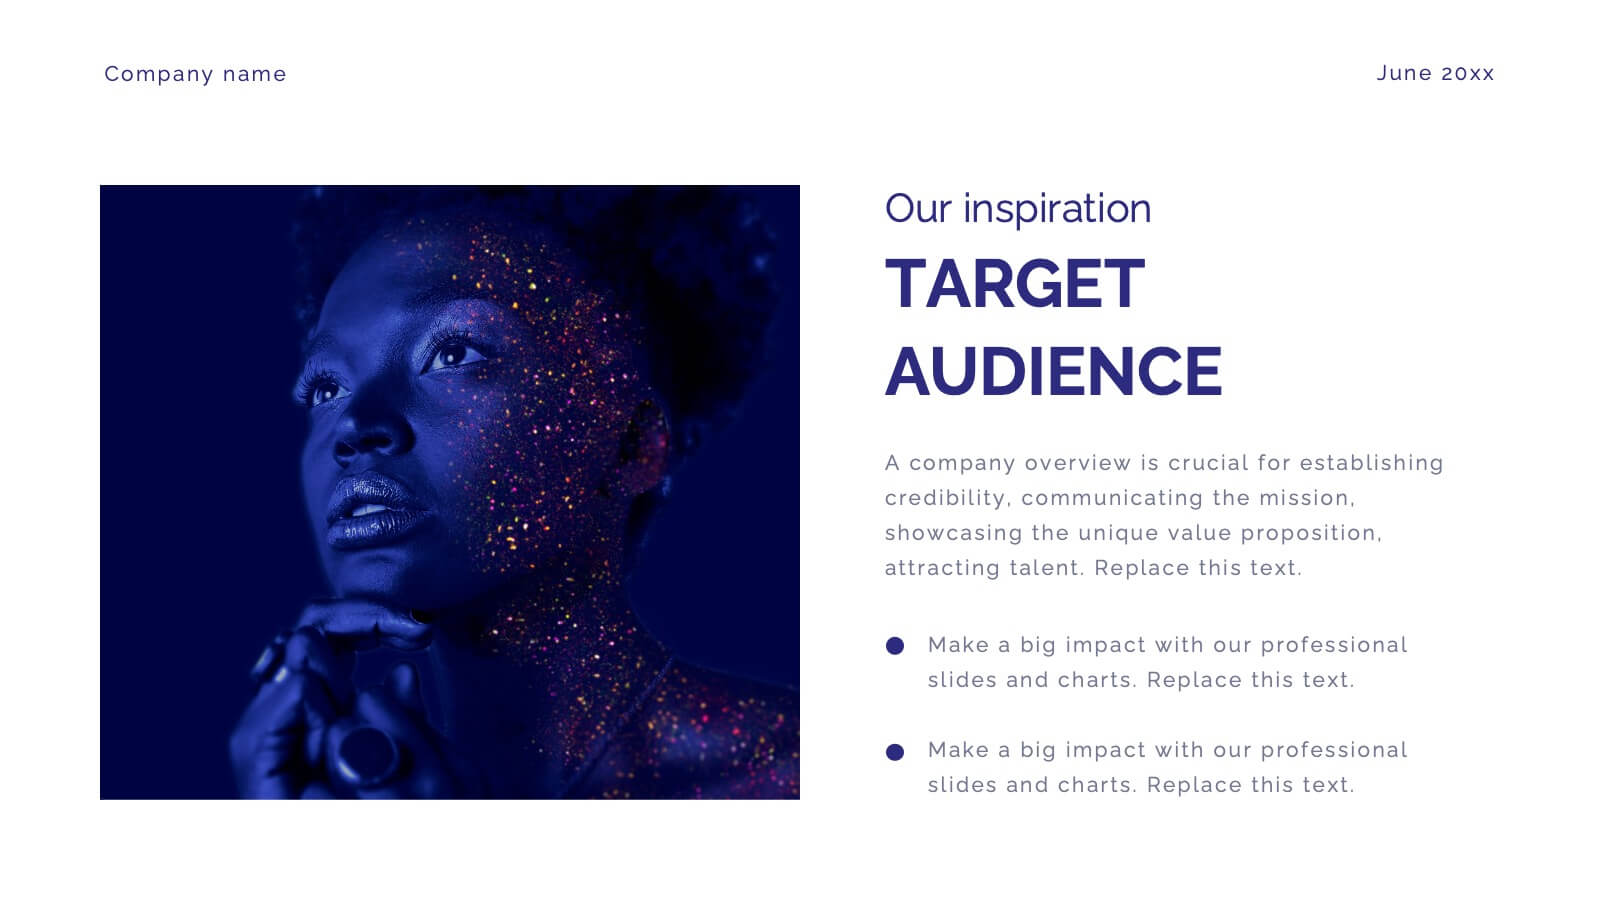
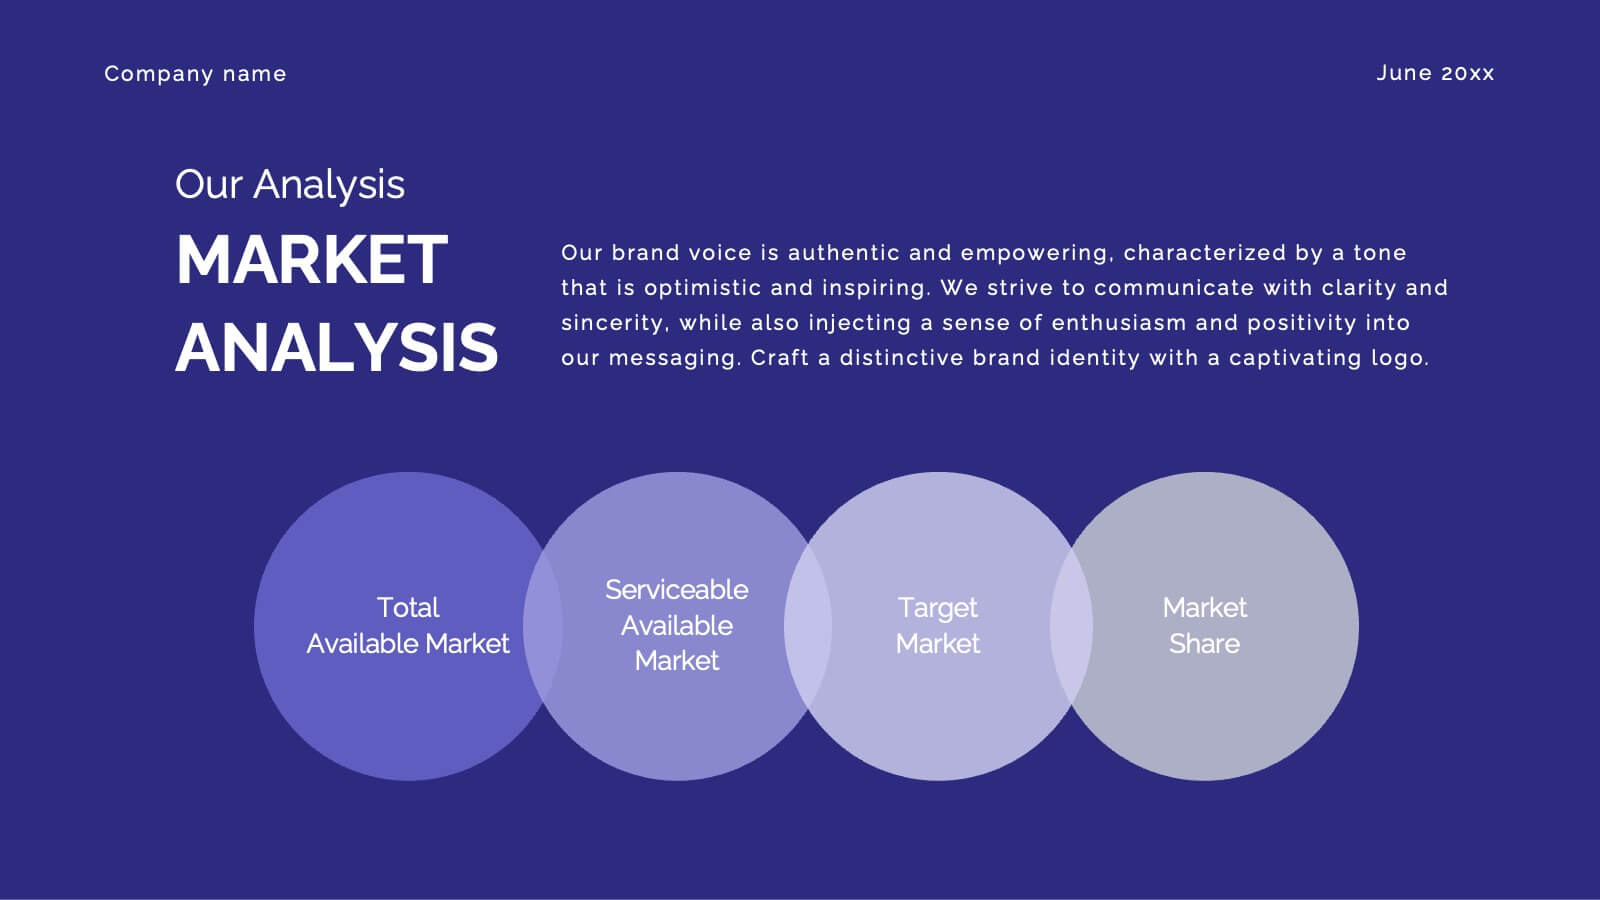
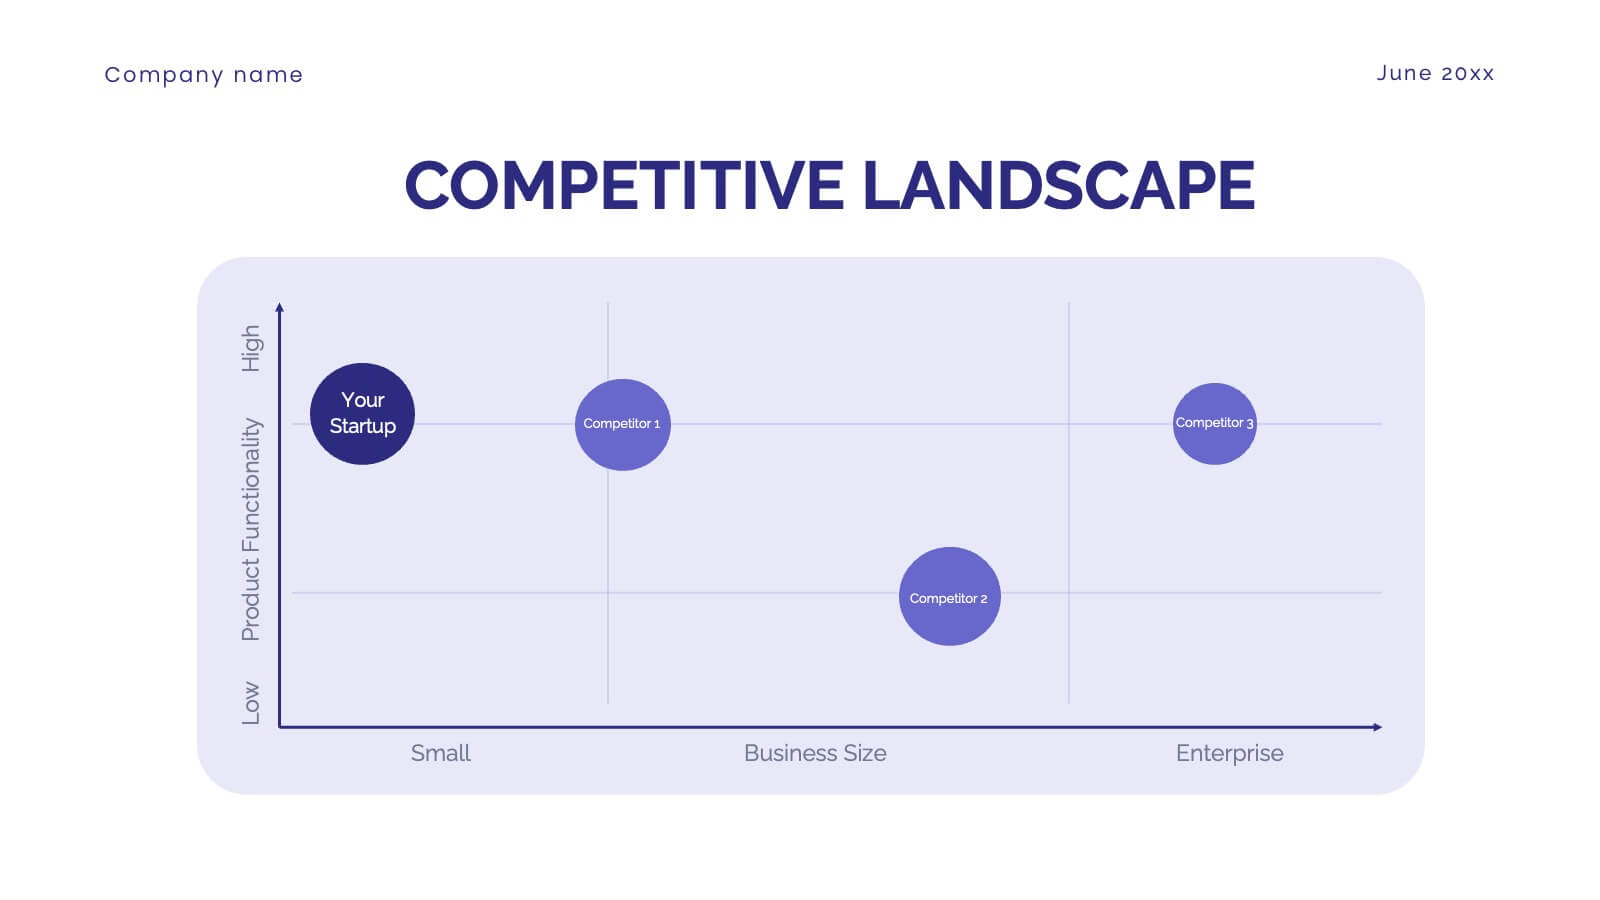
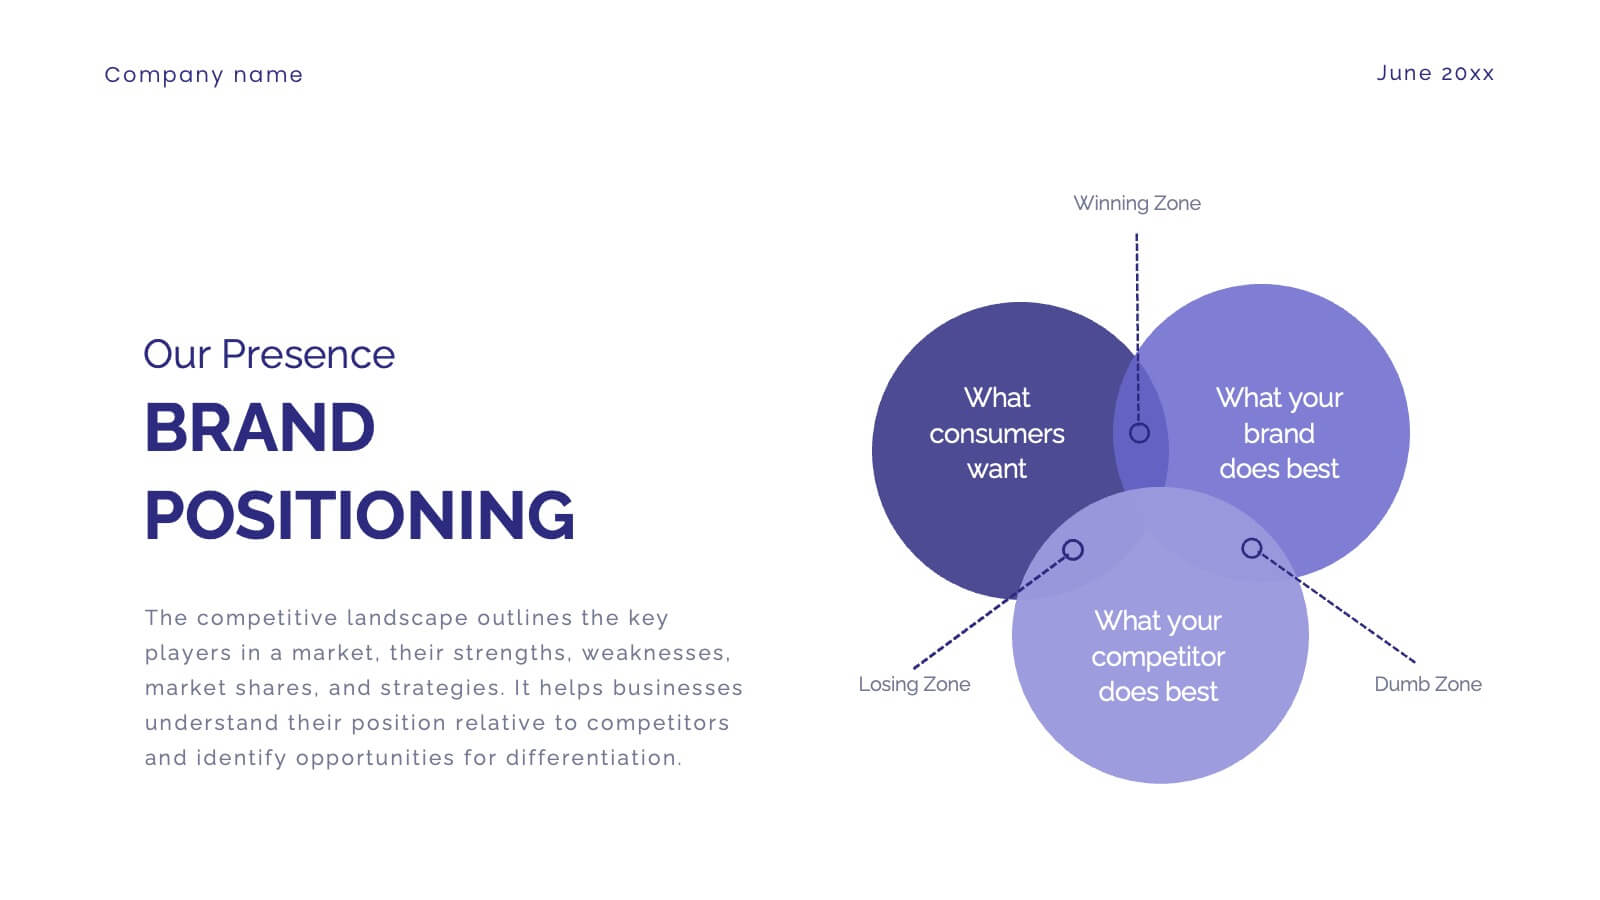
Drowsira Marketing Research Report Presentation
Present your market insights effectively with this professional and modern template. Covering key sections such as market presence, target audience, competitive landscape, and financial highlights, it offers a structured layout for impactful storytelling. Fully customizable and available for PowerPoint, Keynote, and Google Slides.


4 slides
Personal and Business Insurance Plans
Clearly present your insurance tiers with this easy-to-read comparison layout. Ideal for showcasing plan options for individuals, families, and businesses, this template highlights pricing, benefits, and coverage icons side-by-side. Clean and professional, it’s fully editable in PowerPoint, Keynote, and Google Slides.


6 slides
Product Mockup Infographic
Showcase your products with unparalleled clarity using this collection of product mockup templates. Designed for versatility and impact, each template provides a vivid representation of your products on various digital devices, emphasizing detail and design with a polished, professional finish. These mockups are ideal for demonstrating the user interface and user experience aspects of digital products like apps, websites, and software. The templates feature intuitive layouts and a harmonious blend of colors that enhance the visual appeal while keeping the focus on your product's features. Customize each mockup with your own screenshots and descriptions to create a compelling presentation that speaks directly to your audience's needs. Ideal for tech startups, software developers, and digital marketers, this collection helps you communicate the value of your products in a straightforward yet captivating manner, whether for client presentations, marketing materials, or investor pitches.


26 slides
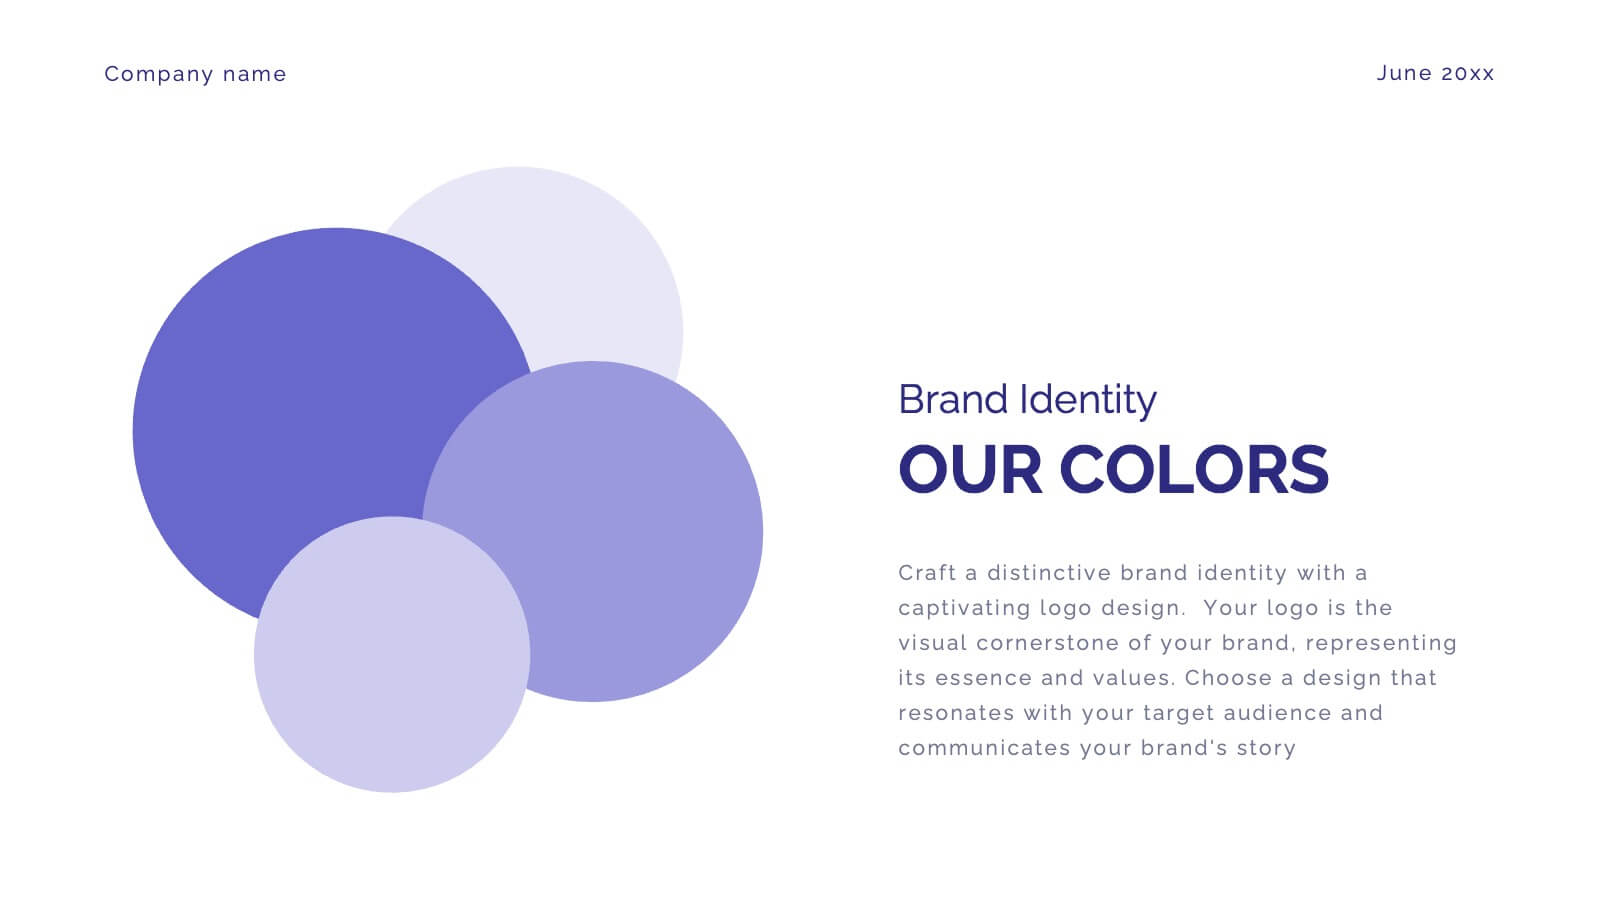
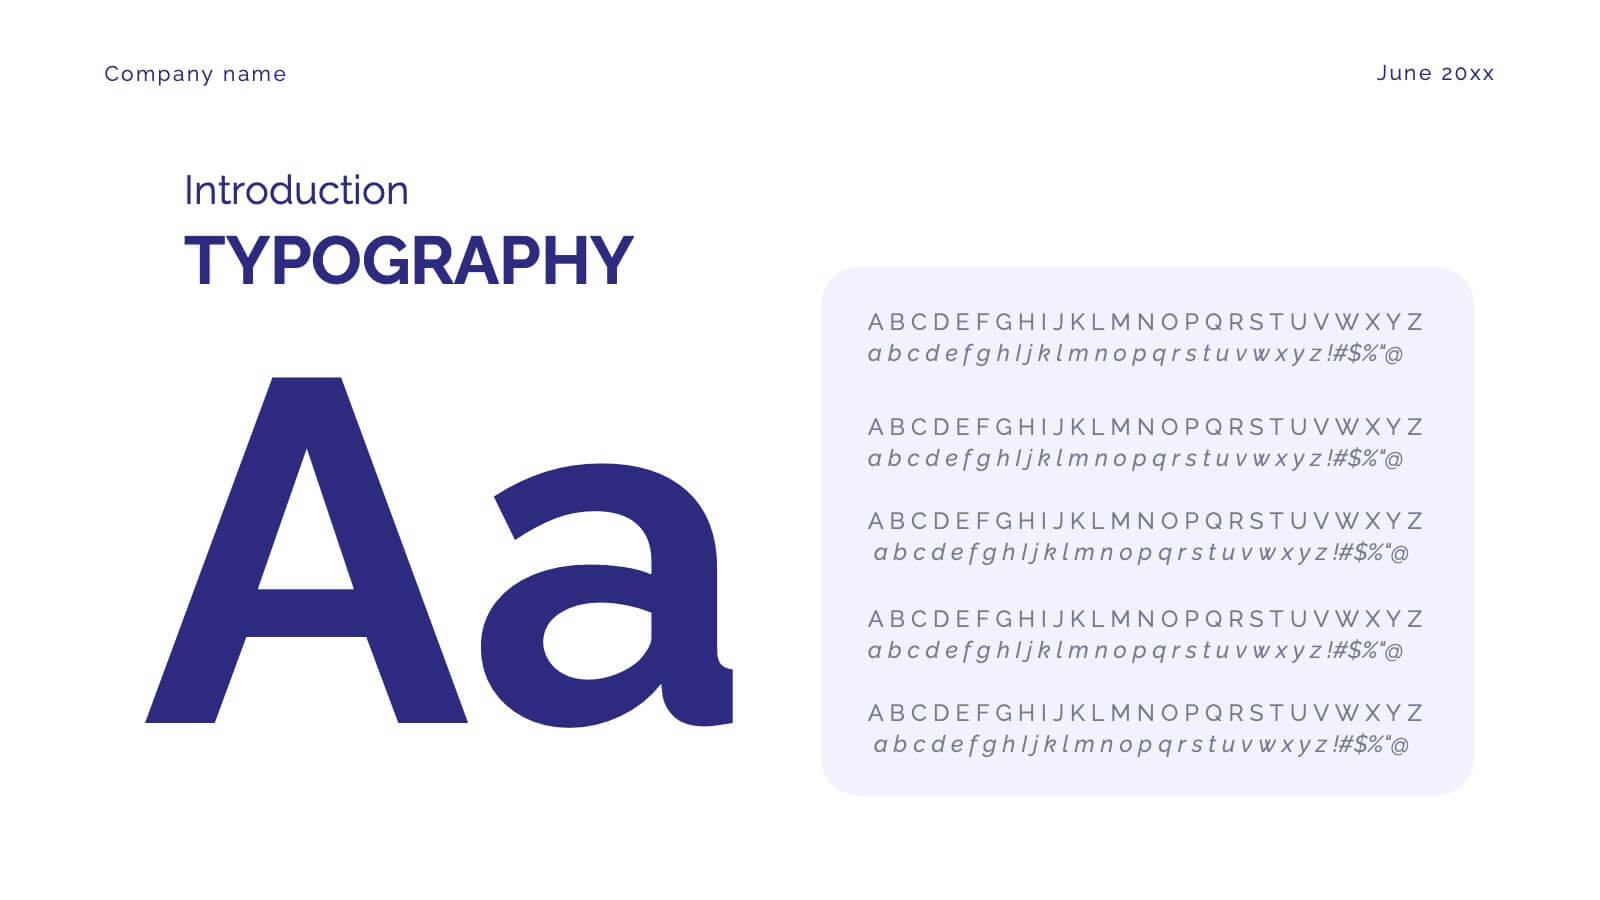
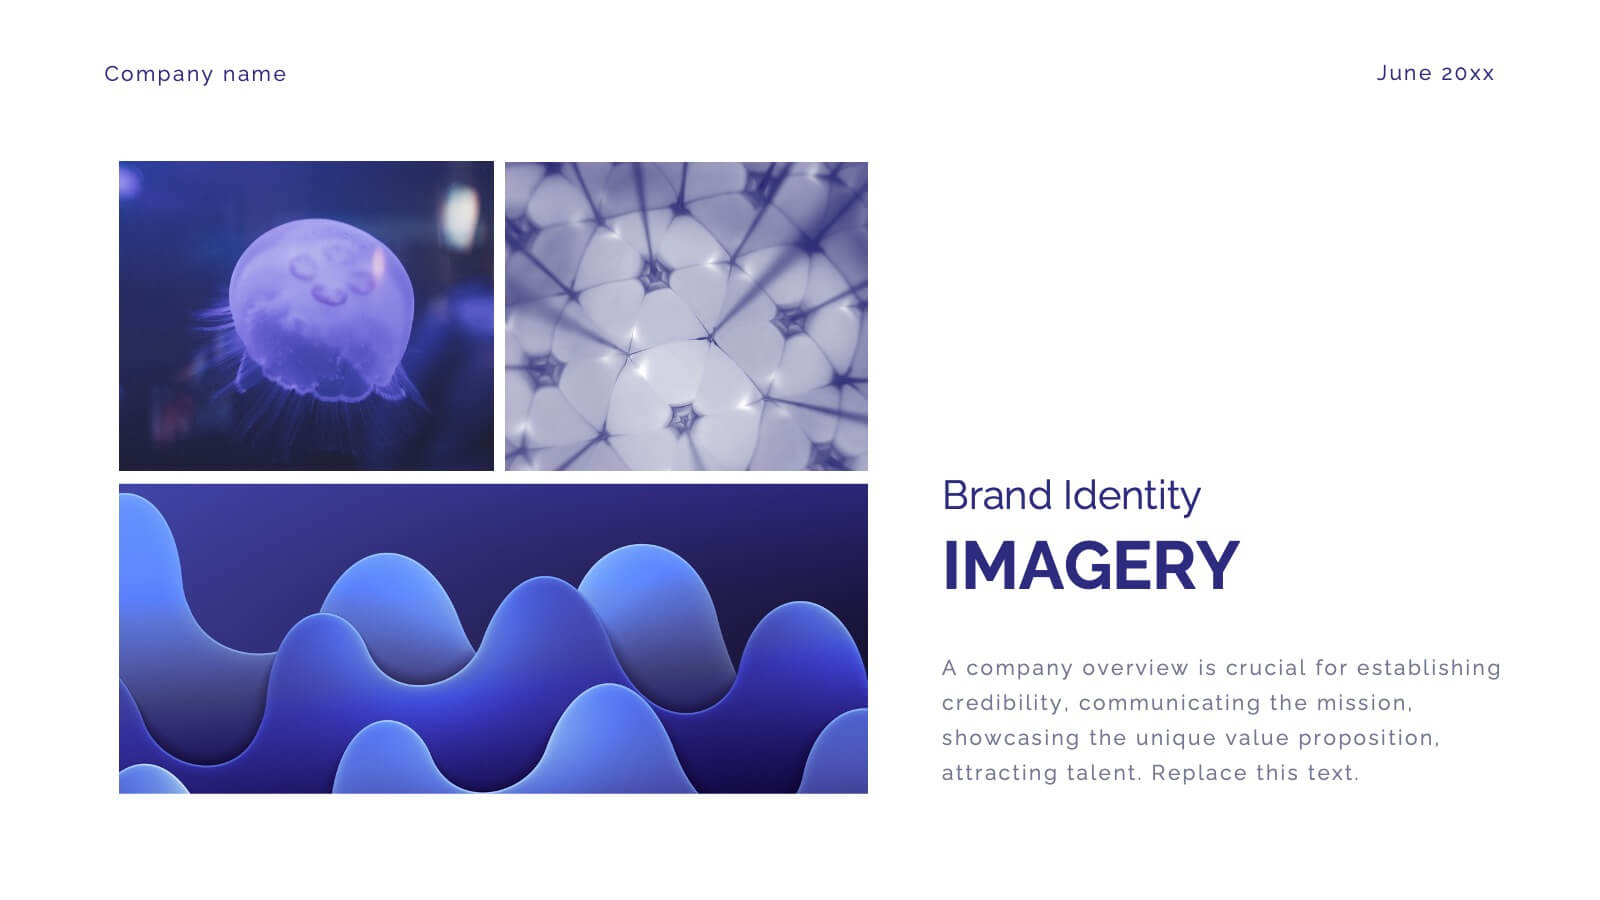
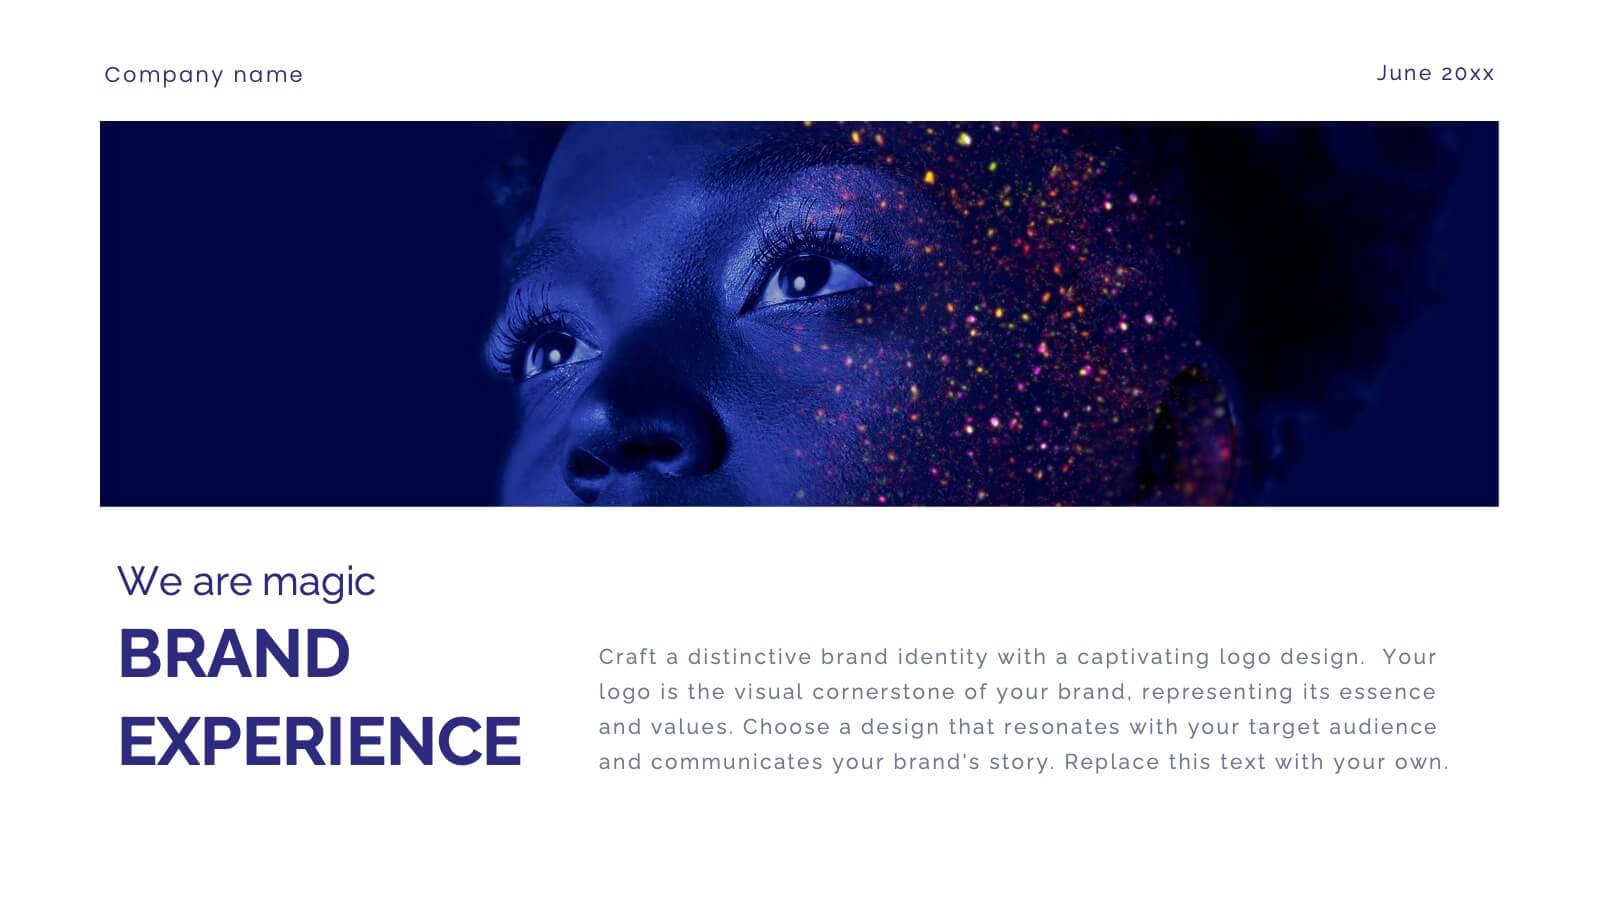
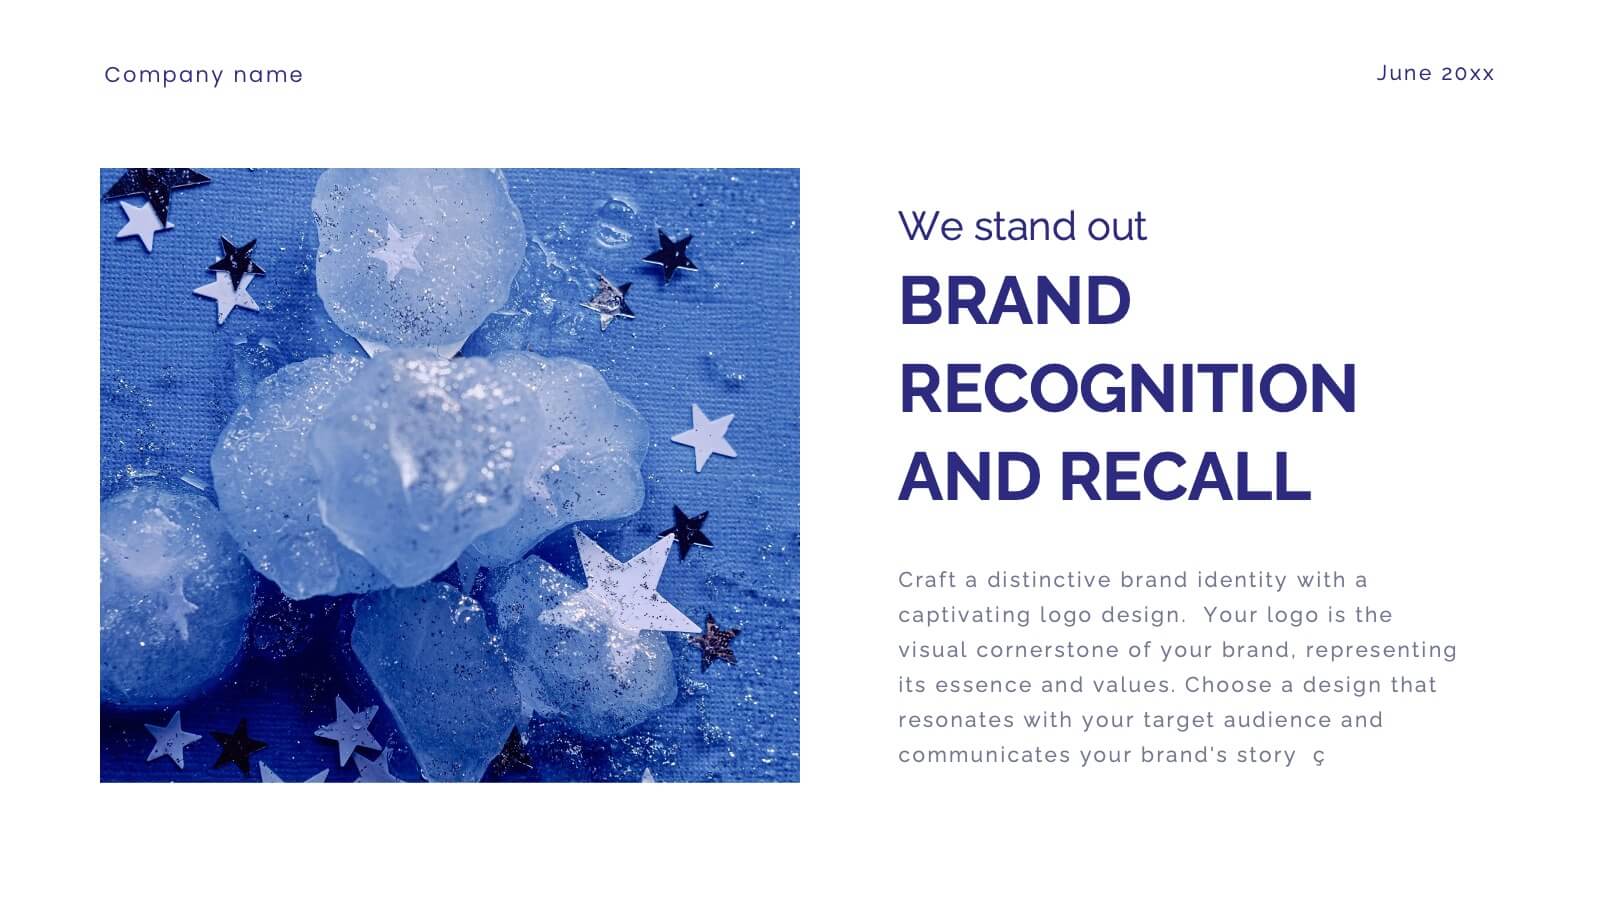
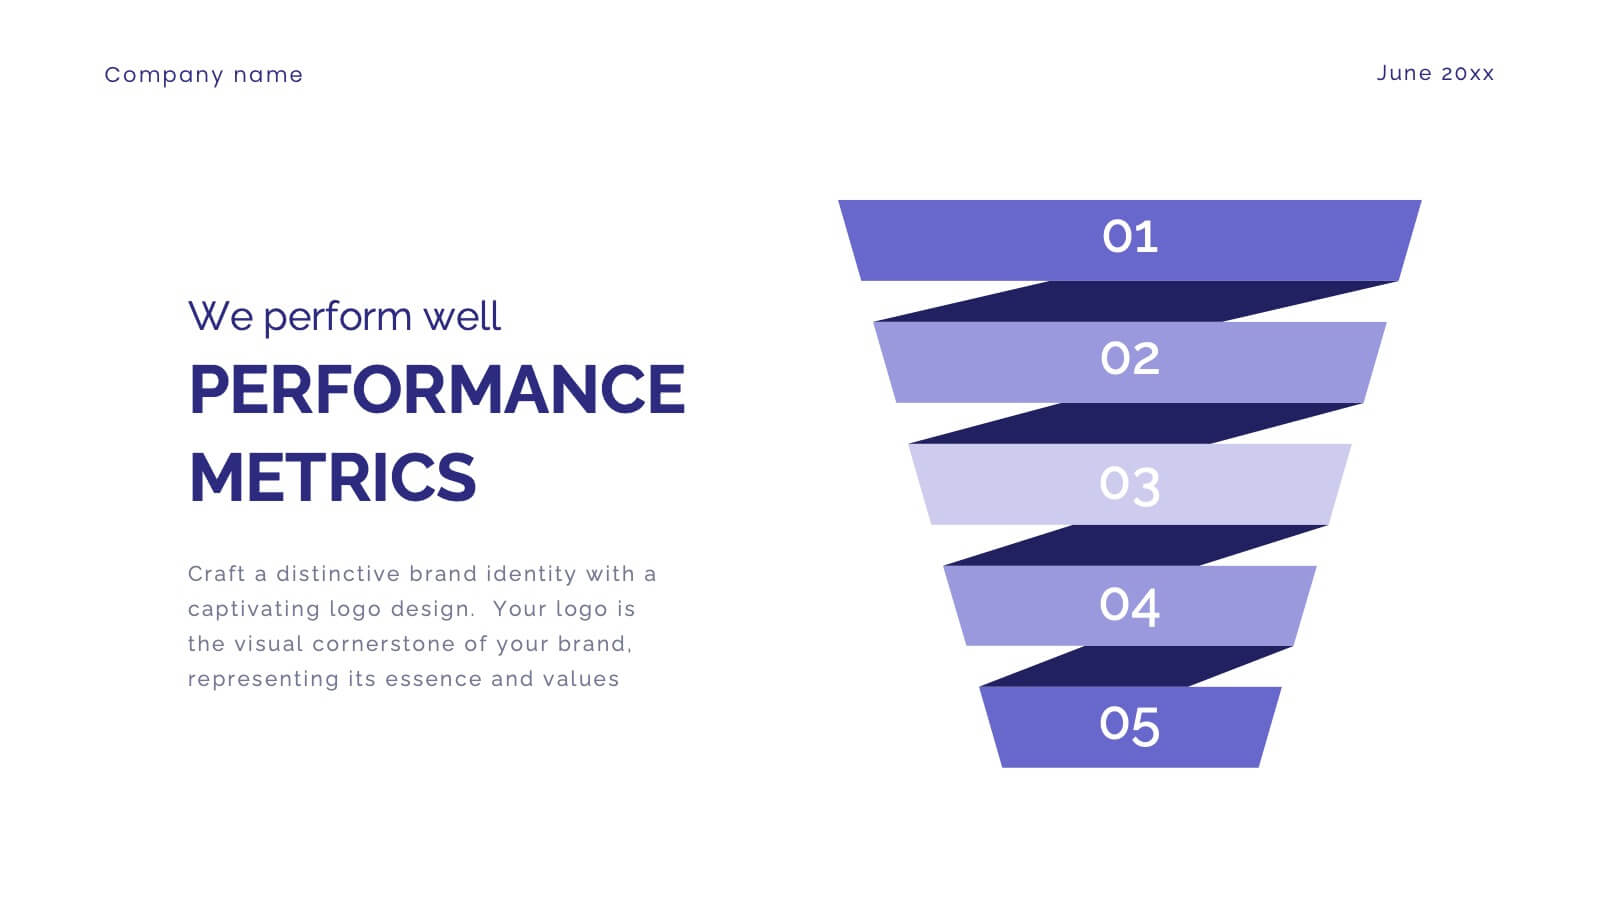
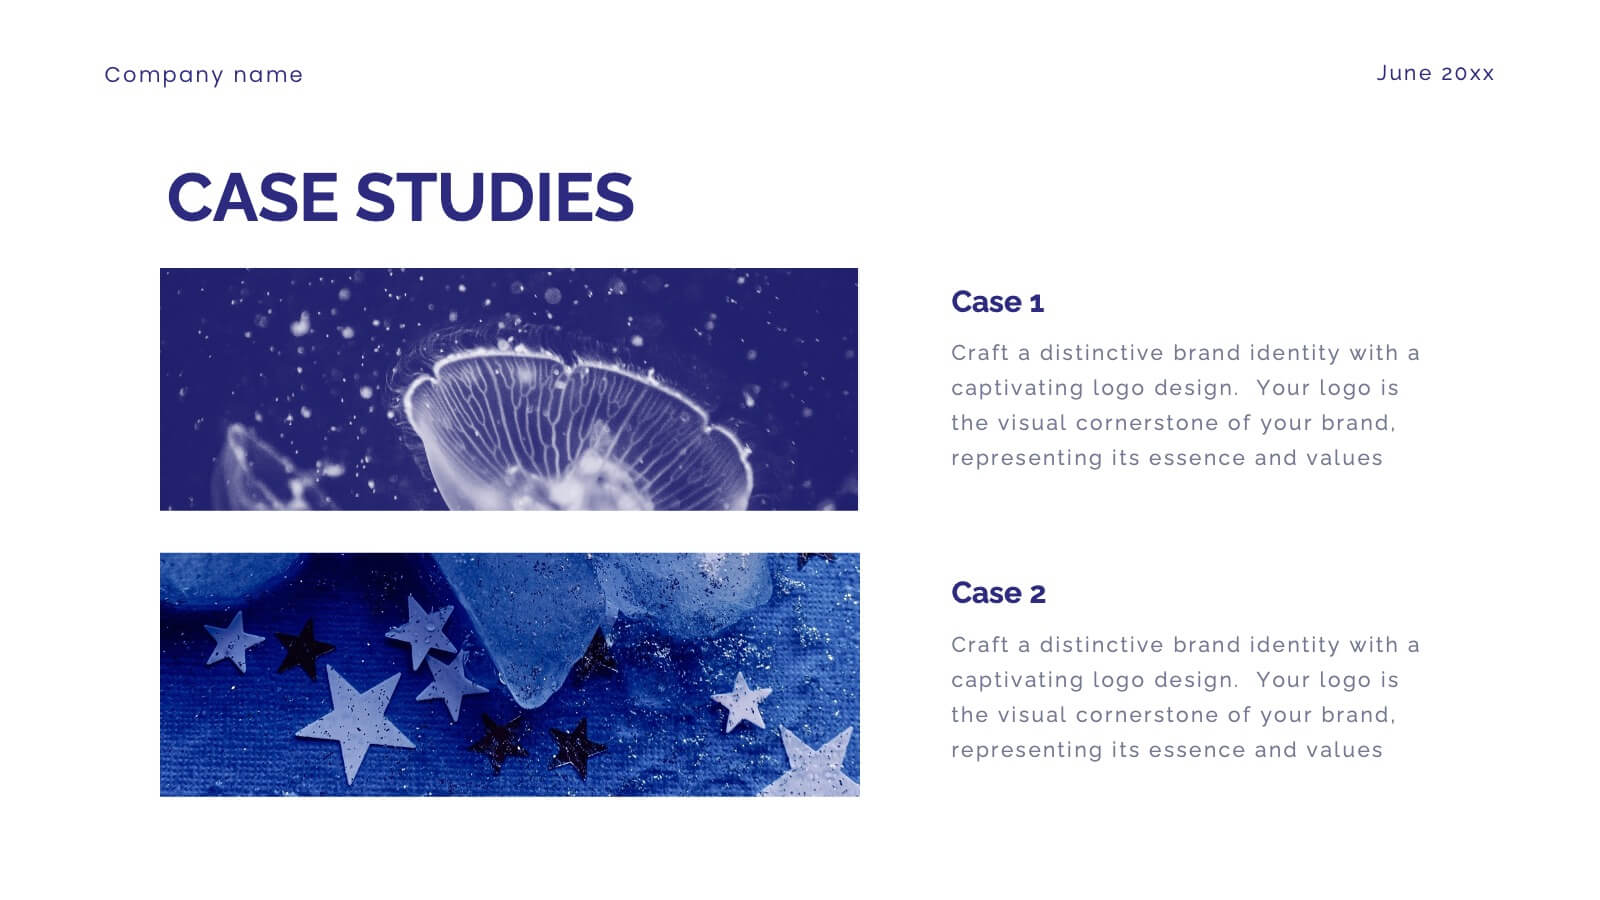
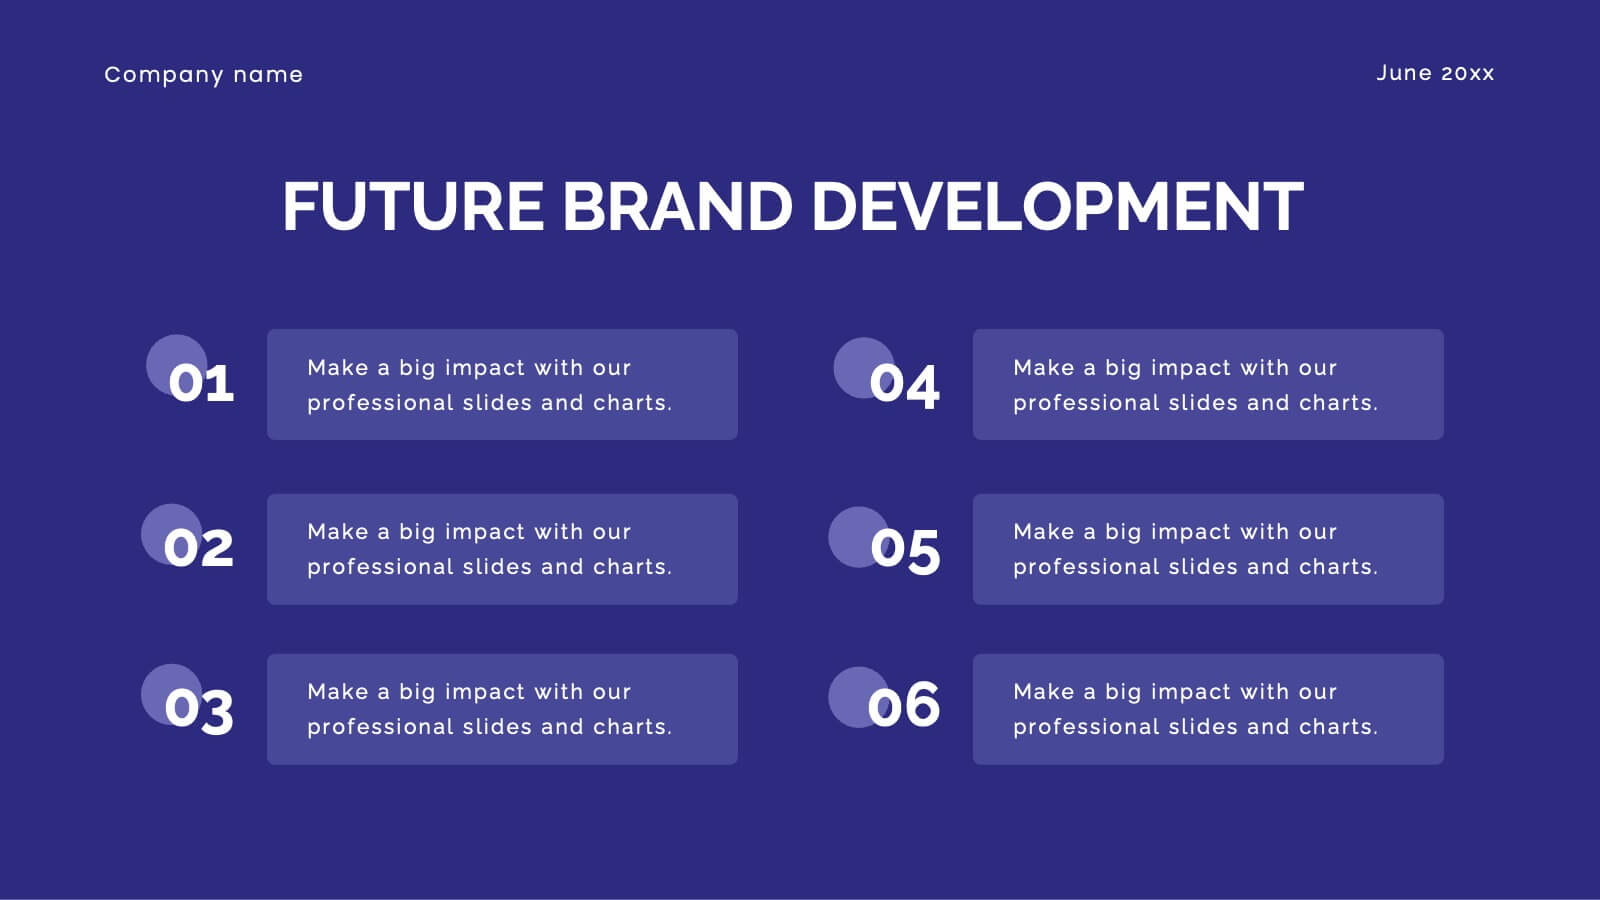
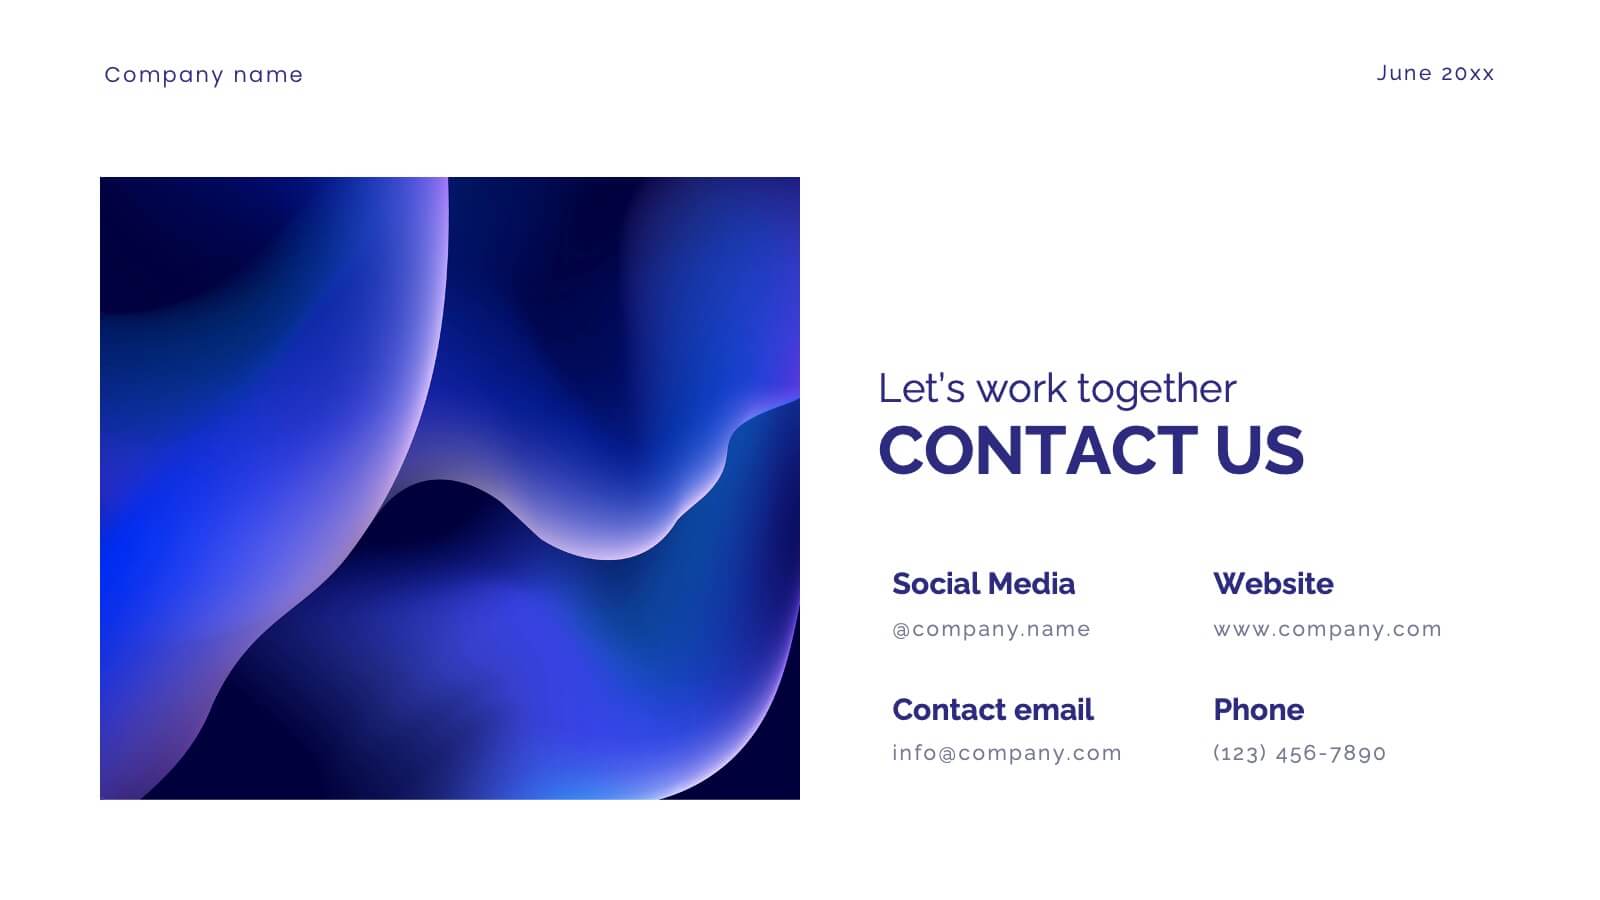
Glimmer Brand Development Pitch Deck Presentation
Elevate your brand with this comprehensive rebranding presentation template! Perfect for detailing your logo, color scheme, and market analysis, it includes slides for brand positioning, competitive landscape, and performance metrics. Engage your audience with clear visuals and structured content. Compatible with PowerPoint, Keynote, and Google Slides for seamless presentations on any platform.


4 slides
Innovative Business Solution Strategy
Present fresh, impactful ideas with this innovative business solution strategy slide. Featuring a creative lightbulb design, this template helps you showcase strategic solutions, key initiatives, or breakthrough concepts in a visually organized way. Perfect for startups, innovation workshops, and business growth meetings. Fully editable and compatible with PowerPoint, Keynote, and Google Slides.


6 slides
Healthy Meal Planning Template Presentation
Visualize balanced nutrition with the Healthy Meal Planning Template. Featuring a layered jar graphic, this presentation organizes up to six content sections—ideal for meal prep, wellness routines, or health education. Clean and editable in PowerPoint, Keynote, and Google Slides. Perfect for nutritionists, fitness professionals, or wellness-focused content planning.


23 slides
Glimmer Sales Pitch Deck Presentation
Get ready to wow investors with this dynamic pitch deck! Perfect for startups and entrepreneurs, it covers company overview, market opportunity, revenue models, and more. Designed to highlight your business potential and secure funding. Compatible with PowerPoint, Keynote, and Google Slides, it’s your ultimate tool for impactful presentations.


7 slides
Feedback Management Infographic
Boost your presentation's impact with our Feedback Management infographic, optimized for Powerpoint, Keynote, and Google Slides. This infographic is an essential asset for professionals looking to present feedback data compellingly and concisely. Designed to convey customer satisfaction metrics and responses effectively, it's perfect for market researchers, customer service managers, and business analysts. The Feedback Management infographic is constructed to visually communicate the importance of customer insights and how they drive business improvements. It transforms complex data into an easy-to-understand format, which is crucial for making informed decisions based on customer feedback. The infographic's structured design assists audiences in comprehending the collected feedback at a glance, highlighting key figures and trends. Whether you're reporting on survey results or showcasing customer reviews, this infographic ensures your data is presented clearly. Compatible with leading presentation software, it allows for smooth integration into your slides, ensuring your feedback analysis stands out. Incorporate this infographic into your presentations to effectively display feedback management data and make a lasting impression.


6 slides
McKinsey Strategy Implementation Model Presentation
Visualize organizational alignment with the McKinsey 7S Model slide. Featuring a clean circular layout, it highlights Strategy, Structure, Systems, Shared Values, Style, Staff, and Skills. Ideal for consulting, planning, or leadership presentations. Fully editable and compatible with PowerPoint, Google Slides, and Keynote for easy customization and branding.


6 slides
Timeline Planning with Gantt Layout Presentation
Organize your schedules clearly with this Timeline Planning with Gantt Layout presentation. Designed for efficient project tracking, this template breaks down tasks across phases and months, using a clean horizontal bar layout. Perfect for teams, planners, and managers. Fully editable in Canva, PowerPoint, and Google Slides to suit any workflow.