


Features
- 6 Unique slides
- Fully editable and easy to edit in Microsoft Powerpoint, Keynote and Google Slides
- 16:9 widescreen layout
- Clean and professional designs
- Export to JPG, PDF or send by email


Do you have any questions?
Recommend


5 slides
Organ Structure Breakdown Slide Presentation
Bring your anatomy data to life with this clear and engaging organ breakdown slide. Designed to visually map out key organ functions or statistics, this layout makes complex info feel simple. Whether you're teaching biology or sharing medical research, it's editable and works with PowerPoint, Keynote, and Google Slides.


5 slides
Live Sports Infographics
Immerse in the dynamic realm of athletics with our live sports infographics. Crafted in a medley of energetic blue, spirited yellow, and various vivid hues, this template radiates the inherent in the world of sports. Its creative and vertical layout, optimized for impact, is perfect for sports journalists. Compatible with Powerpoint, Keynote, and Google Slides. The compelling graphics, icons, and dedicated image placeholders are specifically tailored to encapsulate the pulse-pounding moments and diverse statistics of live sports events. This visually striking, data-centric tool is indispensable for those seeking to convey complex sports information.


8 slides
Scrum Agile Framework Presentation
Visualize your iterative workflows and deliverables with this Scrum Agile Framework Presentation. Designed for Agile teams, this layout simplifies the depiction of Scrum principles—product backlogs, sprints, and reviews—into one cohesive graphic. Ideal for planning meetings, sprint reviews, or stakeholder updates. Fully editable in PowerPoint, Keynote, and Google Slides.


20 slides
Dreamlet Marketing Proposal Presentation
Deliver a persuasive marketing proposal with this sleek and modern presentation template. It covers essential topics such as industry trends, social media strategies, influencer marketing, and customer experience, helping you make a strong impact. Perfect for agencies and businesses alike. Compatible with PowerPoint, Keynote, and Google Slides for easy customization.


20 slides
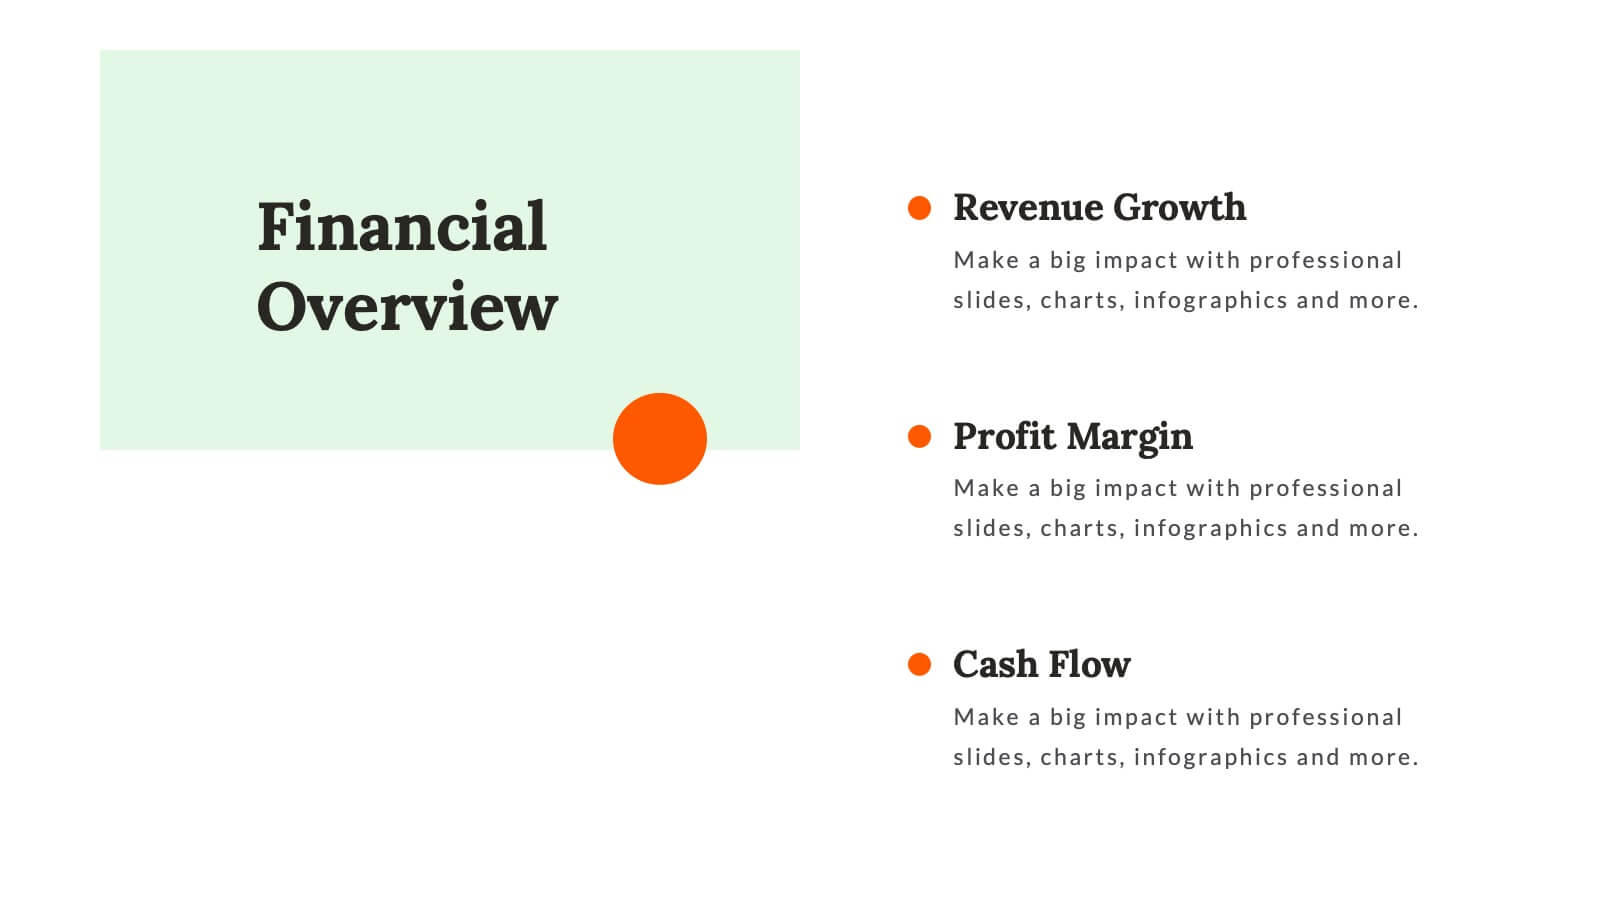
Whirlwind Startup Funding Proposal Presentation
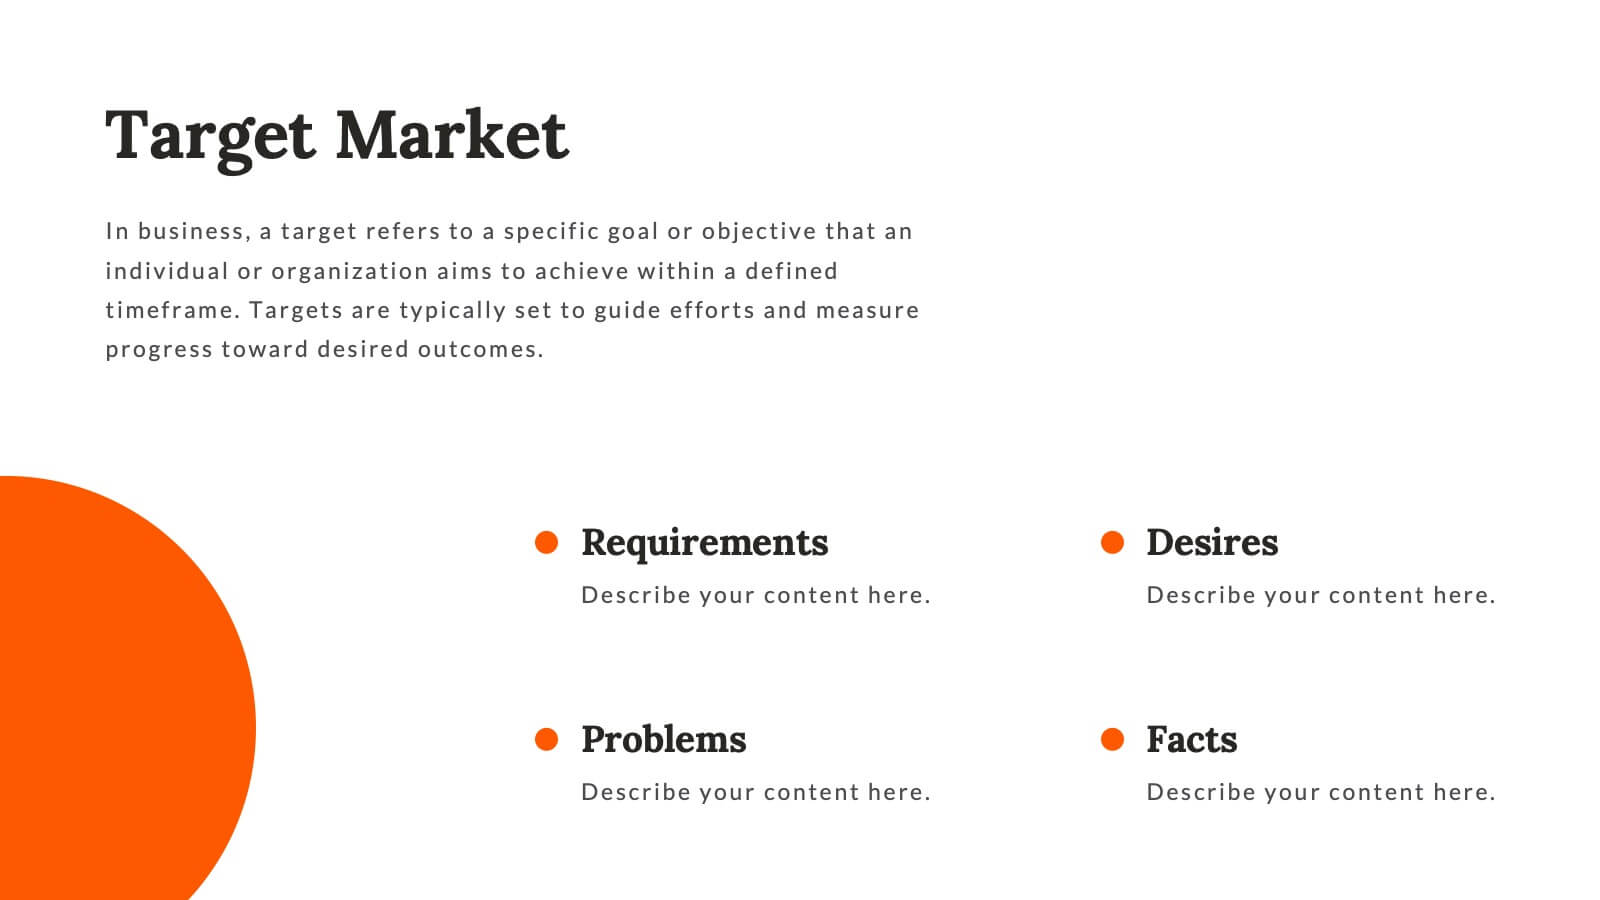
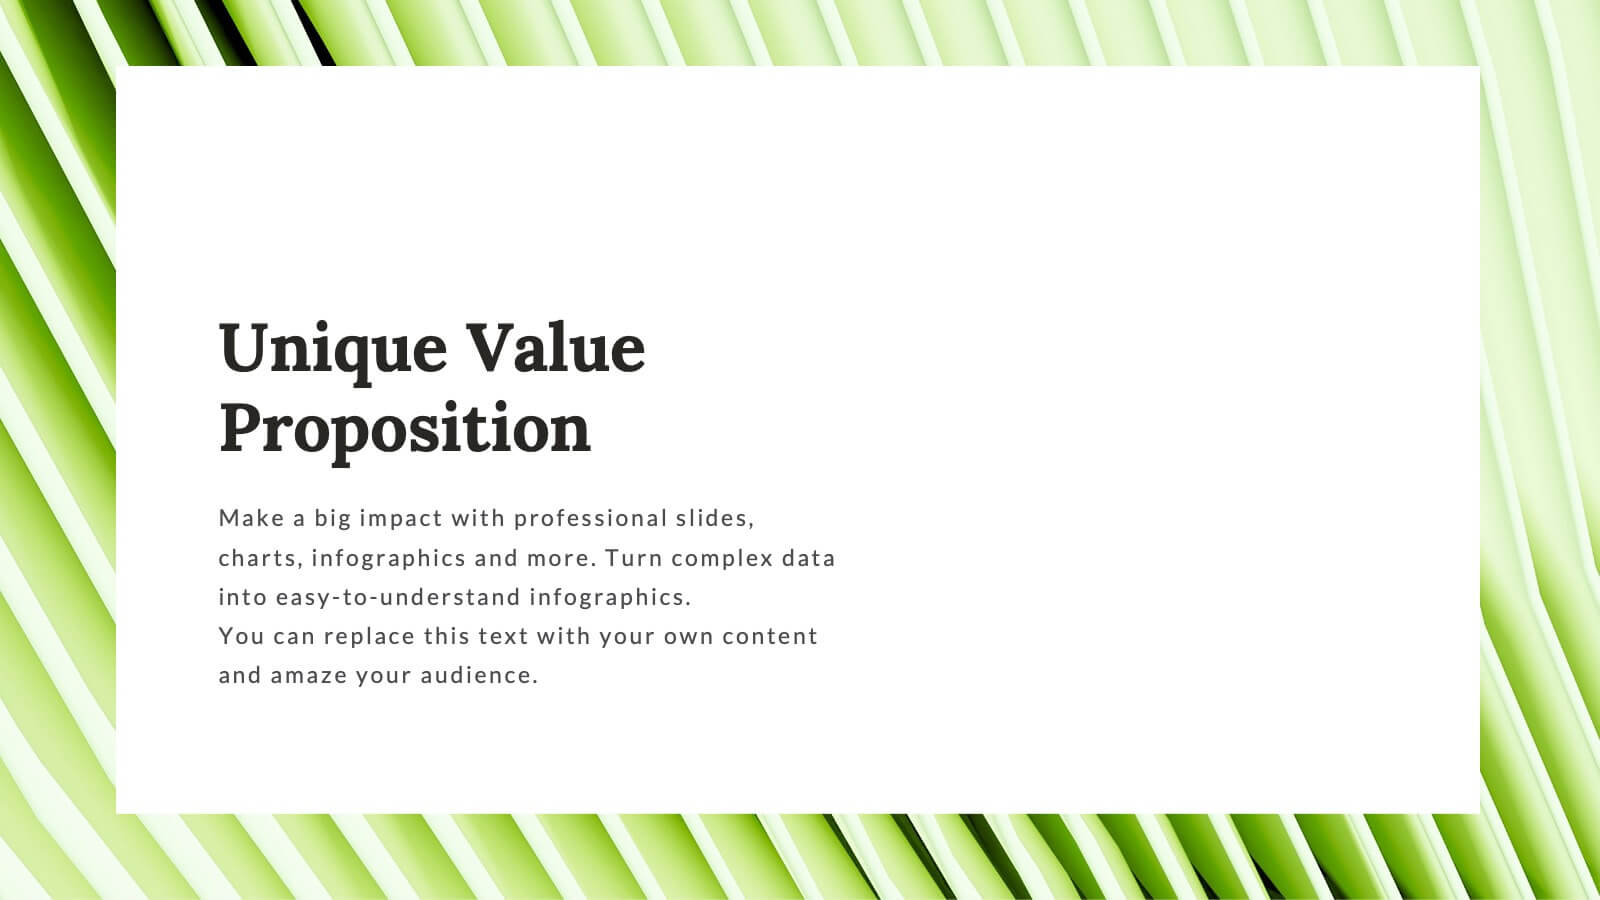
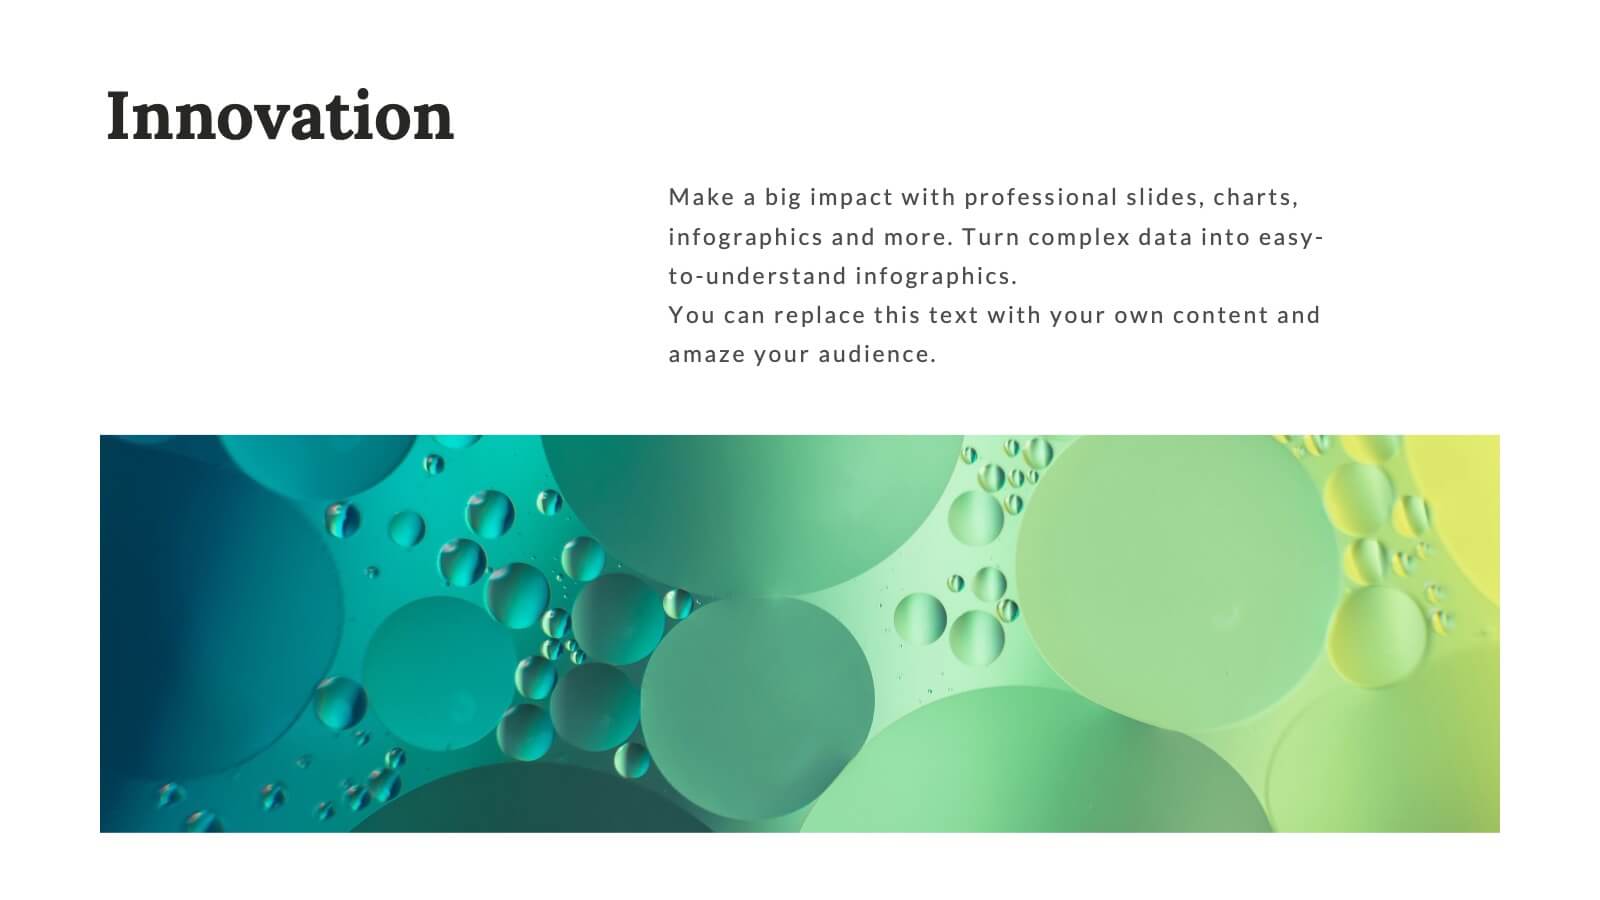
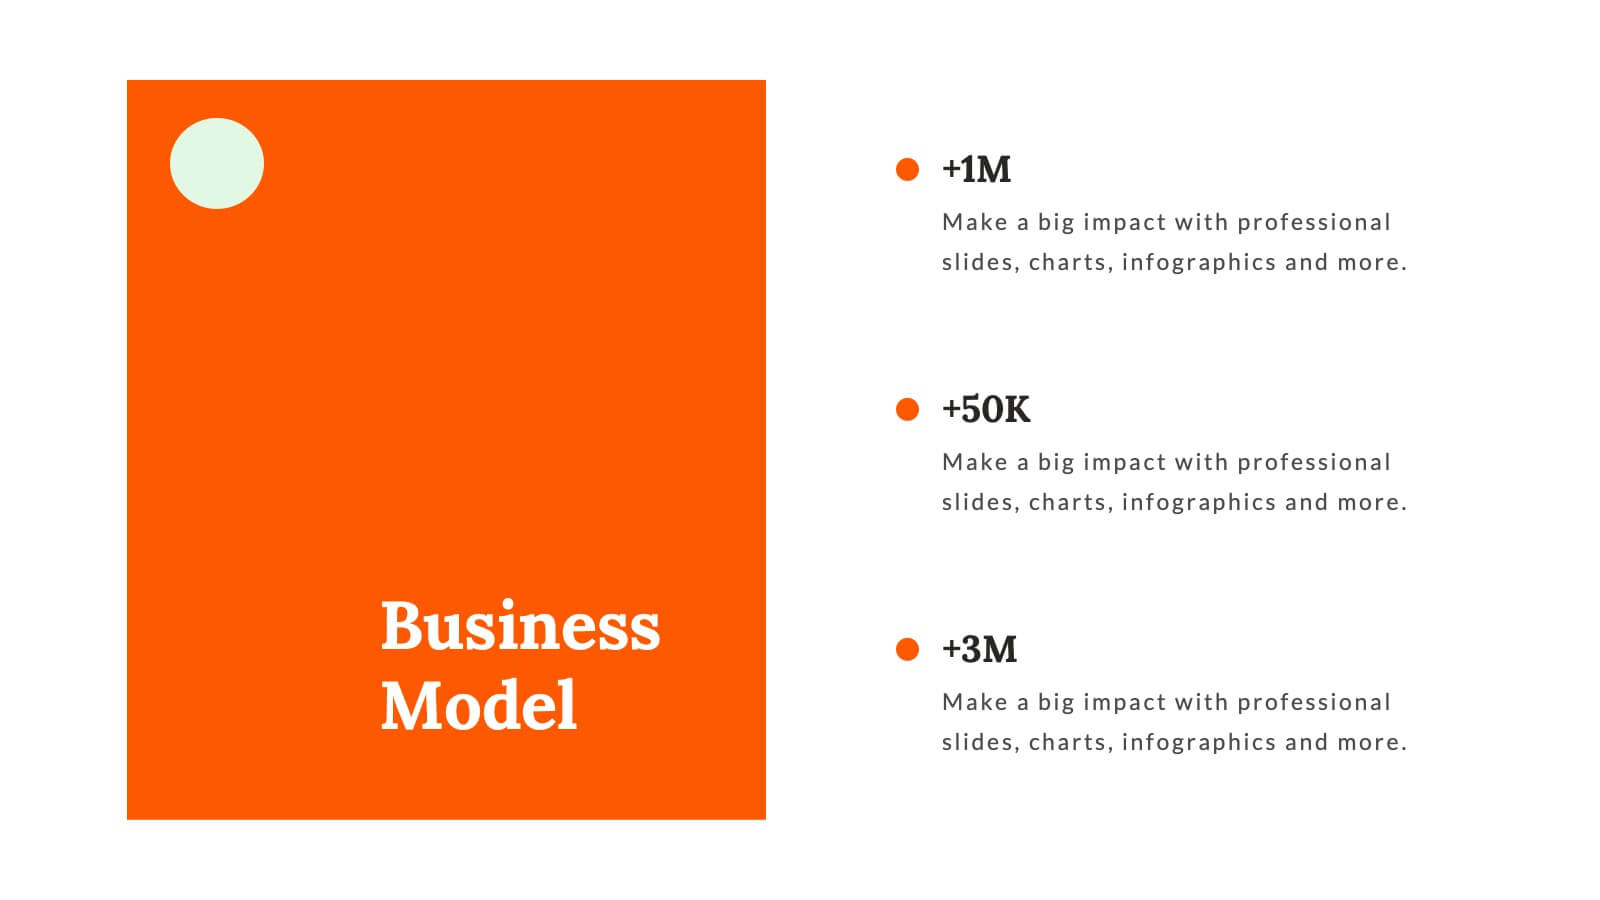
Transform your startup funding proposals with this vibrant and professional template. Designed to impress potential investors, it features sections for mission & vision, founding story, market analysis, and financial overview. Highlight your unique value proposition and business model with clarity and style. This template is compatible with PowerPoint, Keynote, and Google Slides, ensuring seamless presentations on any platform. Perfect for conveying your innovative ideas and growth plans effectively.


5 slides
Banking Security Service Infographics
Navigate the complexities of financial safety with our banking security services infographics template. Dressed in calming pastel tones of cream, blue, purple, and yellow, this invaluable tool is tailored for banking professionals, financial consultants, and cybersecurity experts. Its vertical, creative, and informative design is dense with up-to-date graphics and icons, simplifying intricate data into engaging content. Whether it's for client presentations, or internal communications, this template translates banking security concepts into visually striking, easily understandable infographics, bolstering confidence and comprehension.


16 slides
SEO Research Analysis Presentation
Designed with meticulous attention to detail, this presentation template offers an extensive overview of SEO Analysis Research, perfect for specialists eager to explore the depths of search engine optimization. The initial slide establishes a solid foundation for comprehensive analysis. Following, the 'About' segment delivers a brief yet informative look at the organization's prowess and experience in the realm of SEO. The 'Our Teamwork' slide introduces the team behind the SEO success, showcasing the individuals and their roles. Moving on to 'Strategy,' the template allows for a detailed exposition of the approach and methodologies applied to enhance online visibility. Key metrics are brought to the forefront in a monthly overview, providing insights into traffic sources, content performance, and keyword rankings. The 'SEO Report' highlights significant analytics, such as searches and sign-up rates, emphasizing the impact of the SEO efforts. Complete the presentation with a cordial 'Thank You' to the audience and a 'Credits' slide for resource attribution, ensuring transparency and professionalism. This template is ideal for delivering powerful insights into SEO practices and outcomes.


4 slides
Construction Project Planning
Streamline your workflow and improve clarity with this vibrant project planning wheel designed for construction professionals. This slide helps visualize key phases—such as planning, team coordination, and logistics—using color-coded segments and editable icons. Perfect for architects, contractors, and project managers. Fully customizable in PowerPoint, Keynote, and Google Slides.


6 slides
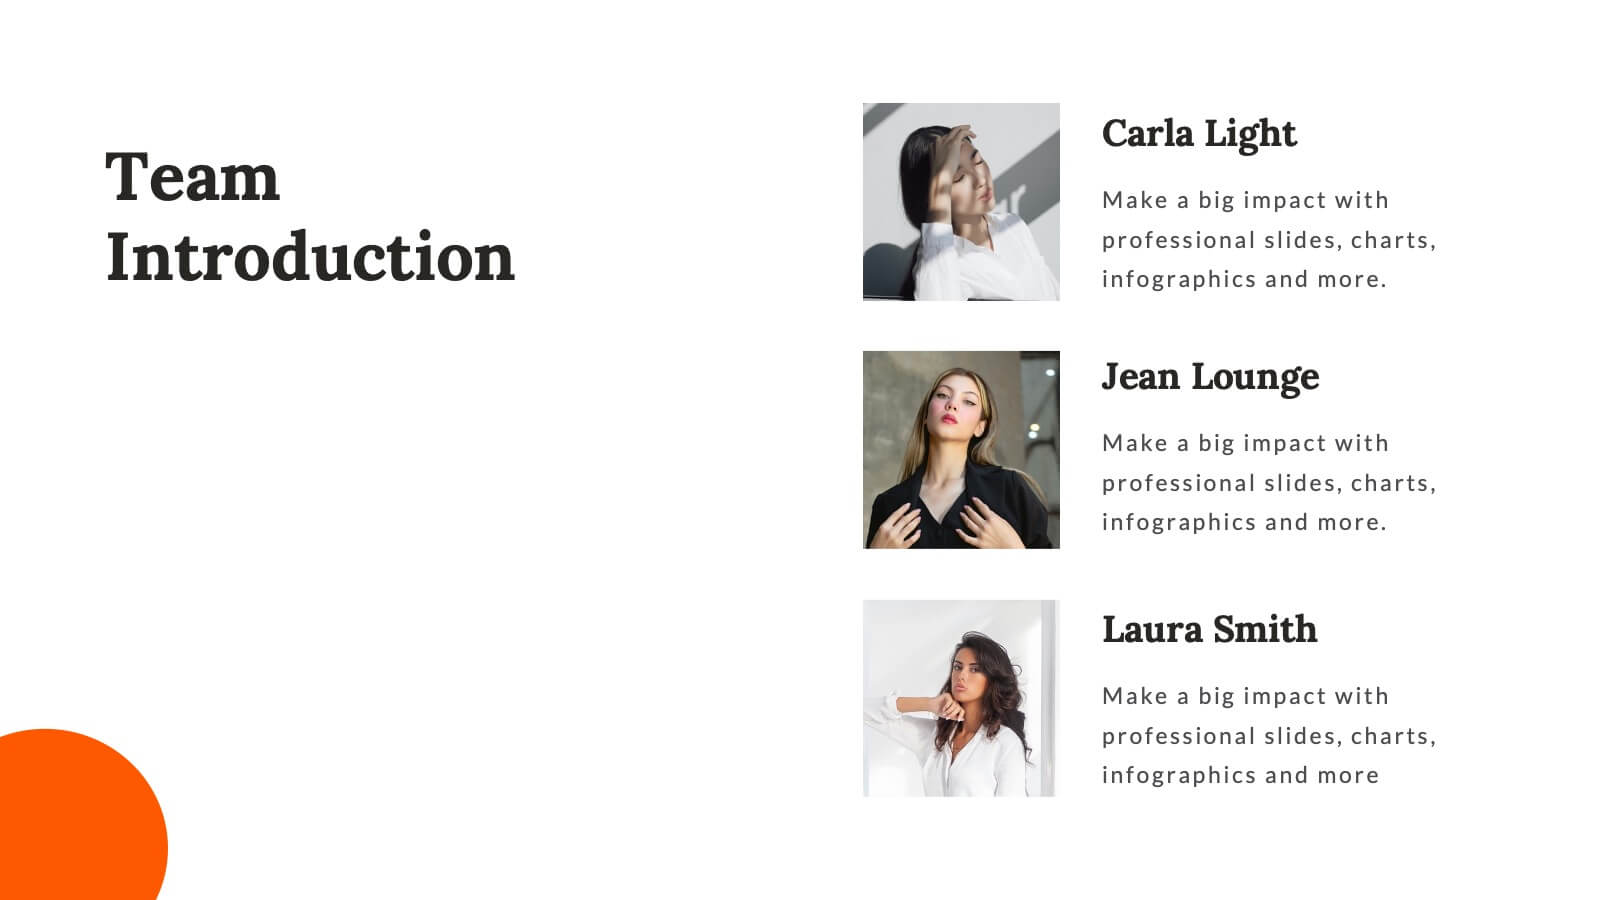
Team Work Environment Infographic
A team work environment refers to the conditions and culture within a group of individuals who come together to work collaboratively on a common goal or project. This infographic template highlights the importance of teamwork and fosters a positive team-oriented workplace culture. The design emphasizes the key elements and benefits of a collaborative work environment, encouraging employees to work together effectively and efficiently. This infographic features illustrations that depict employees working together, collaborating, and supporting one another. This reinforces the idea of teamwork and unity within the organization.


4 slides
Marketing SWOT Assessment Presentation
Analyze your brand’s position with this colorful Marketing SWOT Assessment layout. Clearly outline strengths, weaknesses, opportunities, and threats in a column format, perfect for client reports or strategy sessions. Fully customizable in PowerPoint, Keynote, and Google Slides—ideal for marketers seeking clarity, structure, and visual impact in every presentation.


7 slides
Compliance Gap Analysis Infographic
Navigate the complexities of organizational compliance with our compliance gap analysis infographic. Using a vibrant palette of orange, white, and green, this infographic elucidates the differences between current compliance practices and desired standards. Specifically designed for business analysts, compliance officers, and risk managers, this template is an invaluable tool to identify, analyze, and bridge compliance-related gaps. With its fun yet informative style, communicating these insights becomes more engaging and understandable. This infographic is ready for integration with PowerPoint, Keynote, and Google Slides, ensuring smooth presentations across various platforms.


5 slides
Agile Project Roadmap Presentation
Visualize your quarterly project plans with clarity using this Agile roadmap slide. Designed with a horizontal layout for Q1 to Q4, this infographic includes three workstreams and color-coded bars to represent initiatives or sprints. Icons provide quick visual cues for different teams or objectives. Ideal for agile teams, product managers, or project leads who need a clean, editable layout. Compatible with PowerPoint, Keynote, and Google Slides.


5 slides
Sustainable Fashion Infographics
Sustainable fashion, also known as eco-fashion or ethical fashion, is an approach to clothing and accessories that aims to minimize the negative environmental and social impacts of the fashion industry. These vertical templates are designed to raise awareness about sustainable practices in the fashion industry. They aim to educate viewers about the environmental and social impacts of fast fashion and highlight the importance of adopting sustainable fashion choices. The template incorporates relevant statistics and facts about the fashion industry's impact on the environment and society. Compatible with Powerpoint, Keynote, and Google Slides.


6 slides
Harvey Ball Analysis Infographic
The Harvey Ball Analysis, often referred to as the Harvey Ball Method or simply the Harvey Ball, is a visual representation technique used for comparative assessment. This infographic template visually represents data using Harvey Balls, which are simple circular icons that can be filled or unfilled to represent different levels of a specific attribute. The infographic involves using a series of circles, typically colored, to represent and compare different items or variables. This template is perfect for businesses and decision-making to visually communicate the relative performance or significance of various options, elements, or categories.


4 slides
3-Level Tree Chart Presentation
Grow your ideas from concept to execution with this beautifully designed visual layout. Perfect for showcasing layered strategies, hierarchical processes, or business development stages, it balances clarity and creativity through a clean, tree-inspired design. Fully editable and compatible with PowerPoint, Keynote, and Google Slides for seamless professional use.


6 slides
State-by-State Business Distribution Map Presentation
Visualize regional performance with this State-by-State Business Distribution Map template. Ideal for showcasing business coverage, sales territories, or demographic trends across the U.S. Each state is color-coded for clarity, with editable text and icons. Fully compatible with PowerPoint, Keynote, and Google Slides—perfect for executives, marketers, or analysts.


26 slides
Efficient Time Management Presentation
Optimize your time management skills with a presentation designed to streamline your productivity. The template offers a professional and calming color palette, encouraging focus and clarity. It's structured to address the key principles of time management, from prioritizing tasks to strategic planning. Within the slides, you’ll find tools to introduce time management concepts, team profiles to assign roles efficiently, and charts to monitor progress. Engaging graphics and infographics are used to outline processes and time allocation, making it easier to visualize effective time management strategies. This template is a perfect match for workshops, personal organization sessions, or corporate training programs, compatible with popular platforms like PowerPoint, Keynote, and Google Slides. It’s designed to aid professionals and teams in harnessing their time effectively, ensuring every second counts towards achieving their goals.