


Features
- 4 Unique slides
- Fully editable and easy to edit in Microsoft Powerpoint, Keynote and Google Slides
- 16:9 widescreen layout
- Clean and professional designs
- Export to JPG, PDF or send by email


Do you have any questions?
Recommend


5 slides
Creative Bubble Map Infographic Presentation
Bring your ideas to life with dynamic visuals that make connections clear and storytelling effortless. This modern infographic presentation is perfect for showcasing relationships, categories, or data insights in a bold and engaging way. Fully editable and compatible with PowerPoint, Keynote, and Google Slides for seamless customization.


10 slides
Social Media Marketing Growth Presentation
Boost your social media strategy with this dynamic infographic template! Perfect for illustrating marketing growth, engagement tactics, and content performance, it features an intuitive flow that simplifies complex data. Ideal for presentations to teams and clients, it’s fully customizable and works seamlessly with PowerPoint, Keynote, and Google Slides.


7 slides
Brain Balance Infographic
Introducing our brain infographic template, it's a colorful, engaging and professional brain diagram. This template is designed for a wide range of applications such as education, blogging, social media, marketing, presentations and other types of projects. This infographic is very easy to edit and customize. Fully customizable and compatible with Powerpoint, Keynote, and Google Slides, you can change text, colors and shapes with just one click. This infographic is perfect for any company that wants to show off their colorful personality. Create an infographic that will get people excited about your brand filled with facts and important information!


22 slides
Cascade Brand Identity Presentation
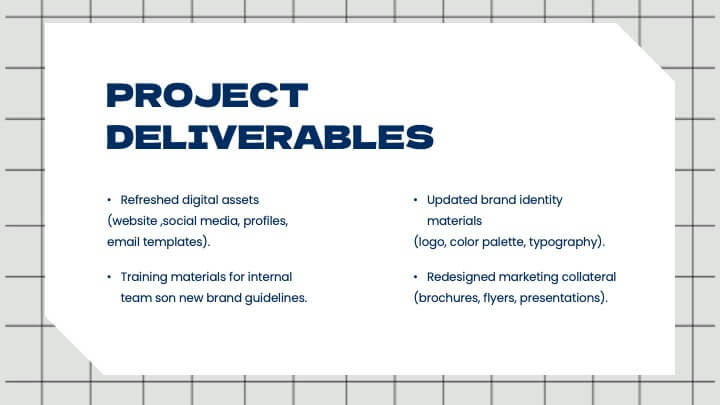
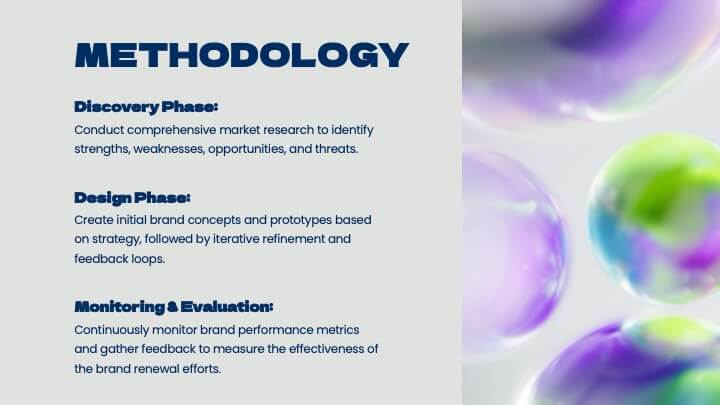
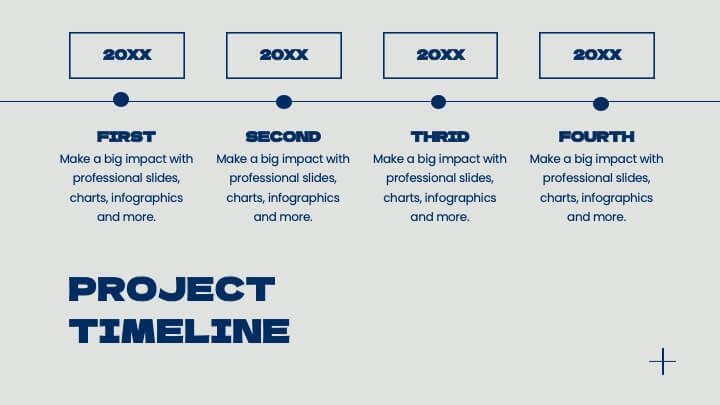
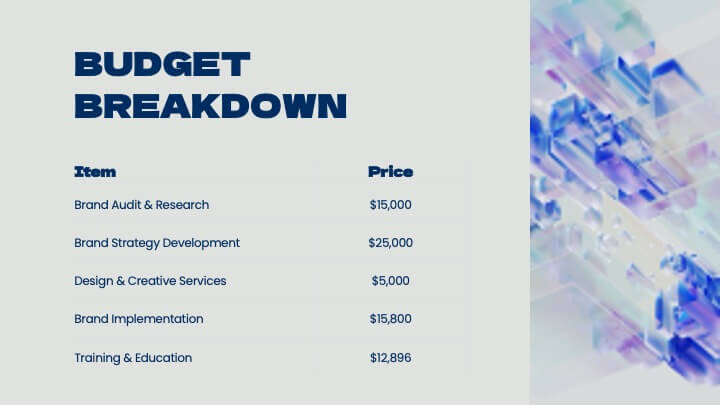
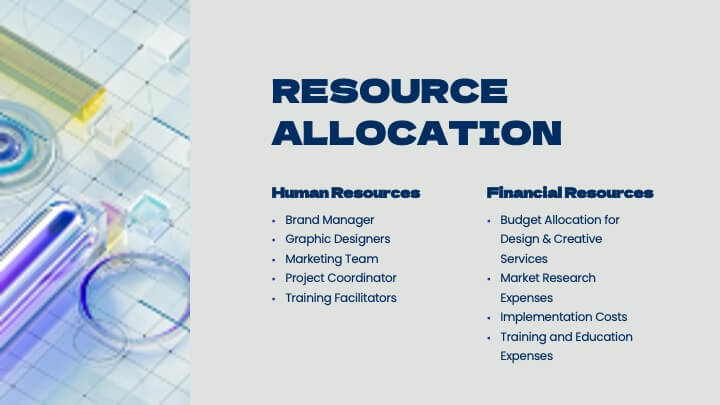
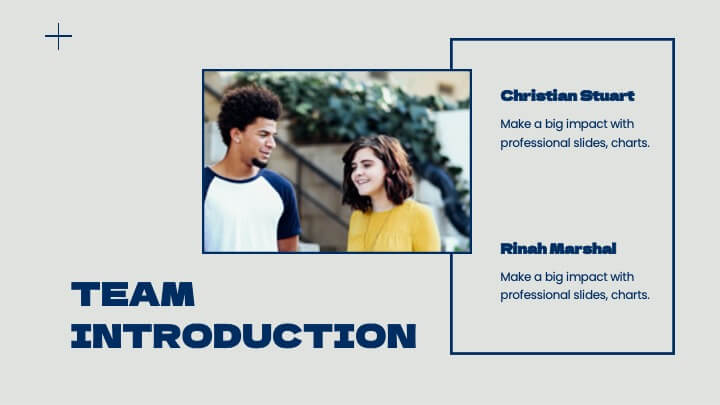
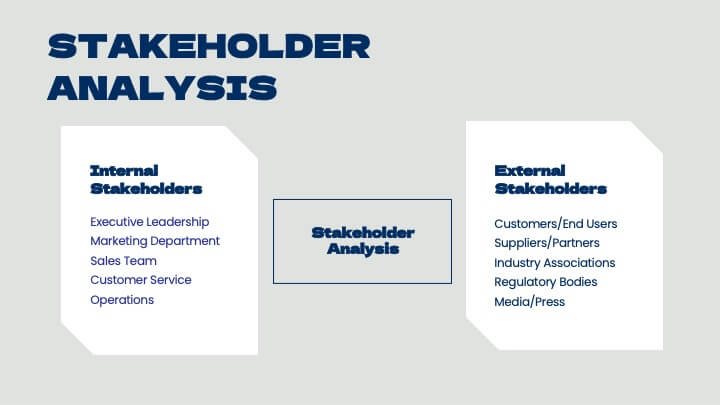
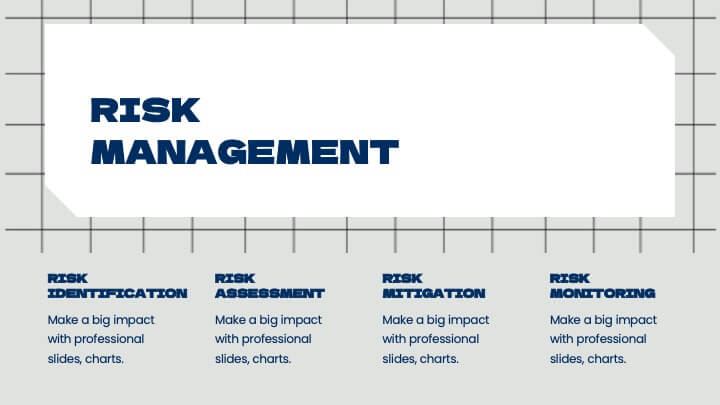
Define and refine your brand with this brand identity presentation template, designed in deep blue tones. It covers all brand development aspects, from introduction to market analysis, brand values, and competitive landscape. Compatible with PowerPoint, Google Slides, and Keynote, it's ideal for creating a compelling brand narrative.


21 slides
Ceres Financial Report Presentation
This financial report template is designed to showcase performance metrics, sales analysis, project progress, and strategic insights with clarity and professionalism. Featuring slides for operational updates, competitor insights, and recommendations for improvement, it ensures a comprehensive financial overview. Compatible with PowerPoint, Keynote, and Google Slides for flexible presentations.


15 slides
Business Roadmap Infographic
A business roadmap is a strategic plan that outlines the goals, milestones, and key initiatives a company intends to achieve over a specific period. This infographic template is designed to showcase the strategic journey and future goals of a business or organization. This infographic presents a clear and concise overview of the business's roadmap, highlighting key milestones, objectives, and action plans for achieving success. The infographic features a horizontal timeline that represents the business's journey from its inception to the envisioned future milestones. Each milestone is accompanied by a brief description or icon to provide context.


23 slides
Fama Business Idea Pitch Deck Presentation
Present your business idea with this impactful pitch deck, covering key areas like problem statement, solutions, competitive landscape, financials, and growth projections. With a bold design, it effectively showcases your startup’s value proposition. Compatible with PowerPoint, Keynote, and Google Slides for dynamic and professional investor presentations.


5 slides
Innovation in Digital Technologies Presentation
Highlight key advancements with this Innovation in Digital Technologies Presentation. Designed with four modern icon segments, this slide helps communicate your digital transformation journey clearly. Ideal for showcasing emerging tools, platforms, or strategies. Fully editable in Canva, PowerPoint, or Google Slides for seamless integration into any tech-focused presentation.


12 slides
Personal Portfolio Presentation
Our Personal Portfolio Presentation template is designed for professionals looking to make a strong impression with a sleek and engaging portfolio. This comprehensive template provides an excellent framework to showcase your personal brand, professional journey, and achievements. The opening slide, with your name boldly presented, acts as your introduction. It's followed by a 'Get to know me' section that offers a glimpse into your personality and work ethic. The 'Skills' slide is a visually impactful way to present your competencies, while the 'Experience' slide chronologically outlines your professional milestones. Featuring sections for detailed case studies, showcased projects, and educational background, this template helps you tell your story in a cohesive and captivating manner. The 'Recognitions' slide allows you to highlight awards and honors, adding credibility to your profile. Ending with a compelling 'Let's work together!' call-to-action, this template is adaptable to PowerPoint, Keynote, and Google Slides, perfect for anyone looking to stand out in their field.


7 slides
Idea Clustering Mind Map Presentation
Great ideas become clearer when you can see how everything connects, and this presentation makes that process effortless. It helps you organize thoughts, group related concepts, and visually map creative themes for planning or strategy discussions. Clean, modern, and easy to customize. Fully compatible with PowerPoint, Keynote, and Google Slides.
8 slides
3-Step Arrow Process Flow Presentation
Kickstart your message with a bold, directional visual that makes every step feel clear and intentional. This presentation showcases a simple three-stage progression ideal for explaining workflows, strategies, or business processes with clarity and impact. Easy to customize and fully compatible with PowerPoint, Keynote, and Google Slides.


26 slides
Roaster Presentation Template
Are you interested in knowing about the best coffee in town? Roaster is a fresh and bold template perfect for marketing. This template will be sure to make your services and products stand out. The background stays in theme with coffee tone colors and many pictures. Overall Roaster can help you make any kind of presentation you need and help you create a professional online presence. This template is a great starting point for creating an impressive sales page. You'll be able to quickly add in your information and customize this template to display a captivating presentation.


21 slides
Minoan Project Timeline Presentation
Step back in time with this beautifully crafted Minoan-inspired presentation, perfect for outlining your project timeline! With an elegant design and clear structure, this template helps you showcase key milestones, deadlines, and deliverables in a visually stunning way. Keep your project on track. Compatible with PowerPoint, Keynote, and Google Slides.


5 slides
Cryptocurrency Investment Infographics
Cryptocurrency Investment refers to the practice of buying, holding, or trading digital currencies as a form of investment. These infographic templates allow you to effectively present information about cryptocurrency investment, demystify the subject, and empower individuals to explore and navigate the world of digital currencies with confidence. Use these infographics to educate and inform individuals about the world of cryptocurrency investment. These aim to provide key information and insights to help people make informed decisions when it comes to investing in cryptocurrencies. Compatible with Powerpoint, Keynote, and Google Slides.


5 slides
Impacts of Fake News Infographics
Fake News refers to deliberately false or misleading information presented as factual news. The spread of fake news can have significant impacts on individuals, society, and even the democratic process. With this infographic template, you can effectively communicate the far-reaching consequences of fake news and encourage critical thinking and media literacy. Whether you're presenting to a classroom, sharing on social media, or creating educational materials, this template serves as a powerful tool to raise awareness and promote responsible consumption of information in the digital era. Compatible with Powerpoint, Keynote, and Google Slides.


6 slides
Roles and Responsibilities for Teams Presentation
Clearly outline team functions with this roles and responsibilities presentation. Highlight up to five individual positions using intuitive icons and clean visual layouts. Perfect for onboarding, team structuring, or project assignments. Fully editable in PowerPoint, Keynote, and Google Slides—ideal for aligning expectations and improving team collaboration across departments or initiatives.


5 slides
Empowered Leadership and Influence Strategy
Showcase impactful leadership journeys with the Empowered Leadership and Influence Strategy Presentation. This slide features a bold mountain-style layout that symbolizes growth, with five colorful peaks representing key leadership steps or principles. Perfect for professional development workshops, executive coaching, or team-building presentations. Fully editable and compatible with PowerPoint, Keynote, and Google Slides.