


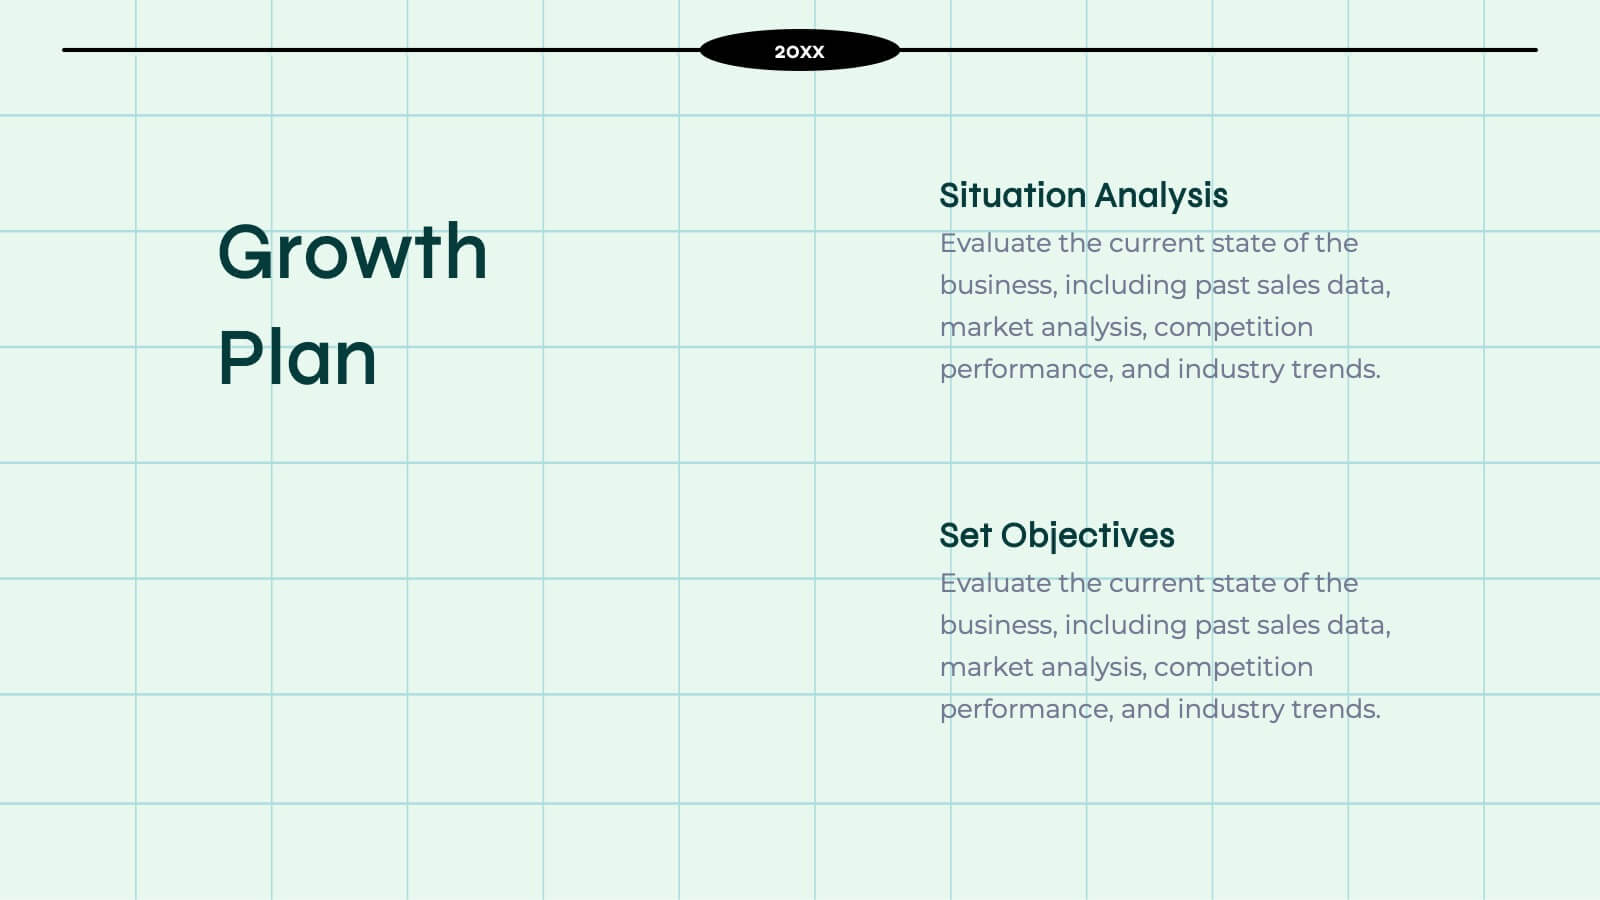
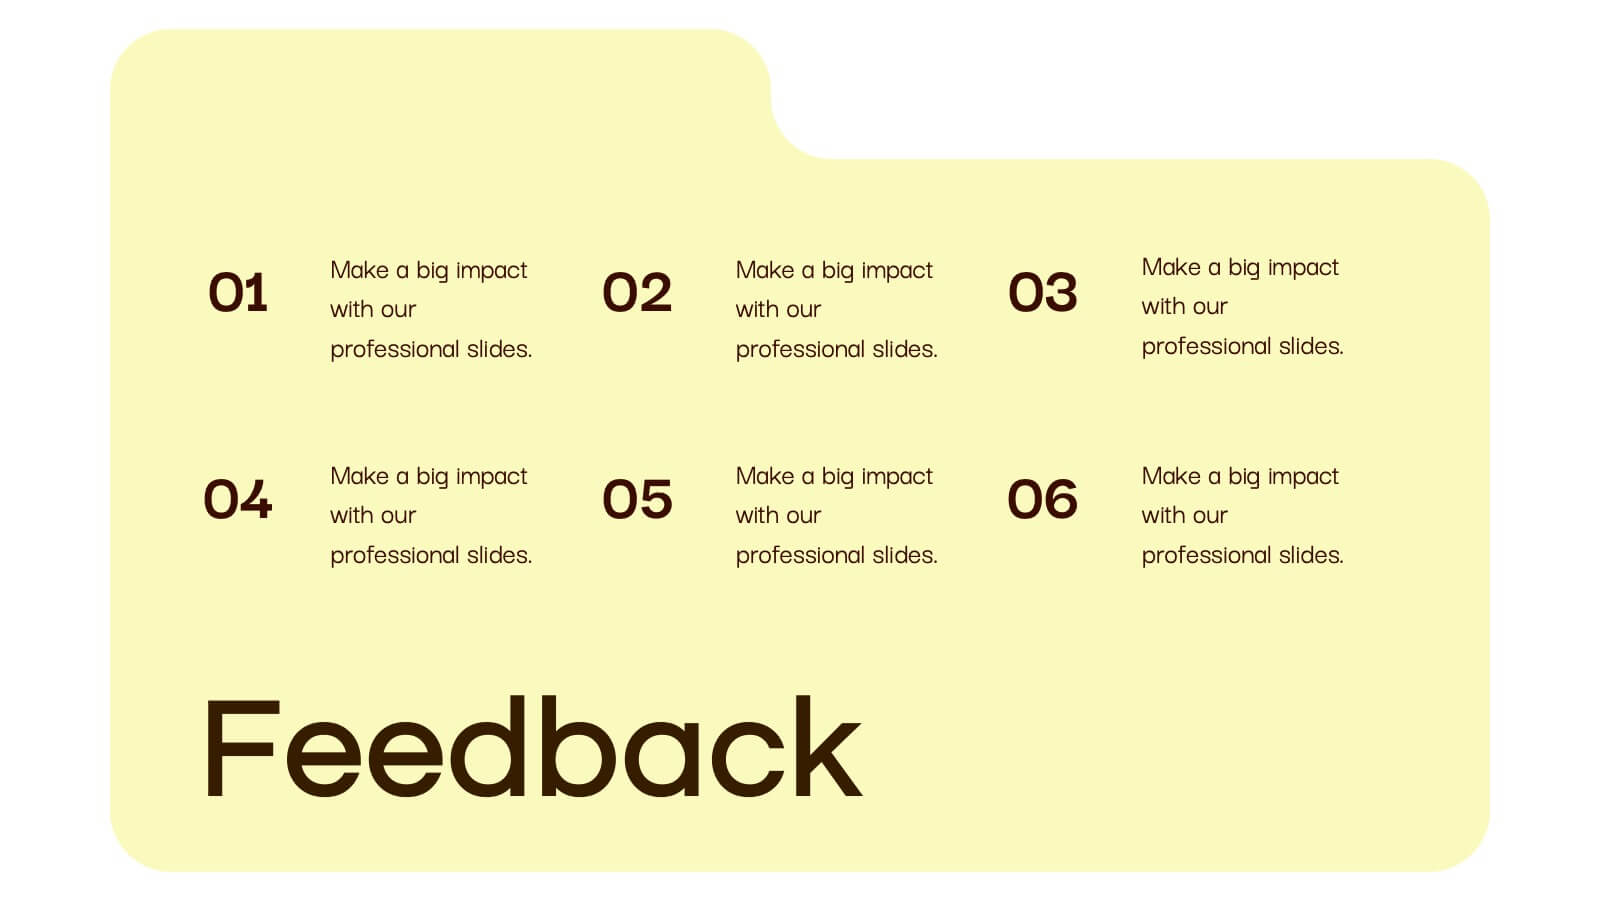
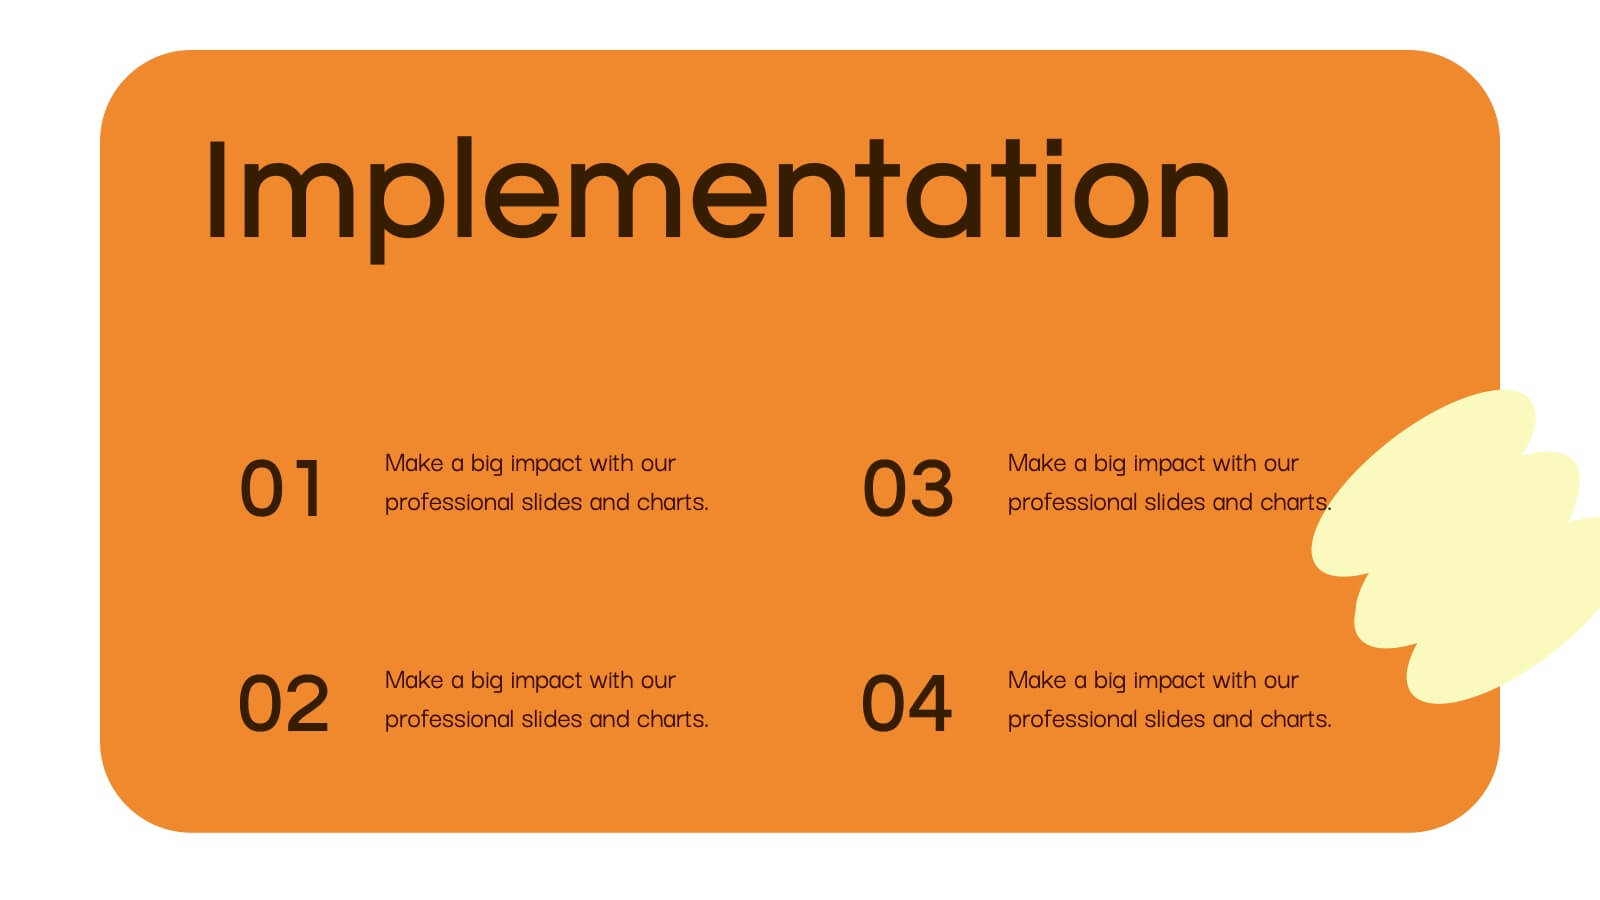
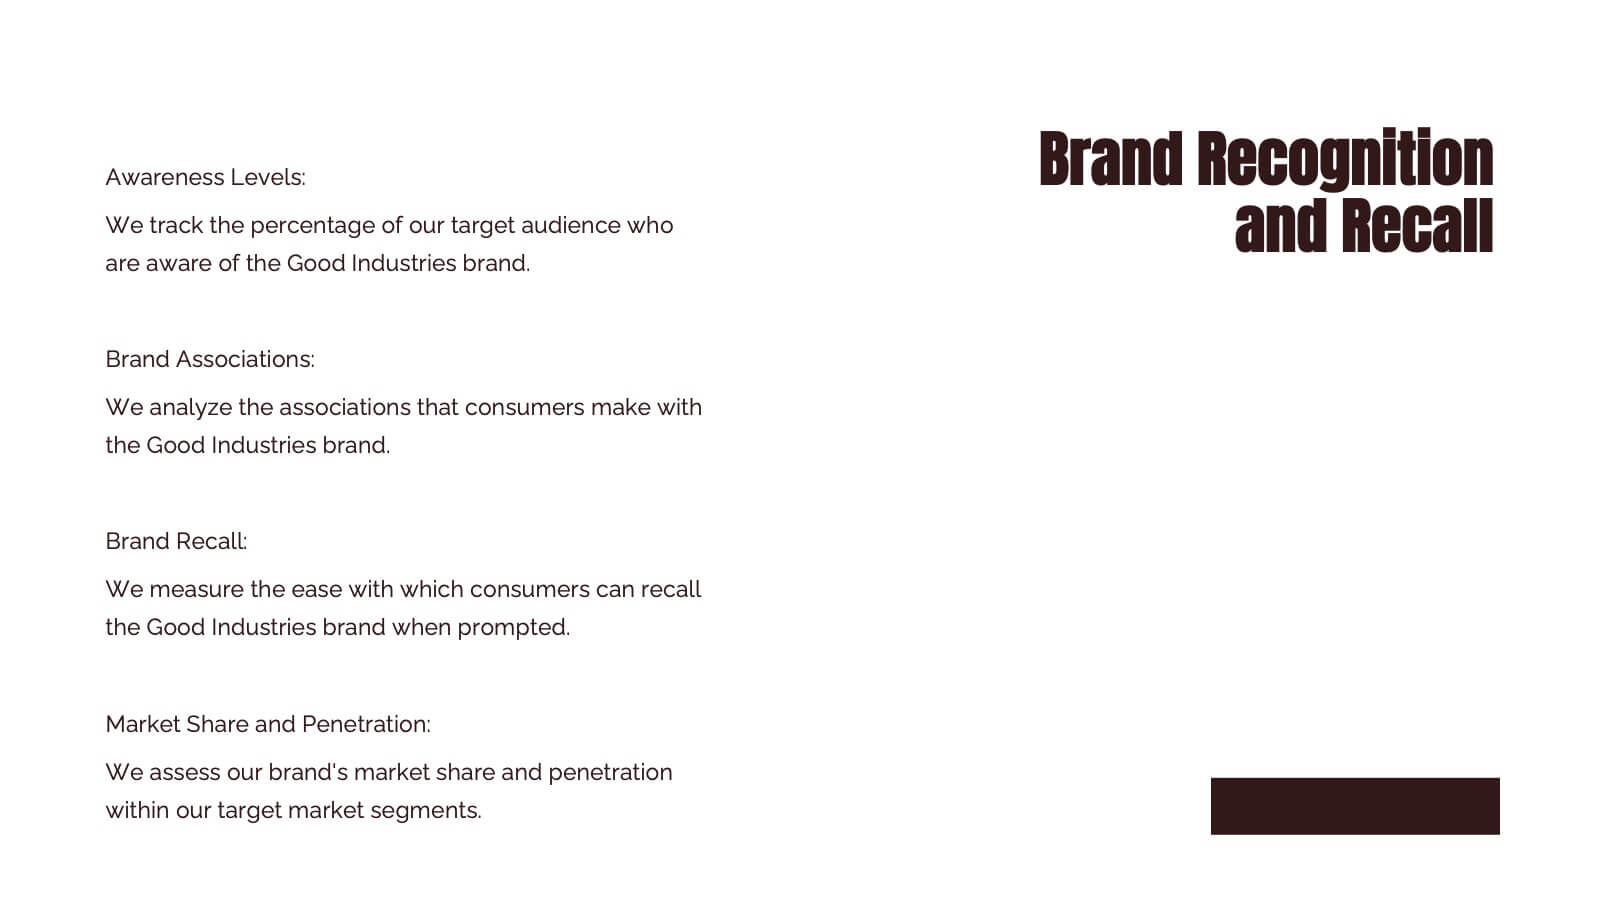
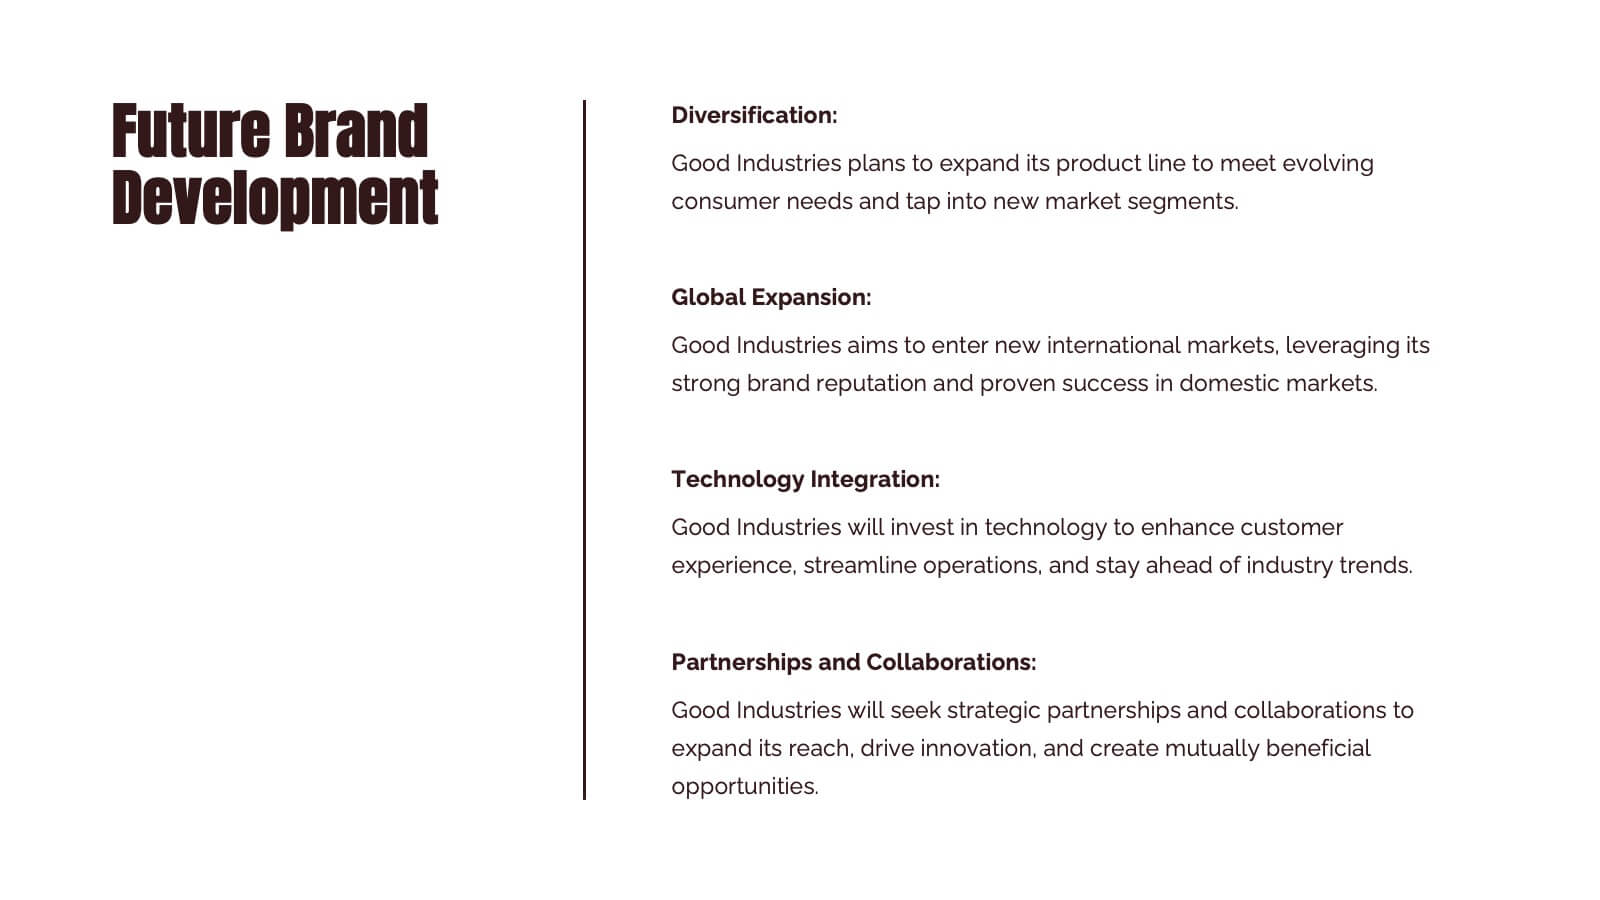
Features
- 6 Unique slides
- Fully editable and easy to edit in Microsoft Powerpoint, Keynote and Google Slides
- 16:9 widescreen layout
- Clean and professional designs
- Export to JPG, PDF or send by email


Do you have any questions?
Recommend


5 slides
Concept Overlap with Venn Diagram Presentation
Visually map overlapping concepts and relationships with this four-circle Venn diagram slide. Perfect for presenting interdependencies, cross-functional insights, or product comparisons. Each section includes editable labels and icons to personalize your content. Compatible with PowerPoint, Keynote, and Google Slides—ideal for business strategies, brainstorming sessions, and collaborative team presentations.


20 slides
Alchemy Sales Forecast Presentation
Elevate your sales strategy with this sleek and modern sales forecast presentation template. Featuring sections for sales objectives, pricing strategies, performance metrics, and future opportunities, it’s perfect for teams aiming to analyze and plan effectively. Fully compatible with PowerPoint, Keynote, and Google Slides for seamless professional presentations.


23 slides
Kitsune Startup Strategy Presentation
This startup strategy template is designed for clear communication of business vision, target market, and unique value proposition. It also includes slides for marketing strategies, team introduction, and financial overview. Its clean, professional layout makes it ideal for investors or stakeholders. Compatible with PowerPoint, Keynote, and Google Slides for easy customization.


5 slides
Suicide Awareness Stats Infographics
Navigate the sensitive topic of suicide with the suicide awareness stats infographics template. Crafted with care in shades of blue, white, and purple, this vertical, informative infographic serves as a profound educational tool. It is essential for mental health advocates, educational institutions, and community outreach programs, offering a respectful yet impactful way of presenting statistics and information. The template includes thoughtfully designed graphics, relevant icons, and placeholders for real-world images, ensuring the data speaks volumes in raising awareness, promoting prevention, and supporting life-affirming actions within various communities.


4 slides
Budget Projection with Predictive Analysis Presentation
Visualize future financial outcomes with clarity using the Budget Projection with Predictive Analysis Presentation. This modern funnel-style layout helps break down key stages of budget forecasting, making it easy to communicate progressions and data-driven insights. Perfect for financial planning, reporting, or strategic reviews. Fully editable in PowerPoint, Google Slides, Keynote, and Canva.


7 slides
Six Sigma Project Infographic
Six Sigma is a data-driven methodology and quality improvement approach that aims to eliminate defects and reduce variation in processes. This infographic template is a visual representation of the Six Sigma methodology, which is a data-driven approach used by organizations to improve their processes and reduce defects. The infographic aims to explain the key concepts and steps involved in the Six Sigma process in a clear and concise manner. It is designed to help individuals understand the methodology and its benefits, and can be used as a reference tool for Six Sigma practitioners and those interested in process improvement.


5 slides
Digital Marketing Strategy Roadmap
Visualize your marketing initiatives step-by-step with this clean, arrow-driven roadmap design. Ideal for showcasing campaign planning, funnel stages, or content rollouts, this slide helps keep your strategy clear and easy to follow. Fully editable and compatible with PowerPoint, Keynote, and Google Slides.


20 slides
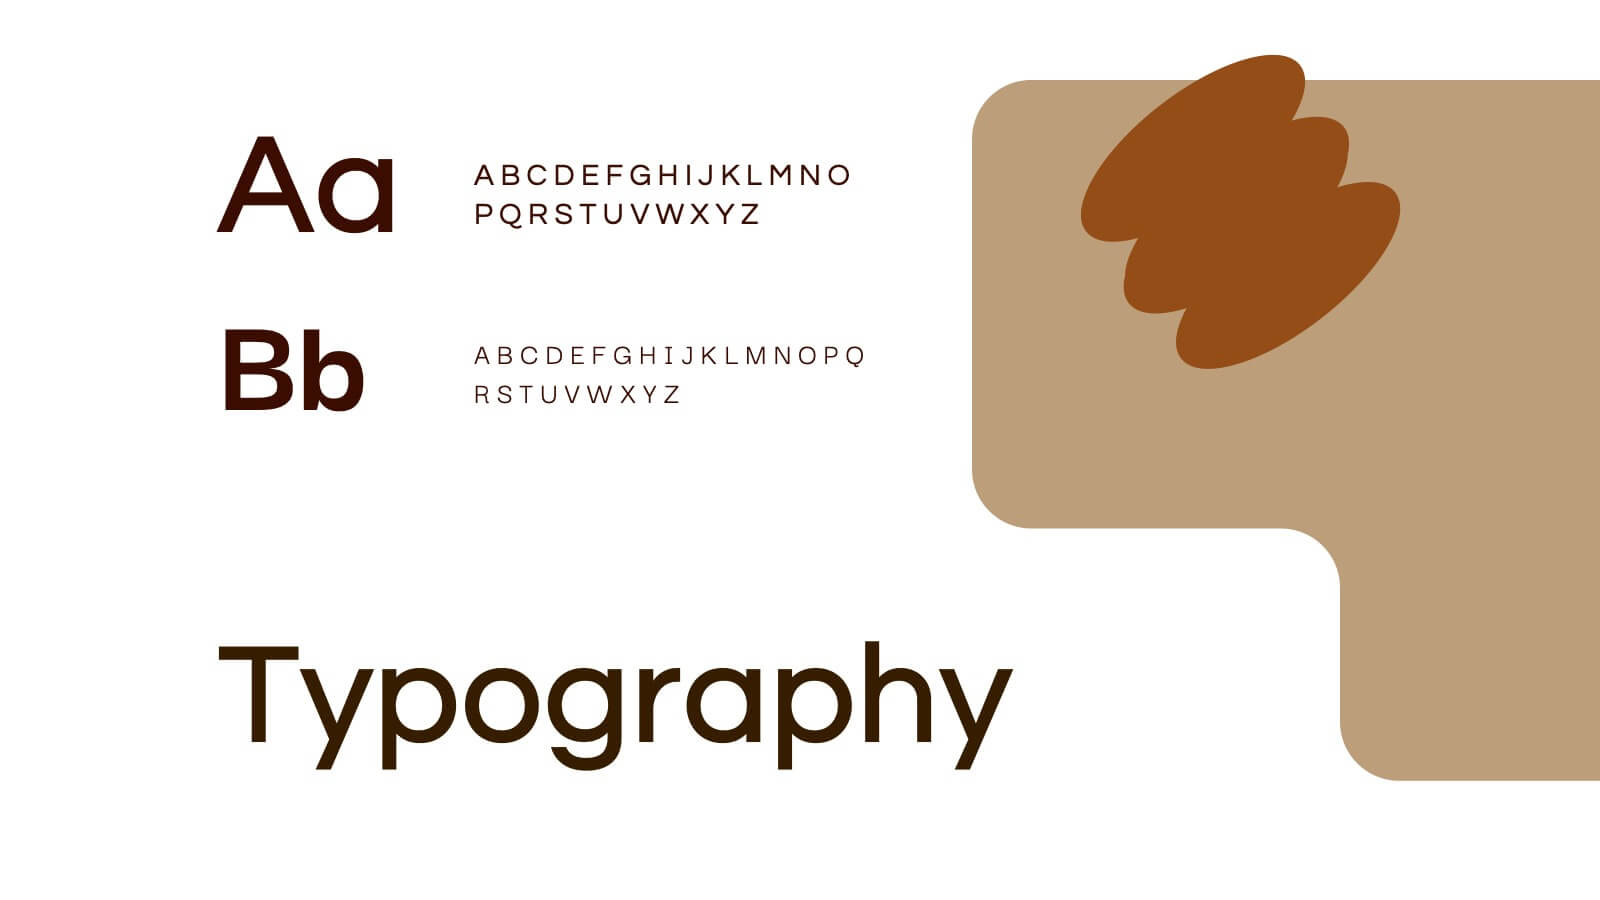
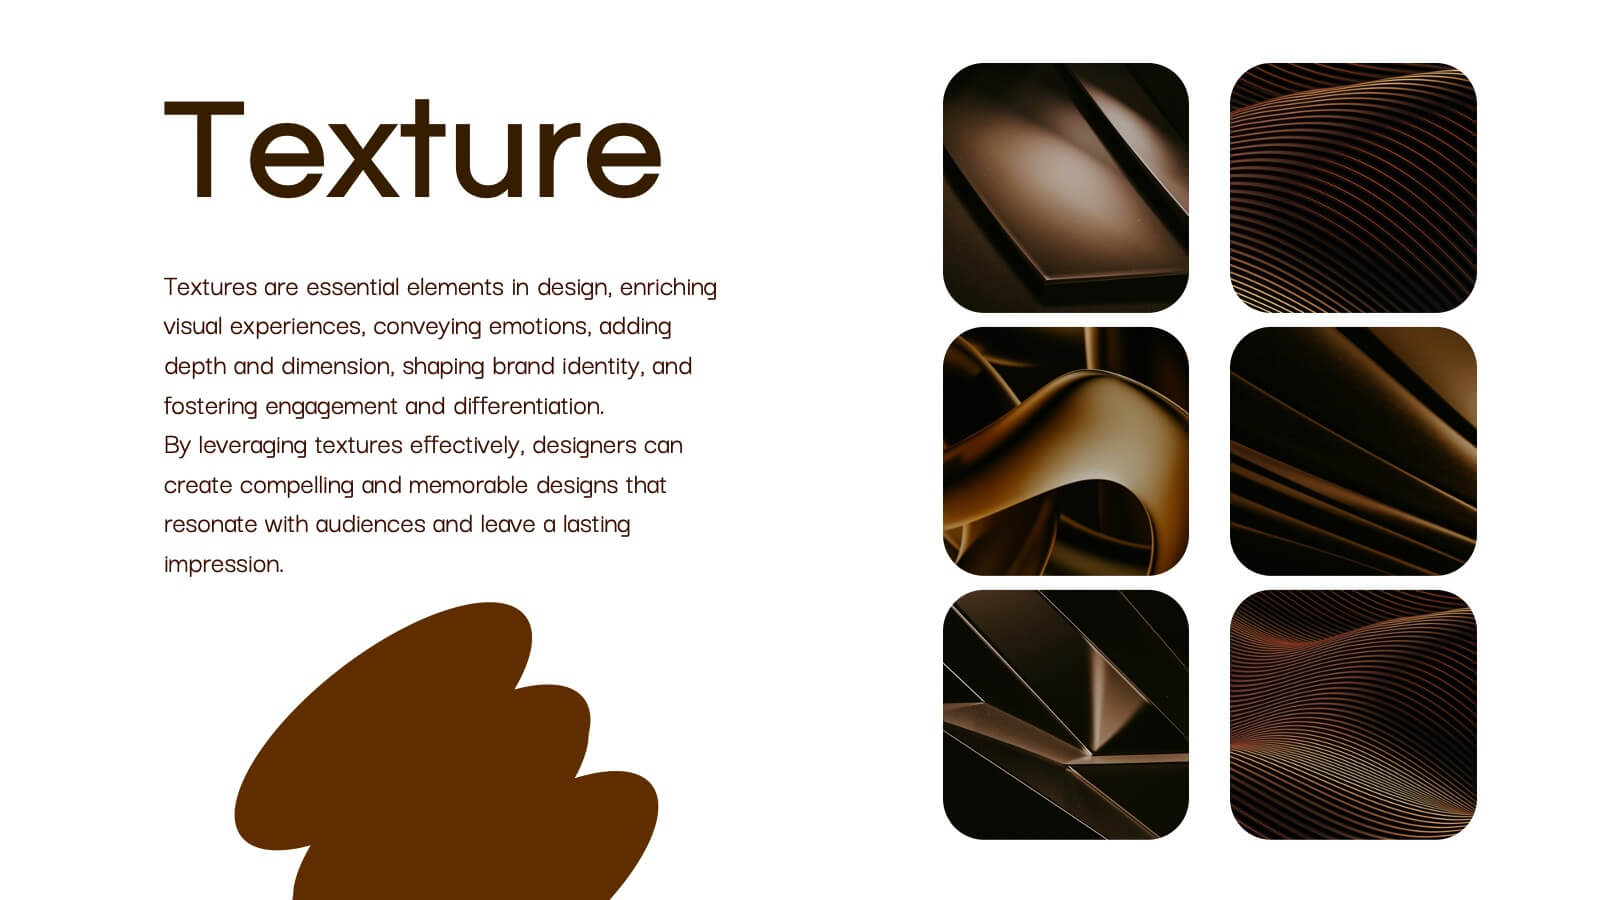
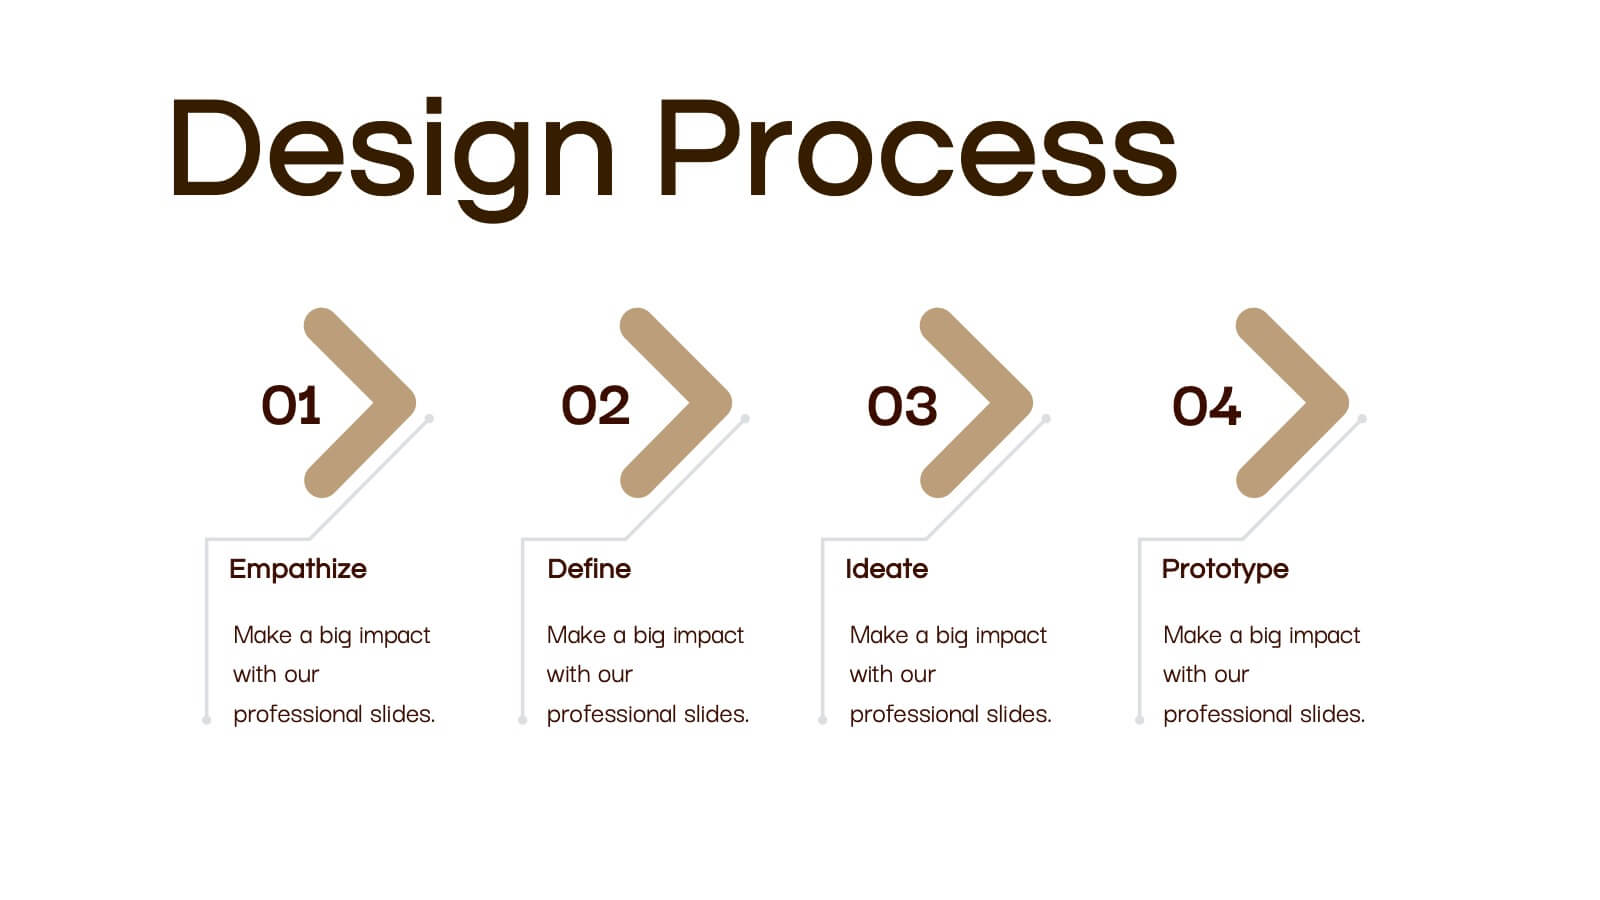
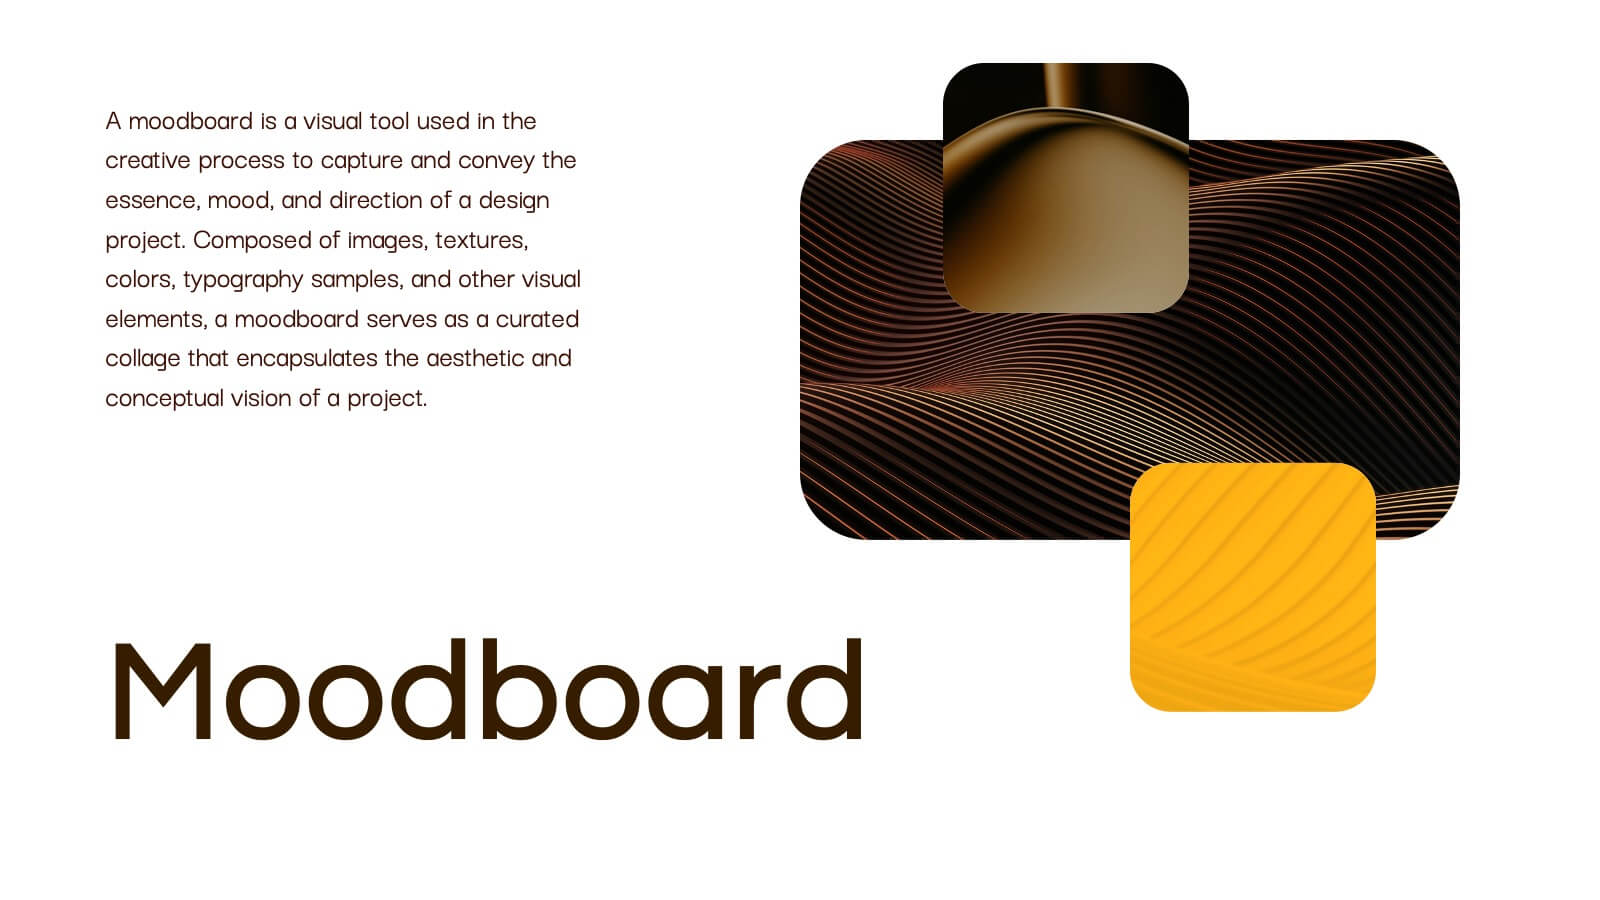
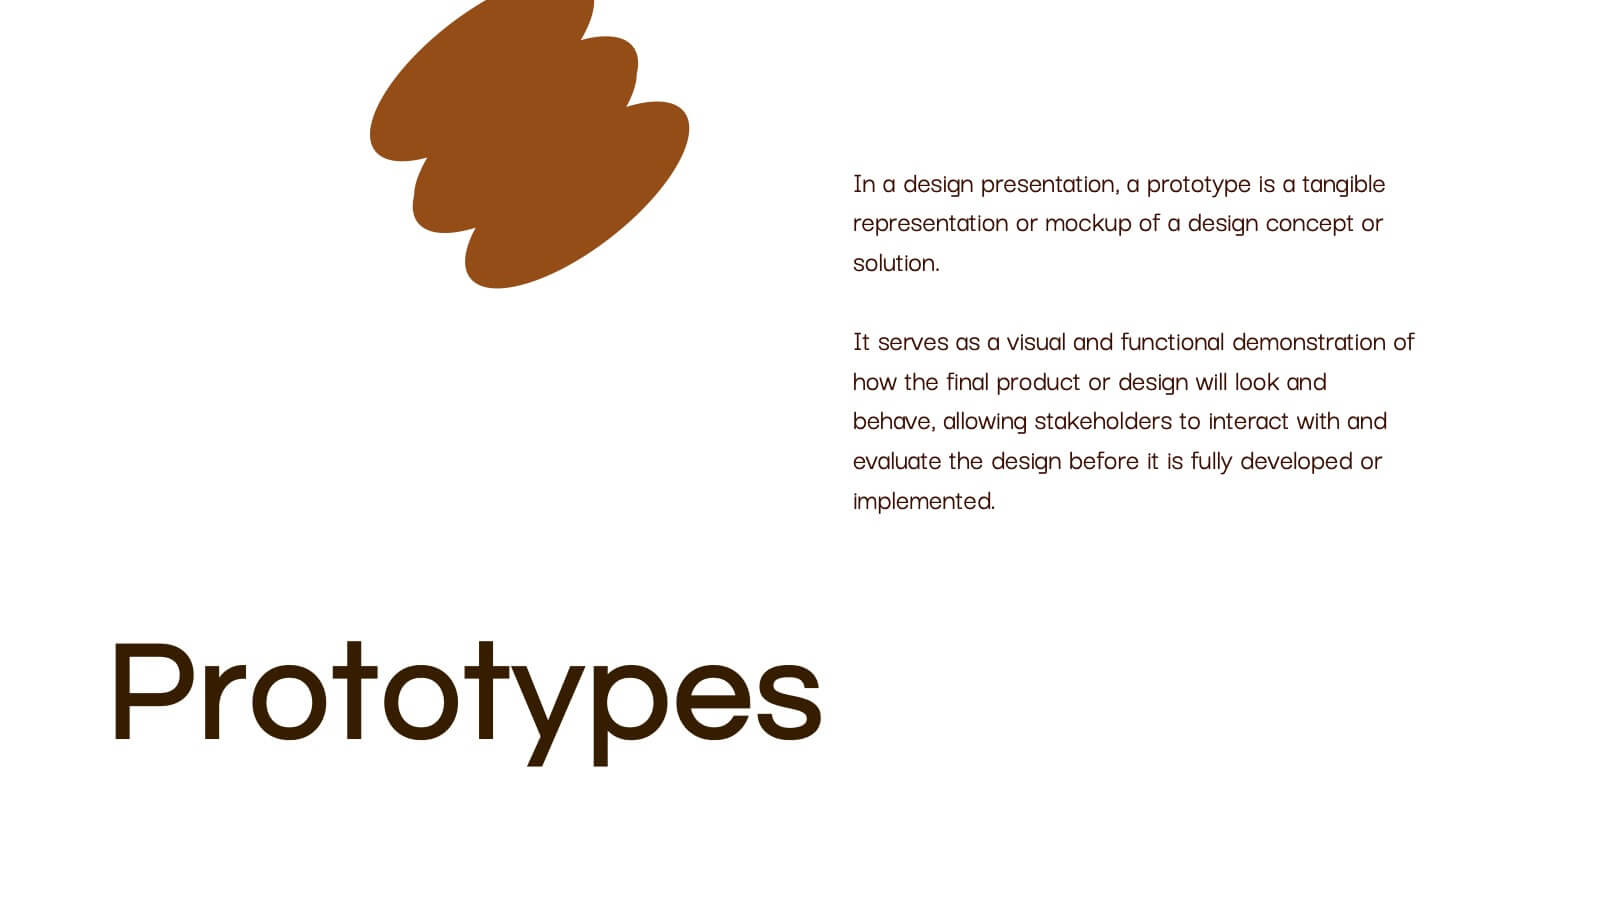
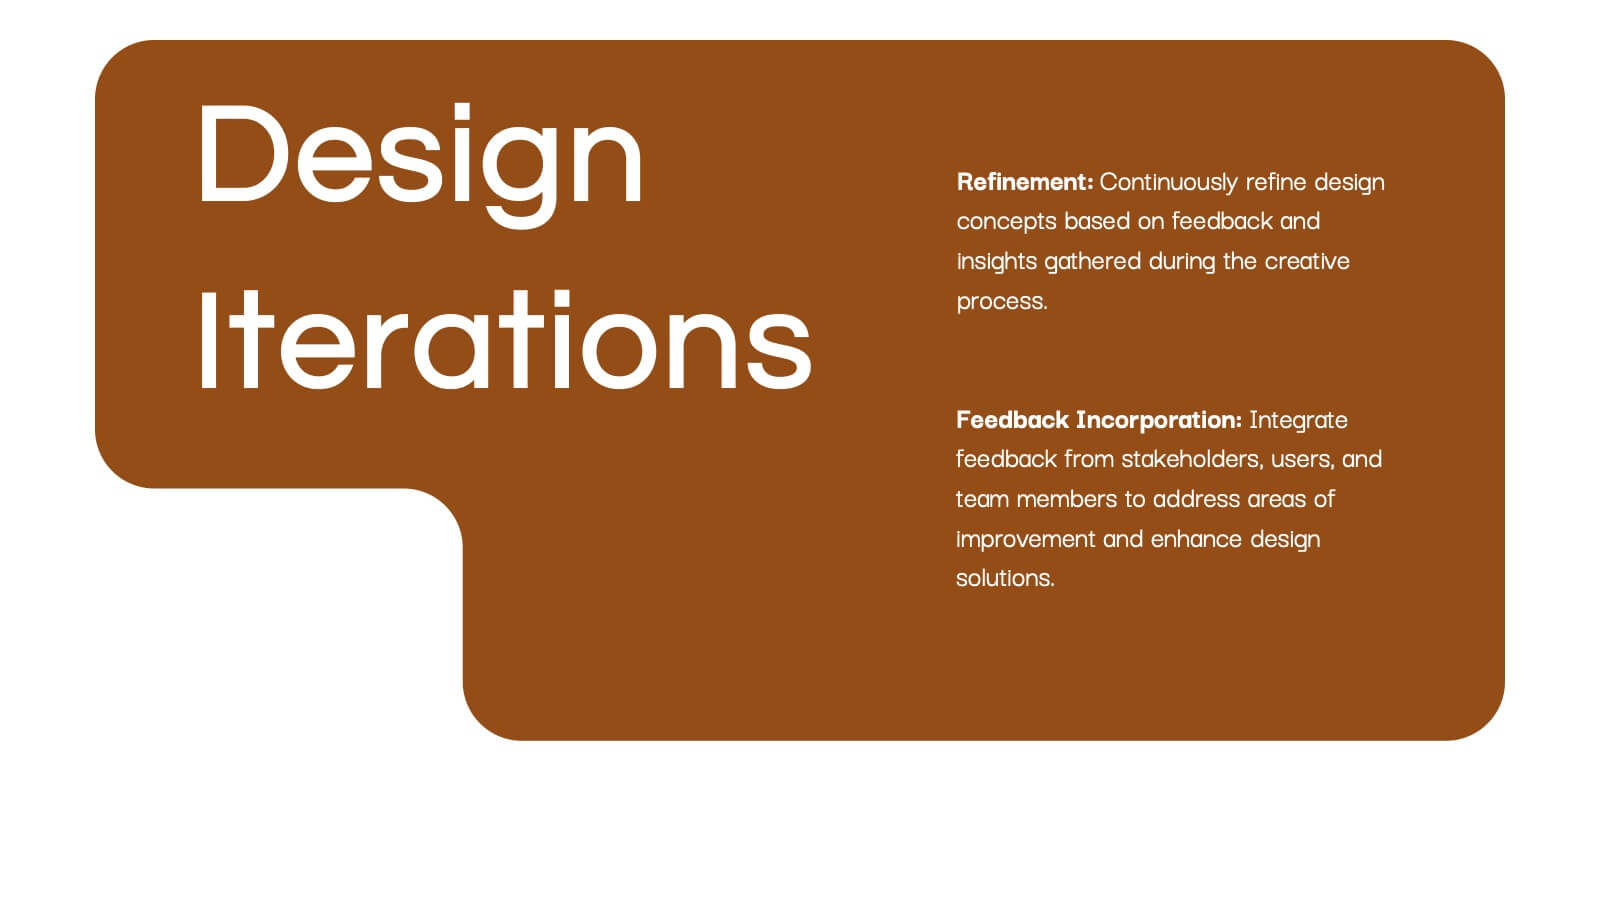
Obsidian Creative Design Report Presentation
Bring your creative vision to life with this stunning design presentation template! Perfect for showcasing your design process, from concept development and mood boards to typography and final assets. Ideal for creative professionals, this template offers clarity and style at every step. Compatible with PowerPoint, Keynote, and Google Slides, it’s your ultimate tool for design presentations.
25 slides
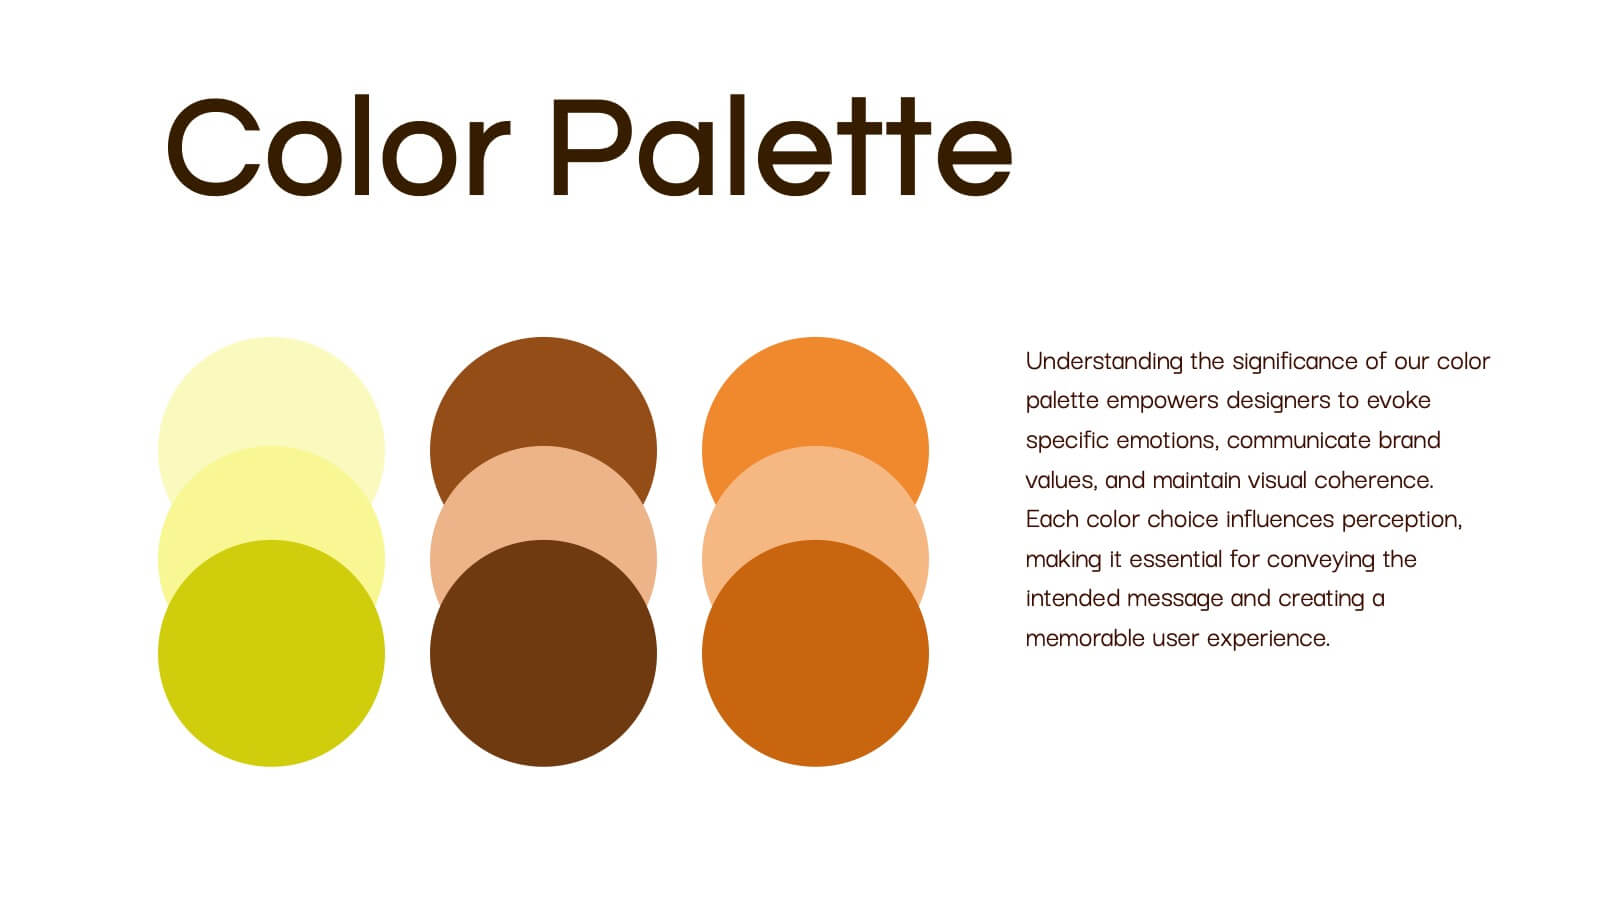
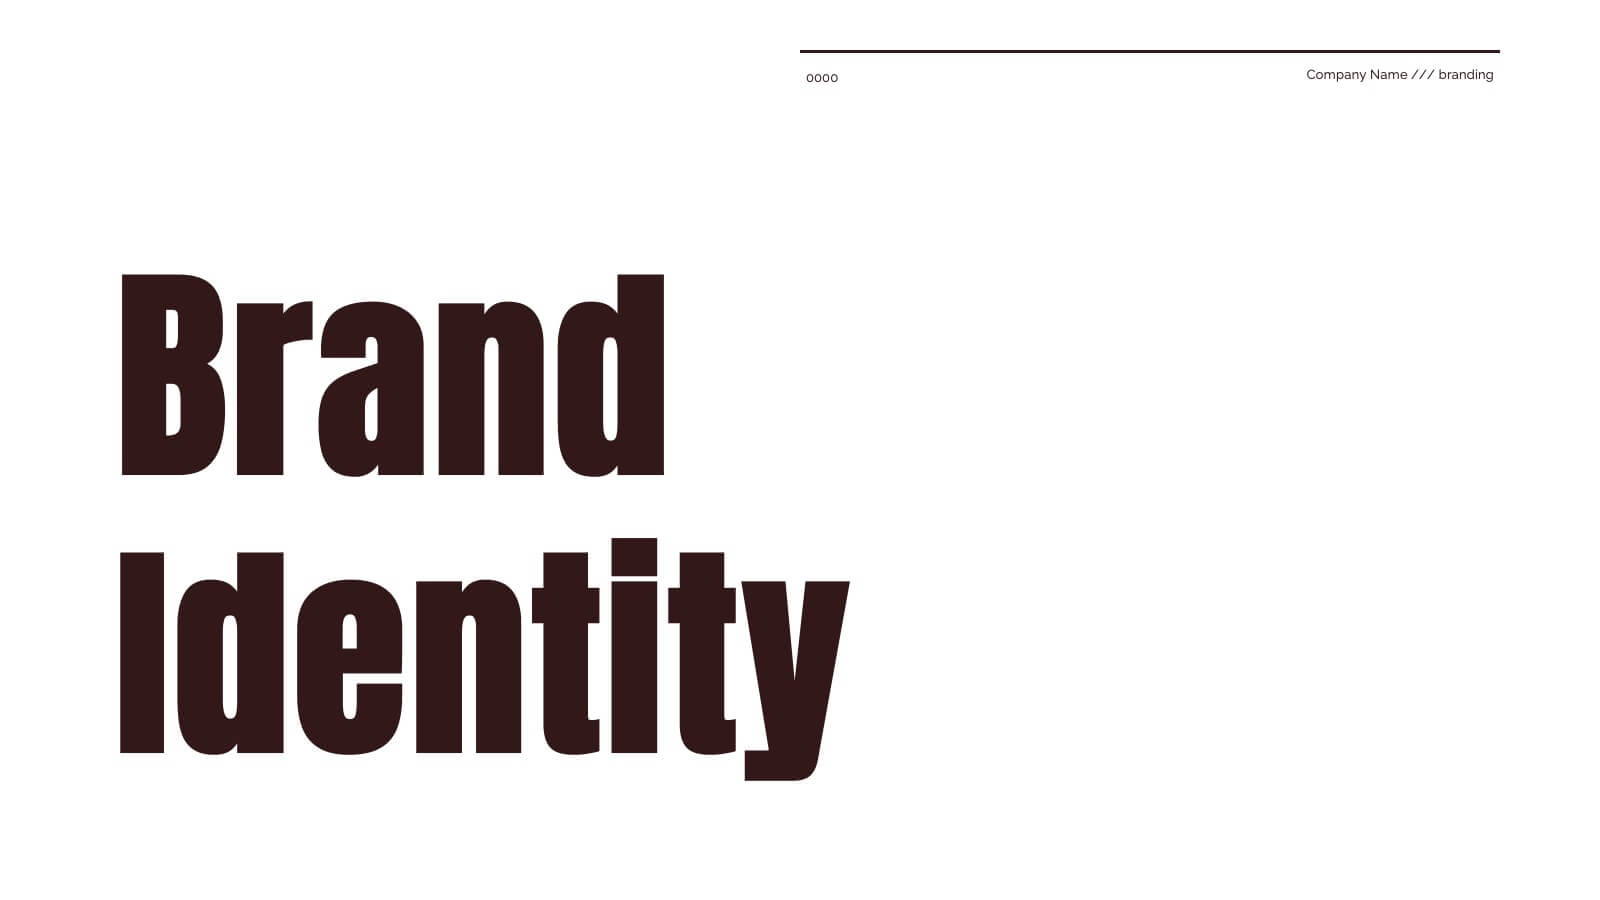
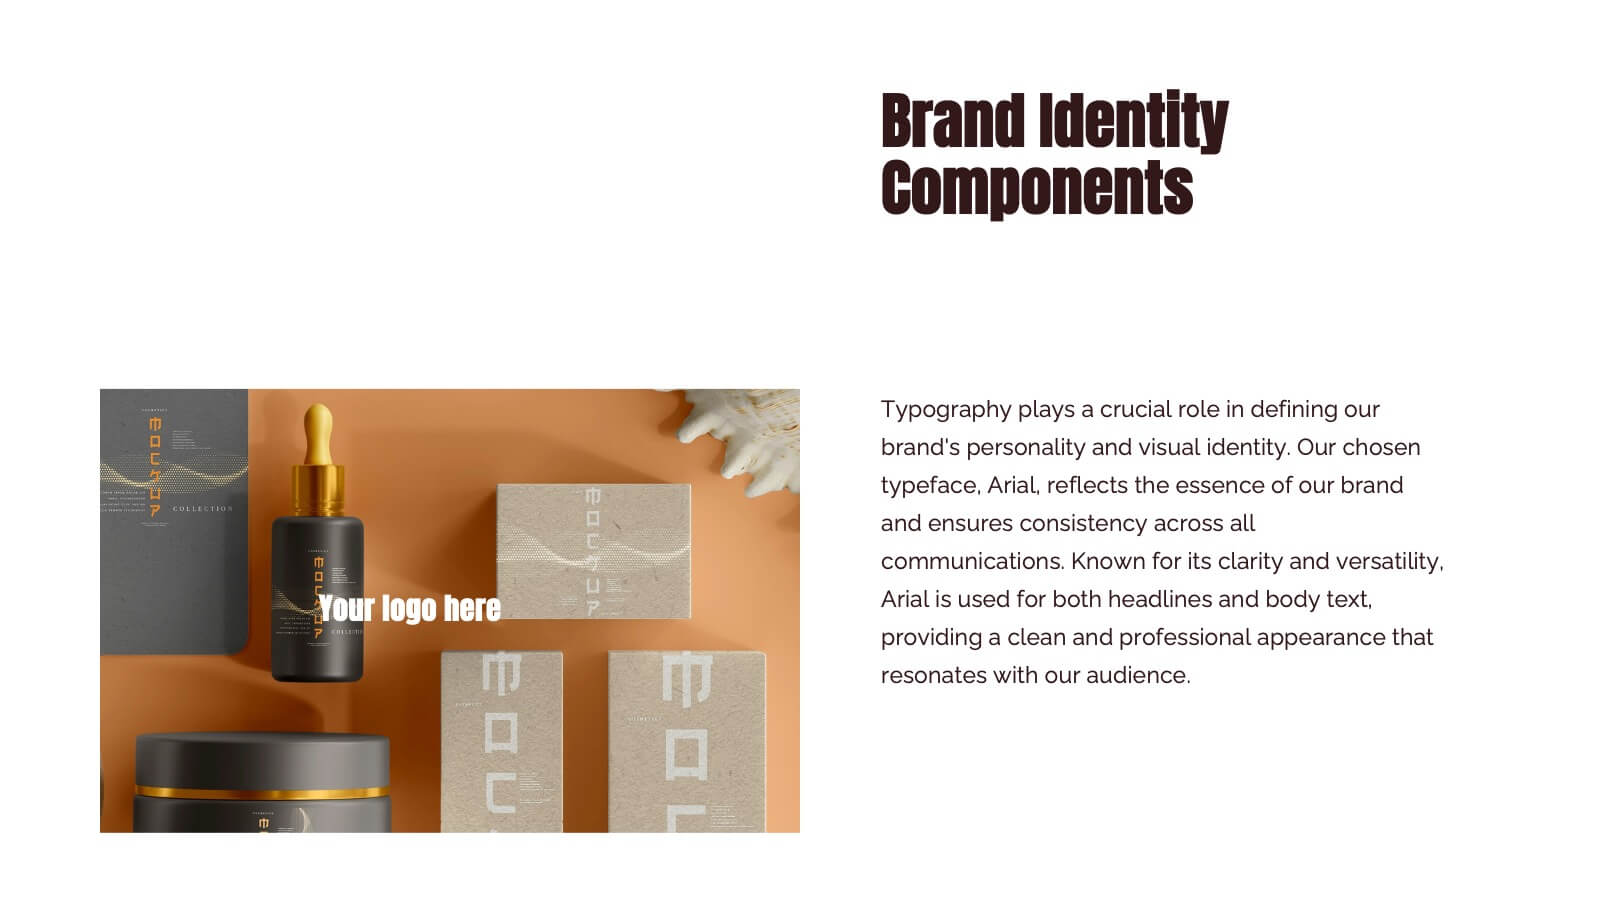
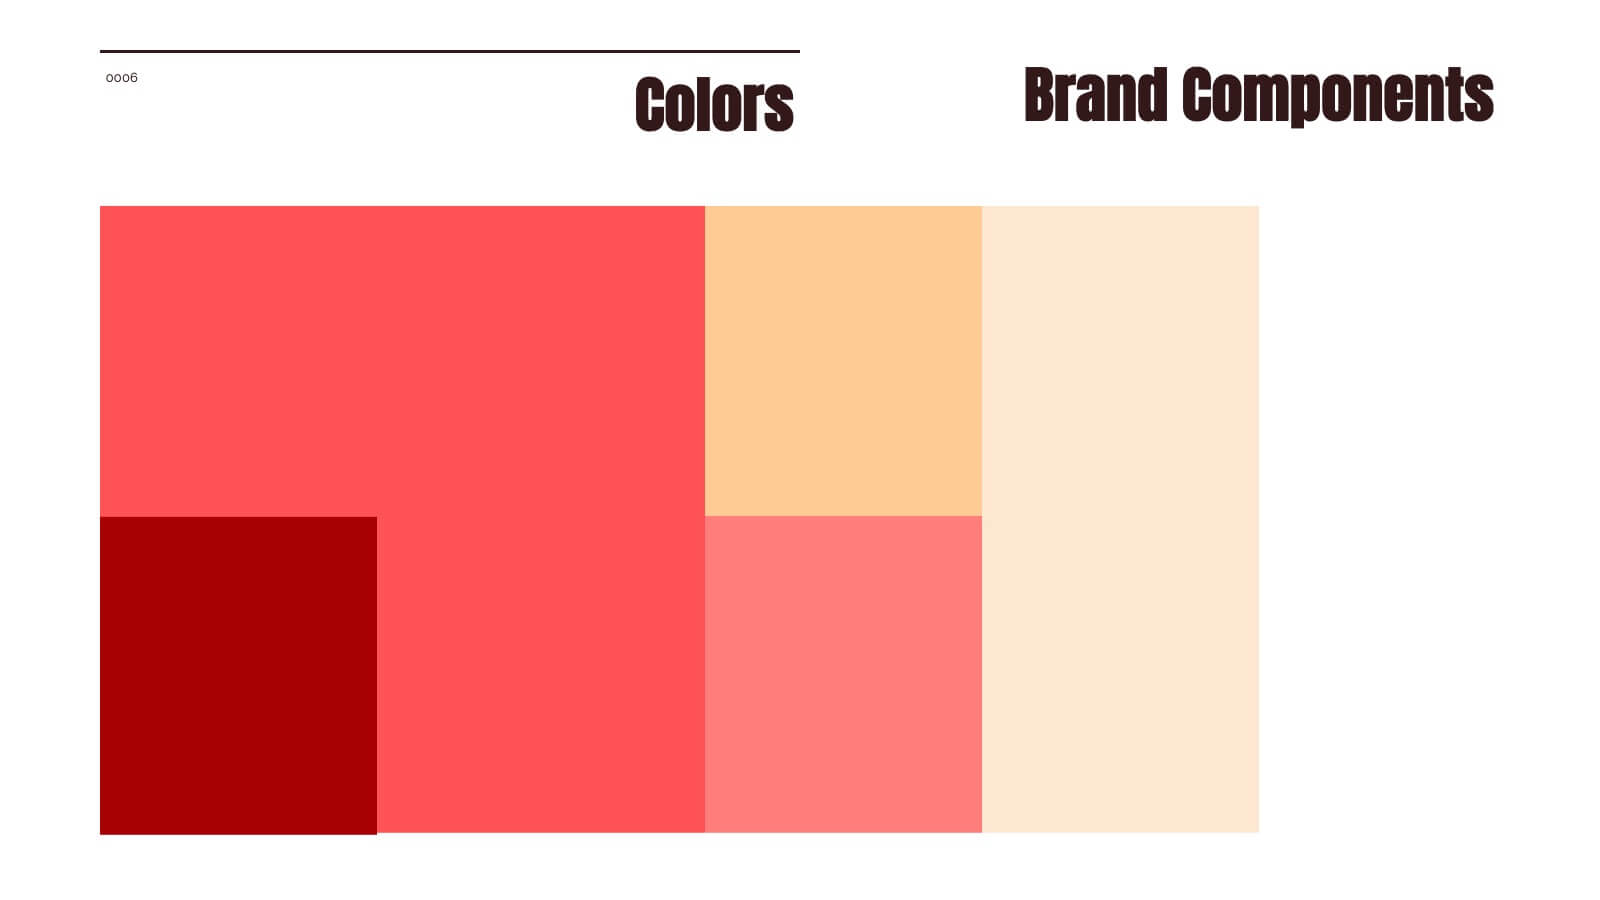
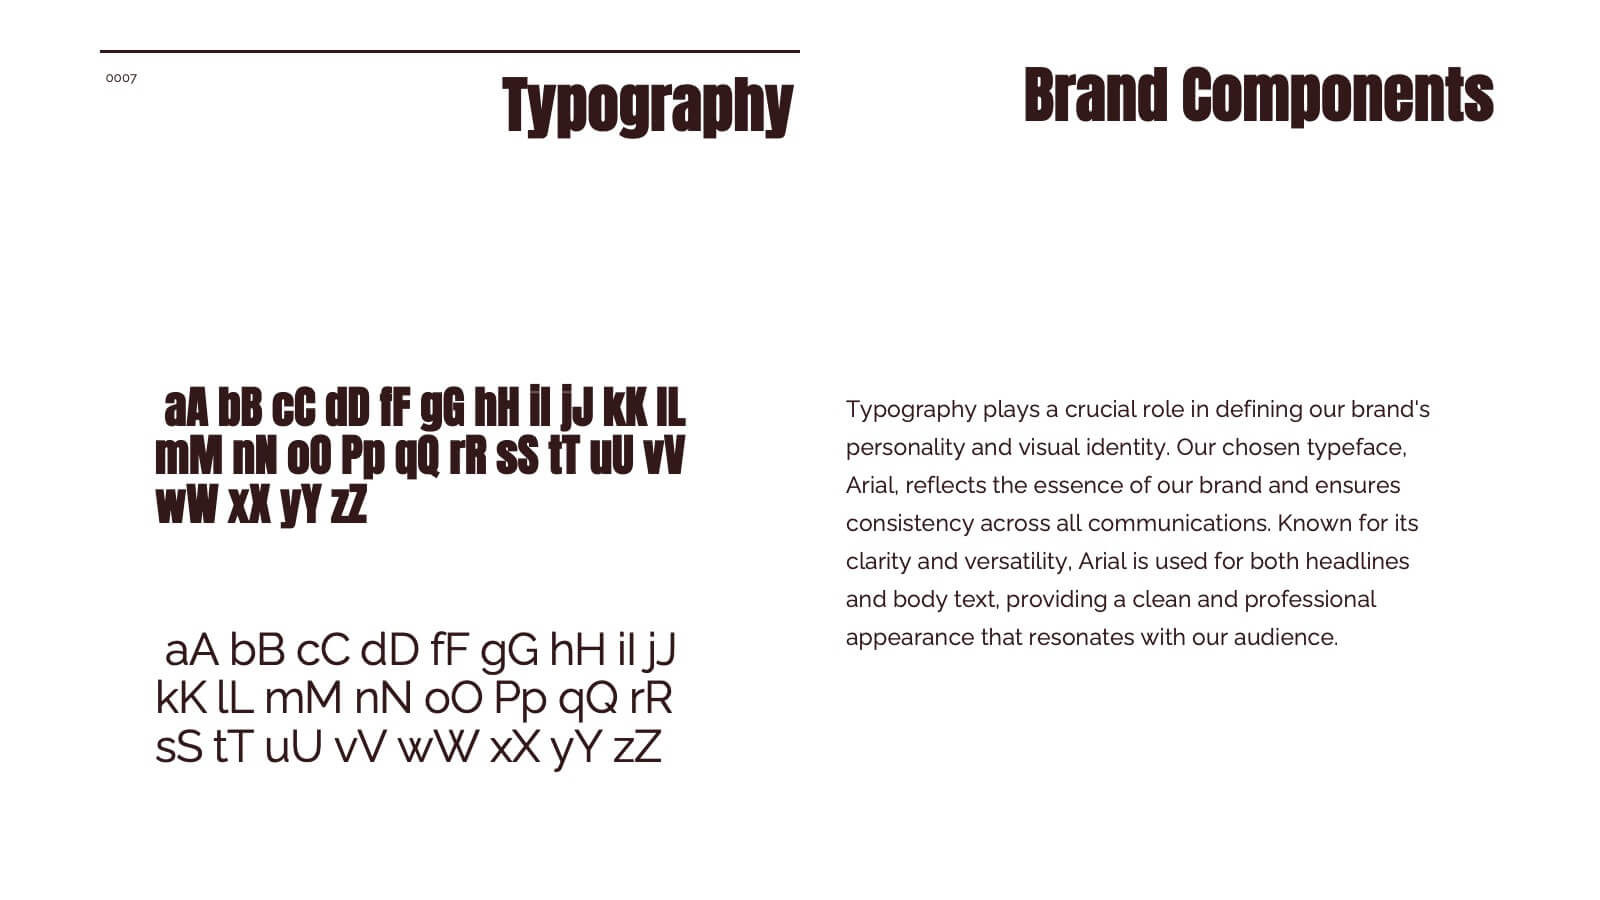
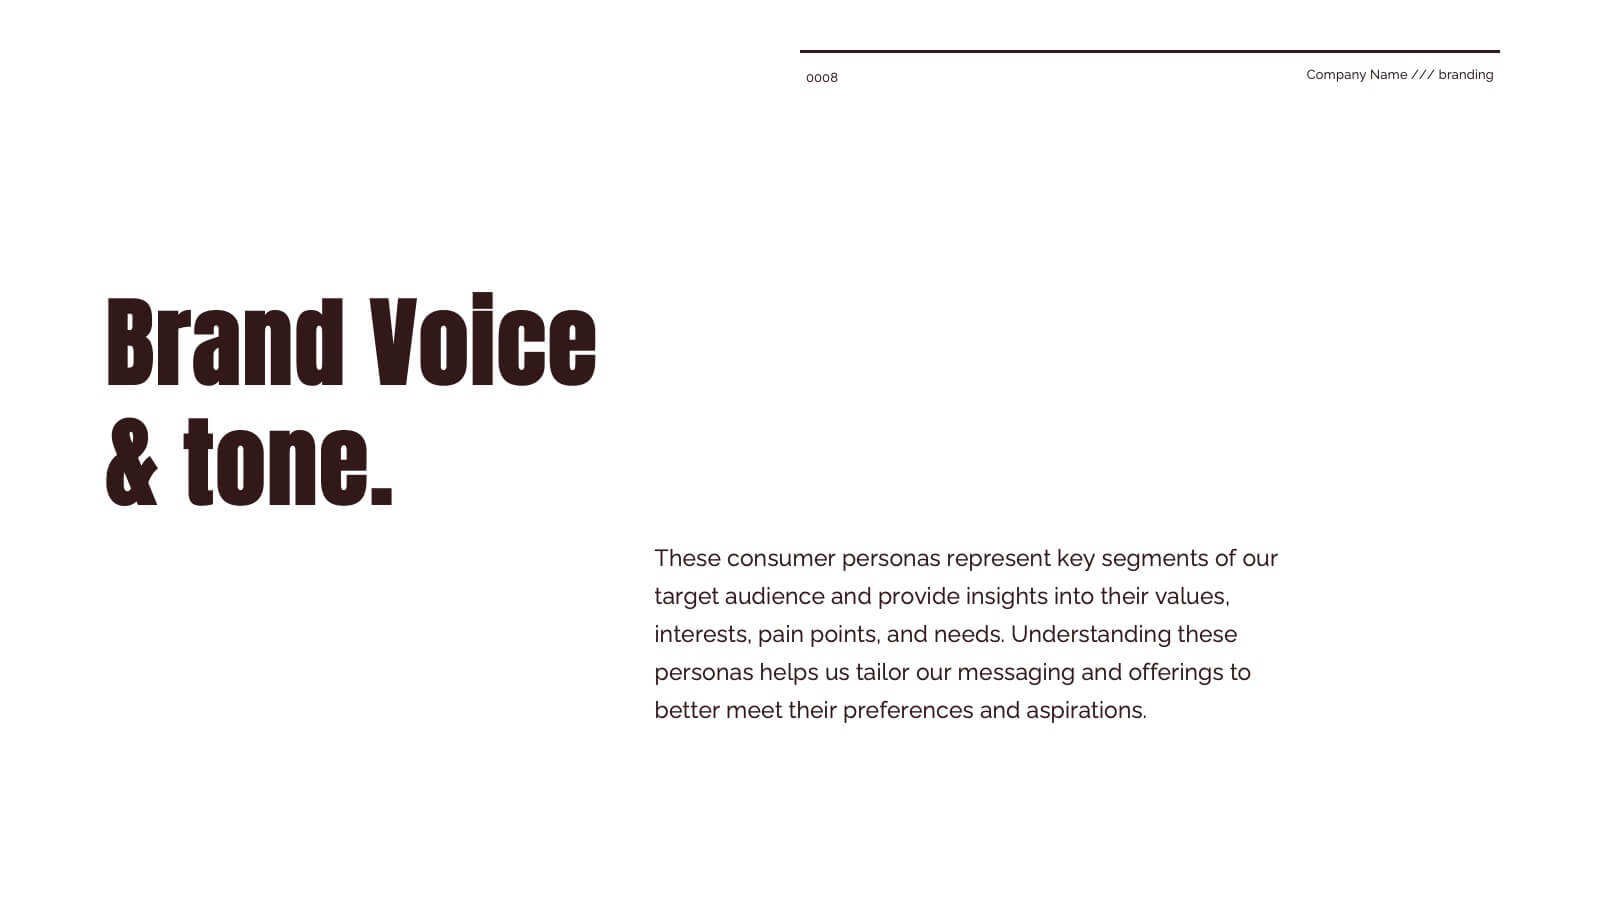
Blaze Brand Identity Presentation
Ignite your brand's potential with this vibrant, blaze-inspired presentation! Ideal for showcasing your brand identity, this template highlights key elements like logo design, color palette, and brand messaging with bold visuals and a modern layout. Perfect for making your brand stand out. Compatible with PowerPoint, Keynote, and Google Slides.


6 slides
North America Weather Map Infographics
Explore our customizable North America Weather Map infographic template, a valuable tool for understanding regional weather patterns. Compatible with PowerPoint, Keynote, and Google Slides, this template simplifies complex data into user-friendly visuals, allowing you to tailor it to your specific requirements. This infographic template offers a foundation for displaying current and historical weather data, temperature trends, precipitation patterns, and more. Whether you're a meteorologist, educator, or just curious, this template provides a versatile platform to create weather-related presentations that suit your unique needs. Impress your audience with this SEO-optimized North America Weather Map infographic template, designed for clarity and ease of use. Customize it to stay informed, plan outdoor activities, and effectively communicate weather information. Get started with your customized infographic today!


23 slides
Soundburst Business Idea Pitch Deck Presentation
The Pitch Deck Presentation Template delivers a professional, modern design with 23 slides tailored for startups and businesses. Covering company overview, solutions, market opportunities, and financials, it's fully customizable for your unique vision. Compatible with PowerPoint, Keynote, and Google Slides, this template ensures impactful, investor-ready presentations.


7 slides
3D Models Infographic Presentation
A 3D Model Infographic is a graphic design element that utilizes three-dimensional models to present information in a visually engaging and interactive way. This 3D model template can be used as a digital representation of an object that can be viewed and manipulated from different angles and perspectives. This Infographic can be customized to represent data or information in a variety of ways. For example, a 3D model of a building or product could be used to highlight different features or components. Compatible with Powerpoint, Keynote and Google Slides this template is easily customizable.


7 slides
Technology Skills Gap Infographic Presentation
A Skills Gap Infographic is a visual representation of the difference between the skills that employers need and the skills that are possessed by job seekers or employees. This template illustrates the gap between the skills that are required for a particular job and the skills that are currently available in the workforce. This template include charts, diagrams, and other visual elements that help to explain the extent of the skills gap, as well as its impact on the economy, businesses, and individuals. Use this to raise awareness about the skills gap and its implications to encourage action.


8 slides
Market Research Survey Analysis Presentation
Present your Market Research Survey Analysis with this visually engaging template, designed for clear data visualization and insights presentation. Featuring an intuitive infographic layout, this template allows you to highlight key survey findings, customer insights, and strategic takeaways. Fully customizable in PowerPoint, Keynote, and Google Slides, you can adjust colors, edit text, and modify icons to align with your business needs.


7 slides
Break-Even Model for Revenue Planning Presentation
Simplify financial planning with this break-even model presentation. Designed to visualize the transition from loss to profit, it highlights cost reduction, sales increase, and profit margins. Ideal for strategy sessions, budgeting, or forecasts. Fully editable in PowerPoint, Keynote, and Google Slides for seamless customization across business presentations.


6 slides
TAM SAM SOM Market Analysis
Take your market insights to the next level with a visual that simplifies complex data in seconds. This layered template helps you clearly communicate TAM, SAM, and SOM breakdowns—perfect for startups, product pitches, or strategic planning. Easily editable in PowerPoint, Keynote, and Google Slides for fast, polished presentations.


7 slides
Supply Chain Solutions Infographic
Supply chain refers to the entire process of producing and delivering a product or service, from the procurement of raw materials to the distribution of the final product to customers. This infographic template elucidates the complexities of supply chain management, guiding you through strategies and innovations that pave the way for an optimized, efficient, and resilient supply chain network. Fully customizable and compatible with Powerpoint, Keynote, and Google Slides. Utilize a bold and commanding color palette, reflecting the strength and authority essential in managing a successful supply chain.