


Features
- 6 Unique slides
- Fully editable and easy to edit in Microsoft Powerpoint, Keynote and Google Slides
- 16:9 widescreen layout
- Clean and professional designs
- Export to JPG, PDF or send by email


Do you have any questions?
Recommend


5 slides
Easy Asian Recipes Infographics
Asian cuisine is incredibly diverse and offers a wide range of delicious and flavorful recipes from various countries and regions. These vertical infographics are designed in a user-friendly design that showcase a collection of simple and delicious Asian recipes. These are perfect for home cooks, food bloggers, and anyone interested in exploring the flavors of Asian cuisine. These infographics include beautifully designed recipes for a variety of popular Asian dishes, such as ramen, teriyaki chicken, and more. Each recipe provides a list of ingredients needed and step-by-step instructions to guide users through the cooking process.


24 slides
Brand Overview Presentation
Enhance your brand storytelling with our Brand Presentation template. Perfect for showcasing brand vision, values, and strategies, this template includes diverse slides for audience targeting and brand touchpoints. Suitable for all professional settings, it's compatible with PowerPoint, Keynote, and Google Slides.


8 slides
Checklist and Action Item List
Bring order to your tasks with this modern checklist design, ideal for highlighting project milestones, team assignments, or key deliverables. Featuring three editable points with accompanying icons, this layout ensures clarity and professionalism in every update. Fully customizable in PowerPoint, Keynote, and Google Slides.


21 slides
Alchemos UX Case Study Presentation
Showcase your UX process with clarity and impact using this sleek case study presentation. Covering key aspects like user research, interaction design, prototyping, and responsive design, this template helps you tell a compelling design story. Fully customizable and compatible with PowerPoint, Keynote, and Google Slides for a seamless presentation experience.


22 slides
Kinetic Content Marketing Pitch Deck Presentation
Get ready to elevate your presentations with the Kinetic Pitch Deck template, designed to capture attention and convey your message with impact! This modern, bold design uses a sleek black and gold color scheme to create a sense of sophistication and power. Every slide is thoughtfully structured, ensuring your content is delivered with clarity and style. From your Company's Vision and Core Values to Market Presence and Financial Highlights, this template covers all the essential aspects of a compelling pitch. With fully editable slides, you can easily customize it to fit your brand's identity and make a lasting impression on your audience. Perfect for marketing proposals, business pitches, or corporate presentations, this versatile template is compatible with PowerPoint, Keynote, and Google Slides. Prepare to captivate your audience and make your next presentation unforgettable with this dynamic and visually striking pitch deck template!


21 slides
Oneiros Project Timeline Presentation
Effectively communicate your project's progress, goals, and milestones with this professional timeline presentation. Cover key areas such as objectives, resource allocation, stakeholder analysis, and risk management to keep your team aligned. Fully customizable and compatible with PowerPoint, Keynote, and Google Slides.


21 slides
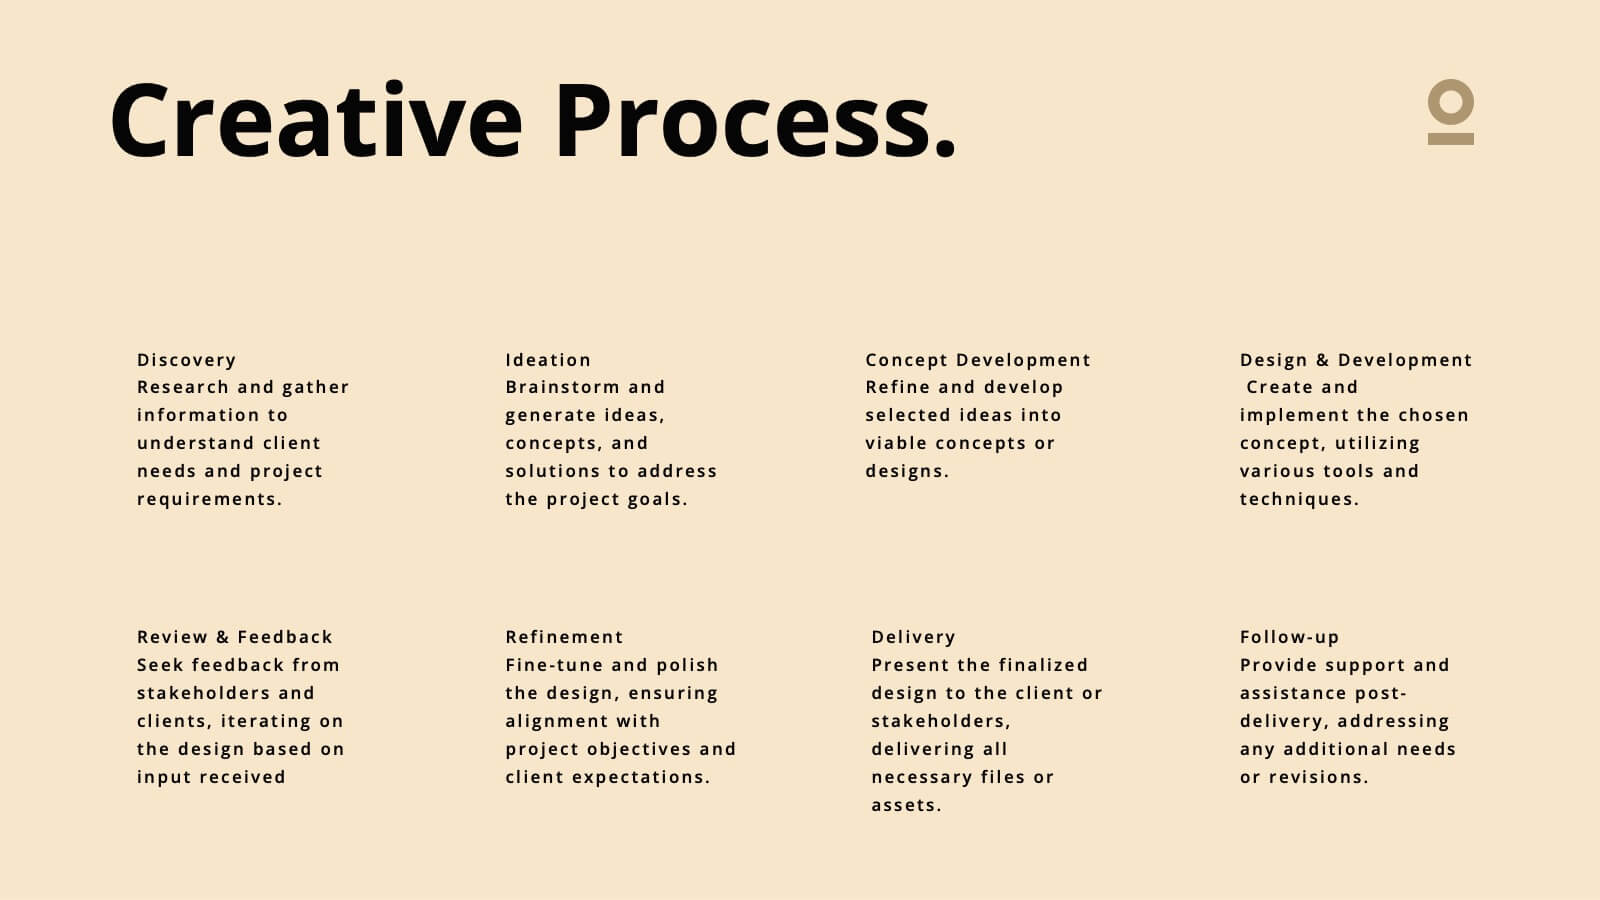
Haze Professional Portfolio Showcase Presentation
Elevate your professional presence with this stunning haze-inspired presentation template! Ideal for showcasing your portfolio, it beautifully highlights your skills, projects, and achievements with a clean and sophisticated design. This template ensures your work stands out, captivating potential clients and employers. Compatible with PowerPoint, Keynote, and Google Slides.


19 slides
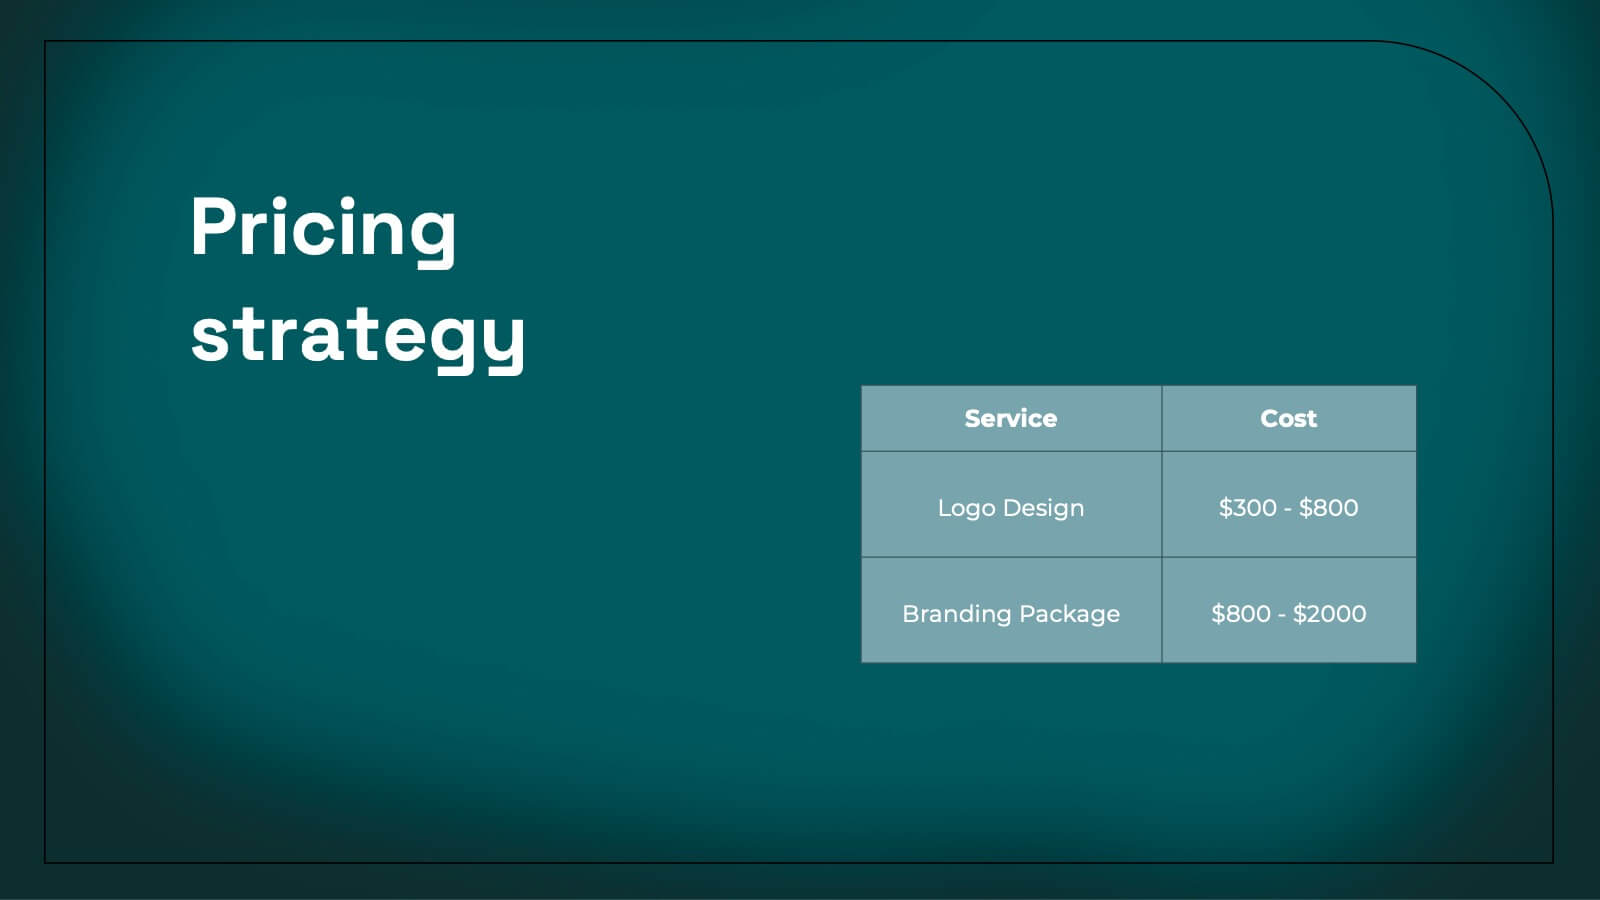
Kale Product Strategy Report Presentation
Unleash the power of your product with this bold and dynamic product strategy report template! Elevate your presentation with eye-catching designs that showcase product features, competitive analysis, and pricing strategies like never before. Captivate your audience from start to finish and leave a lasting impression. Fully compatible with PowerPoint, Keynote, and Google Slides!


10 slides
Overcoming Market Challenges Presentation
Overcome business obstacles with confidence using this Overcoming Market Challenges template. Designed with a dynamic step-by-step growth visual, this slide helps illustrate challenges, solutions, and progress in an engaging way. Ideal for strategy meetings, financial forecasts, and competitive analysis, this template makes complex information easy to understand. Fully editable for PowerPoint, Keynote, and Google Slides.


4 slides
Economic Trends and Analysis of North America Map Presentation
Present key regional insights with this North America economic analysis map. Compare up to four locations using percentage stats and customizable titles. Ideal for showcasing market trends, financial metrics, or growth data. Fully editable in PowerPoint, Keynote, and Google Slides—perfect for economic forecasts, business reports, or strategy meetings.


5 slides
Gantt Chart Project Schedule Presentation
Bring structure to your project timeline with a clean, easy-to-read layout that maps tasks, durations, and progress at a glance. This presentation helps teams stay aligned, visualize schedules, and track milestones with clarity and precision. Fully compatible with PowerPoint, Keynote, and Google Slides.


7 slides
Business Plan Strategy Infographic
A business plan is a written document that outlines a company's goals and the strategy it will use to achieve those goals. This infographic template is a comprehensive roadmap for how a business intends to operate, grow, and succeed in its market. Compatible with Powerpoint, Keynote, and Google Slides. This template is meticulously designed to help you craft a well-structured business plan, empowering entrepreneurs and professionals to navigate their journey to success. Let this be your compass as you navigate the complexities of entrepreneurship and strive for business excellence!


6 slides
Global Transportation & Logistics Infographics
The "Global Transportation and Logistics" infographic template, suitable for PowerPoint, Keynote, and Google Slides, is an invaluable tool for professionals in the logistics, shipping, and supply chain industries. This comprehensive template is designed to effectively communicate the complexities and scope of global transportation and logistics. This template features key elements such as global shipping routes, logistics management, and supply chain operations. Its detailed and informative design is perfect for presentations that need to illustrate the intricacies of global logistics, from transportation networks to logistical challenges. This is especially useful for strategic planning, educational purposes, or corporate presentations in the logistics sector. The color scheme of the template reflects global connectivity and efficiency, incorporating shades of blue, green, and earth tones. This professional and visually appealing design not only enhances the clarity of the information but also adds a global perspective to your presentation. Whether used for training, client meetings, or industry conferences, this template ensures your insights into global transportation and logistics are presented with precision and professionalism.


3 slides
Designing a Loyalty Program Presentation
Build stronger customer connections with a sleek, modern layout that highlights how reward systems drive retention and engagement. This design is perfect for visualizing loyalty strategies, program tiers, and user benefits with clarity and style. Fully editable and compatible with PowerPoint, Keynote, and Google Slides for effortless customization.


5 slides
Customer Behavior and Demographics Presentation
Break down customer segments with clarity using this behavior and demographics infographic set. Featuring colorful cylinder diagrams and intuitive labels, these slides are ideal for presenting consumer insights, age groups, behavior trends, and buyer types. Fully editable in PowerPoint, Keynote, and Google Slides—perfect for marketers, analysts, and business development teams.


21 slides
Everwyrm Startup Strategy Presentation
The Startup Strategy Presentation Template is crafted to highlight your business vision, growth plans, and financial insights. With 21 fully editable slides, it covers areas like business model, market analysis, and milestones. Perfect for entrepreneurs and investors, compatible with PowerPoint, Keynote, and Google Slides.


7 slides
Porter's Five Forces Infographics Presentation Template
Porter's Five Forces model is a framework for analyzing the competitive environment of an industry. The five forces are: threat of new entrants, bargaining power of suppliers, bargaining power of buyers, threat of substitute products or services, and rivalry among existing competitors. By using this template to analyze these five forces, you can gain a better understanding of the industry's environment and make more strategic decisions. Use this template to help your business analyze. This will help you make a great presentation evaluating the potential profitability of entering a new market.