


Features
- 6 Unique slides
- Fully editable and easy to edit in Microsoft Powerpoint, Keynote and Google Slides
- 16:9 widescreen layout
- Clean and professional designs
- Export to JPG, PDF or send by email


Do you have any questions?
Recommend


7 slides
Kickoff Meeting Infographic
A meeting is a planned gathering of individuals, often from an organization or a group, who come together to discuss specific topics, share information, make decisions, or collaborate on projects. This infographic template is a visually engaging guide to launching your projects with a burst of energy and purpose. This template is your go-to tool for orchestrating that vital moment—the project kickoff—that sets the stage for success. Compatible with Powerpoint, Keynote, and Google Slides. This template is a structured way to communicate, coordinate actions, and ensure that everyone involved is aligned towards common goals.


4 slides
Sales Performance Dashboard Report Presentation
Track progress and showcase trends with the Sales Performance Dashboard Report Presentation. This template features a clean monthly line chart to visualize product growth, alongside three metric boxes for highlighting KPIs or category performance. Ideal for quarterly recaps, revenue reporting, or product analysis. Fully editable in Canva, PowerPoint, and Google Slides.


5 slides
Sprint Planning and Agile Cycle Overview Presentation
Break down agile sprints with this clean, circular cycle layout. Ideal for scrum teams and product managers to illustrate sprint planning, task flow, and iterative progress. Includes five key stages with icon support. Fully customizable in PowerPoint, Keynote, and Google Slides for agile ceremonies, planning sessions, or team training.


6 slides
AIDA Communication Model Infographics
Embark on a journey through the AIDA Communication Model, a fundamental concept in marketing and advertising! This infographic serves as your guide to understanding how this powerful model can elevate your communication strategy. From capturing Attention and holding Interest to sparking Desire and driving Action, we unveil the secrets that make the AIDA model an indispensable tool. Delve into the art of holding the audience's interest. Discover methods to maintain engagement and curiosity as you convey your message. Learn how to keep your audience captivated and eager to learn more. With this engaging infographic, compatible with PowerPoint, Keynote, and Google Slides, sharing your understanding of the AIDA Communication Model becomes effortless. Empower yourself with the knowledge to enhance your marketing and advertising efforts. Dive into the world of AIDA and embark on a journey of effective communication and persuasion.


22 slides
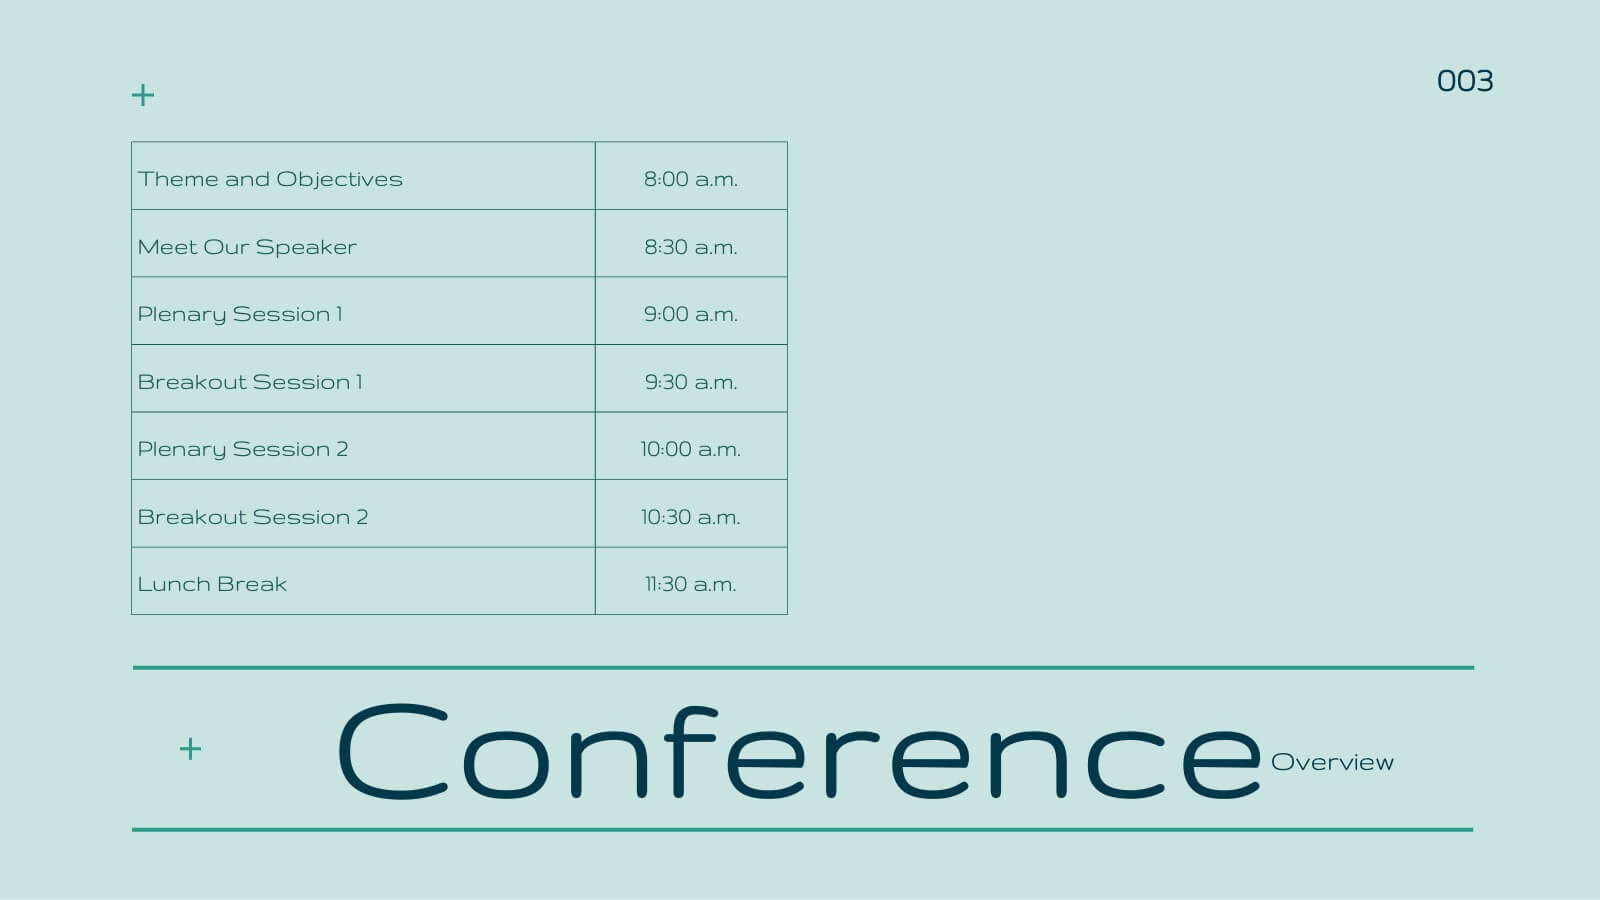
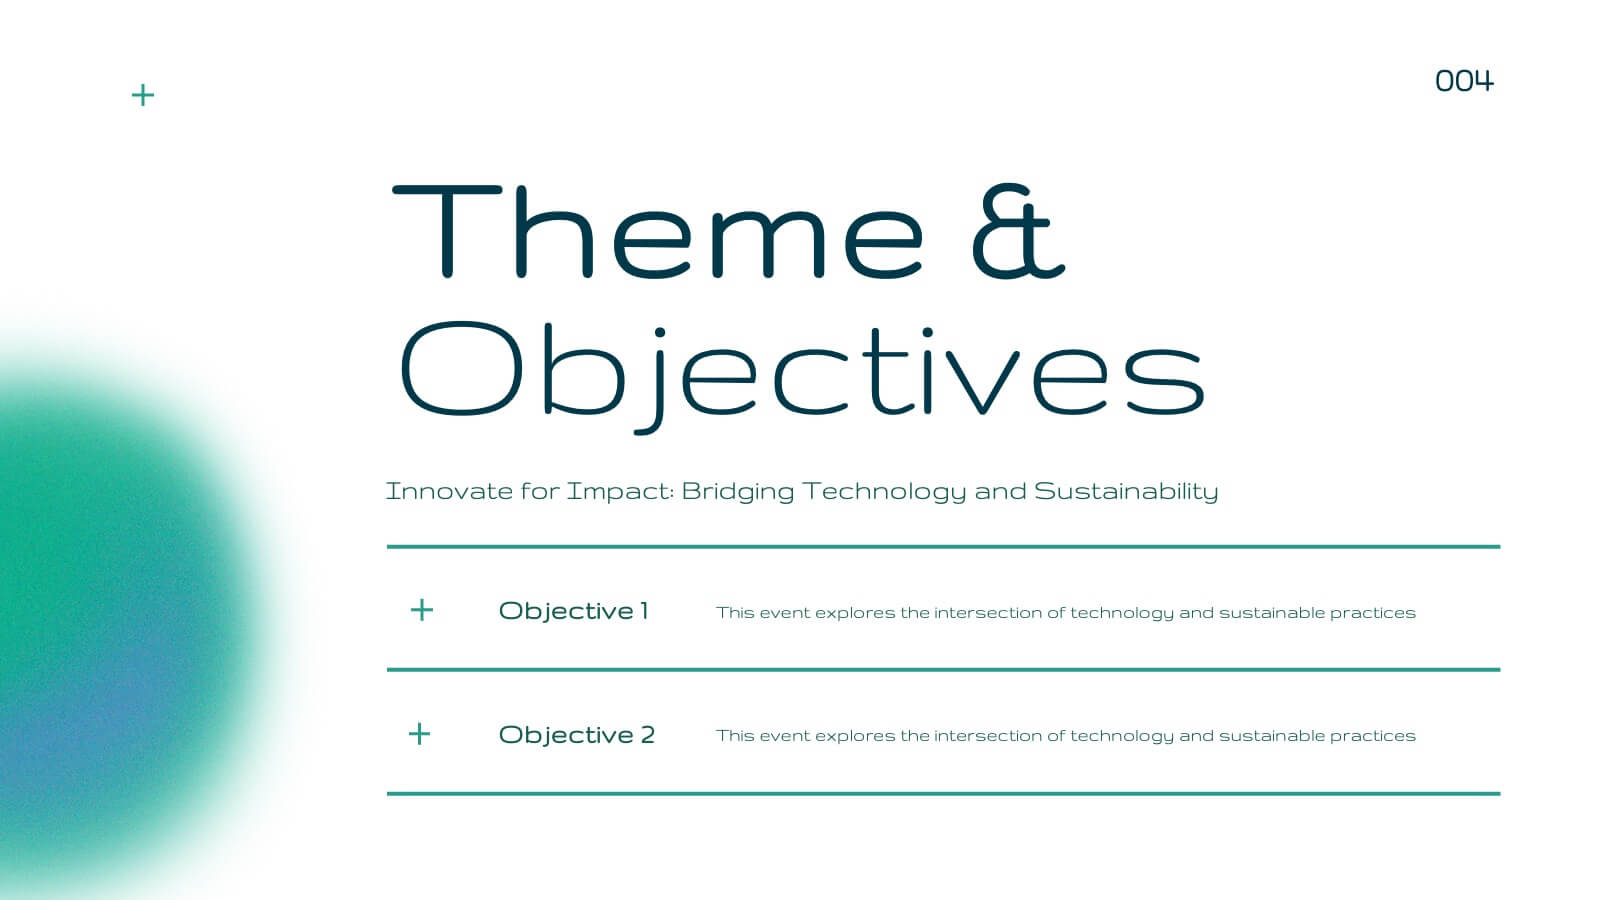
Blaze Business Operations Plan Presentation
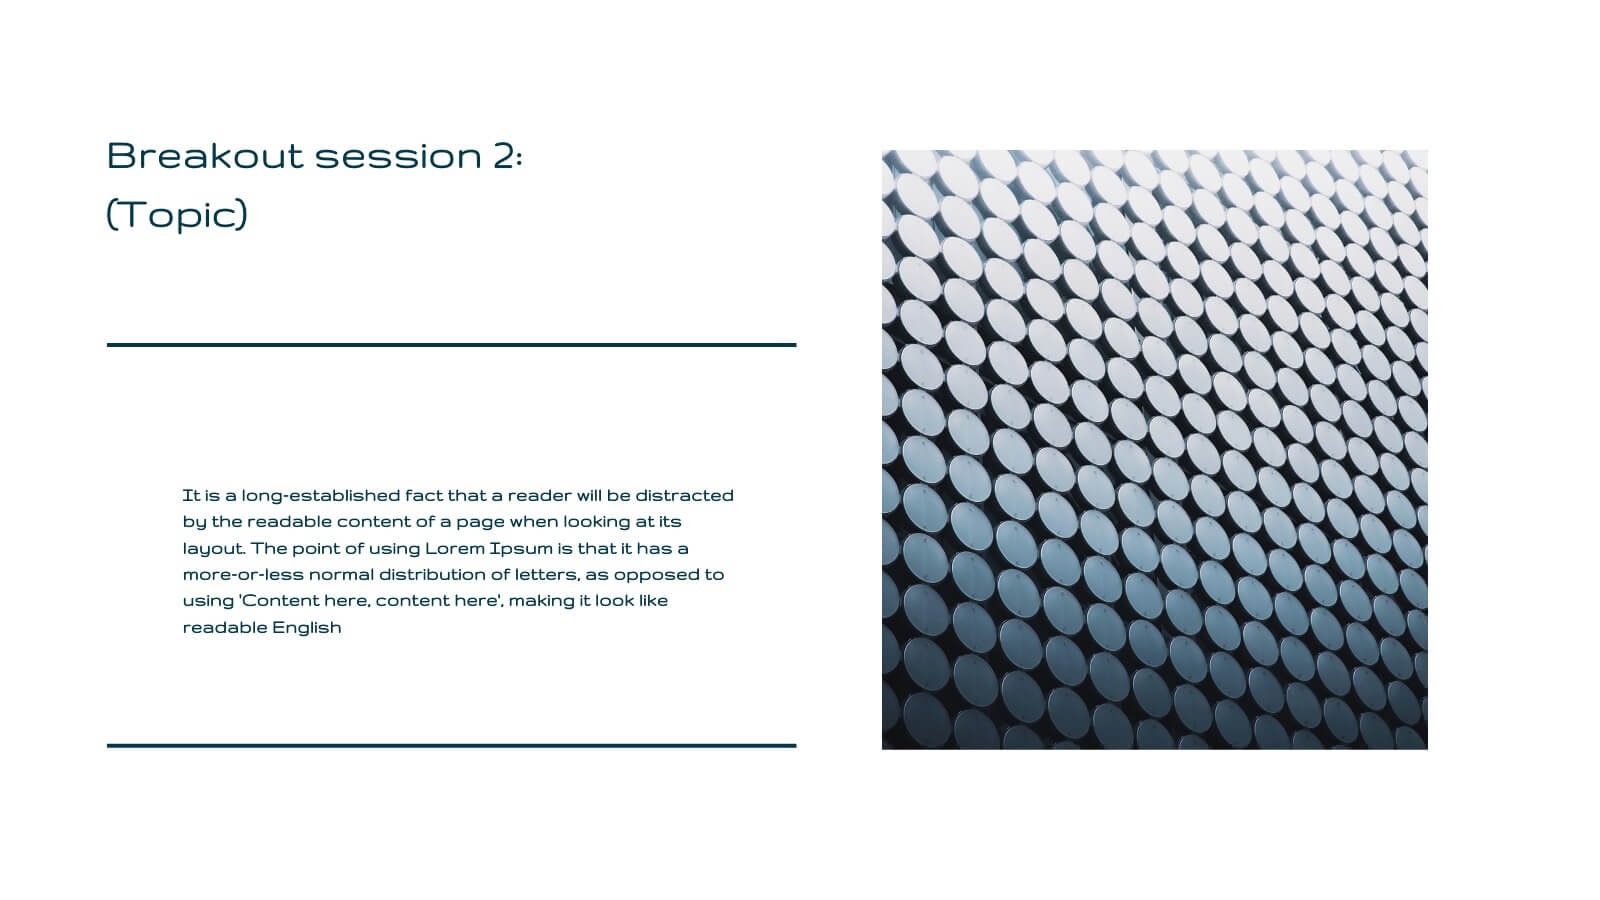
Elevate your business presentations with this elegant, modern template designed for comprehensive business operations. Perfect for covering themes, objectives, workshops, and panel discussions, it ensures a professional and engaging delivery. The clean design and structured layout enhance clarity and impact. Compatible with PowerPoint, Keynote, and Google Slides, it’s versatile for any platform.


6 slides
KPI Metric Infographic
KPI stands for Key Performance Indicator, and it is a measurable value that helps organizations track their progress and performance towards achieving specific business goals and objectives. This infographic template is designed to display key performance indicators and metrics in a concise and easy-to-understand manner. KPIs are quantifiable measurements used to evaluate the success of an organization, project, or specific business activities. The infographic provides a visual representation of these KPIs, making it easier for stakeholders and decision-makers to interpret the data and track progress.


8 slides
Strategic Planning Gap Assessment Presentation
Bridge the gap in your strategic planning with this visually compelling Strategic Planning Gap Assessment presentation template. Designed to highlight key challenges and solutions, this template helps you outline critical gaps, assess risks, and develop actionable strategies. Ideal for business leaders, consultants, and project managers, this fully customizable template is compatible with PowerPoint, Keynote, and Google Slides.


10 slides
Checklist and Action Plan List Presentation
Stay organized and achieve goals efficiently with this checklist and action plan template. Designed for task tracking, project management, and strategic planning, it provides a clear visual structure for prioritizing tasks. Perfect for professionals and teams aiming for productivity. Compatible with PowerPoint, Keynote, and Google Slides for seamless editing and presentation.


6 slides
Pyramid of Needs Strategy Model
Visualize priorities with clarity using the Pyramid of Needs Strategy Model Presentation. This slide presents a five-tier pyramid design, ideal for illustrating hierarchy in strategies, goals, or user needs. Each level includes numbered labels and editable titles with supporting text, making it easy to tailor to your framework. Compatible with PowerPoint, Keynote, and Google Slides.


21 slides
Kelpie Project Timeline Presentation
This sleek project plan template is perfect for outlining deliverables, timeline, budget breakdown, and risk management. Its modern design ensures clarity and professionalism, making it ideal for team or business presentations. Compatible with PowerPoint, Keynote, and Google Slides, it offers flexibility and ease for showcasing your project's key elements.


6 slides
Strategy Wheel Infographic Slide
Present key strategies, priorities, or action items in a visually engaging circular format. This infographic template is ideal for showcasing 5 interconnected components in business plans, marketing strategies, or process flows. Fully editable in PowerPoint, Keynote, and Google Slides for seamless customization.


6 slides
Problem Solving and Innovation Solution Presentation
Unlock creative thinking with the Problem Solving and Innovation Solution Presentation. This puzzle lightbulb diagram helps visualize key components of innovative strategies—ideal for brainstorming sessions, business development plans, or process improvement meetings. Editable in PowerPoint, Keynote, and Google Slides.


24 slides
Momentum Investor Pitch Presentation
The Momentum Pitch Deck is your ultimate tool for propelling your business ideas into action! This vibrant and dynamic template is crafted to captivate your audience and clearly convey your company's vision, strategy, and growth potential. Start with an engaging overview, followed by a problem statement that pinpoints the core challenges your solution addresses. Use the market opportunity and competitive landscape slides to showcase the potential for success. The business model canvas and unique selling proposition sections help illustrate how your business stands out from the competition. Highlight your revenue model, marketing strategy, and sales approach to show your path to profitability. Additionally, the template includes sections for technology and innovation, team introduction, and risk analysis, ensuring a comprehensive presentation. Whether you're pitching to investors or stakeholders, this template is fully compatible with PowerPoint, Keynote, and Google Slides, making it the perfect choice for any pitch deck.


7 slides
Comparison Infographic Presentation Template
A comparison Infographic is a visual representation that compares two or more things. It's used to show the similarities and differences between items, ideas, or concepts. It can be used to compare different products, services, options, or even facts and figures. This template works with Powerpoint, Keynote and Google Slides, so you can use it on any computer. This template includes fun pictures and allows you to add your own. This template also has many different charts, graphs and boxes so you can enter your own information. Use this comparison template to compare anything you need.


4 slides
Competitive Strategy Framework Presentation
Visualize your market position with this competitive strategy framework. Featuring a 2x2 matrix layout, this template is ideal for analyzing key strategic areas. Use the chess-themed icons and editable labels to highlight strengths, risks, and opportunities. Fully customizable in PowerPoint, Keynote, or Google Slides for strategic planning or business analysis.


5 slides
Manufacturing Insights Infographics
Manufacturing insights refer to valuable information, analysis, and observations derived from the manufacturing industry. These vertical set of infographics are designed to provide valuable insights and data related to the manufacturing industry. This template is ideal for manufacturing companies and researchers looking to present complex data in an engaging manner. The template includes infographics that break down the manufacturing process into easily understandable steps, using simple graphics and icons. This template is easily editable, allowing users to adjust colors, charts, and data to match their specific manufacturing insights.


6 slides
Organizational Objectives and Key Results Presentation
Showcase your strategic goals and measurable outcomes with the Organizational Objectives and Key Results template. Designed with a sleek radial key layout, it’s ideal for mapping priorities and tracking progress. Fully editable in Canva, PowerPoint, and Google Slides, allowing easy customization of colors, icons, and text to fit your objectives.