


Features
- 5 Unique slides
- Fully editable and easy to edit in Microsoft Powerpoint, Keynote and Google Slides
- 16:9 widescreen layout
- Clean and professional designs
- Export to JPG, PDF or send by email


Do you have any questions?
Recommend


5 slides
Strategic Budget Planning Forecasting
Tired of messy spreadsheets? This clean and creative template makes budget forecasting easier to visualize and share. Centered around a playful piggy bank illustration, it lets you outline strategic goals, savings plans, and key metrics in a format that’s easy to follow. Fully compatible with PowerPoint, Keynote, and Google Slides.


12 slides
Creative Mind Map Presentation
Unlock new perspectives with the Creative Mind Map Presentation. Designed to visualize brainstorming, strategic thinking, or concept development, this template offers an intuitive radial layout to highlight five key ideas. Fully customizable and ideal for professionals, educators, and creatives. Compatible with PowerPoint, Keynote, and Google Slides for seamless use.


4 slides
Modern 3D Business Diagram
Bring a fresh, dimensional twist to your business strategy with this modern 3D layout. Featuring interlocking puzzle elements on a tilted grid, this slide is perfect for showcasing interrelated departments, processes, or multi-stage plans. Compatible with PowerPoint, Keynote, and Google Slides.


6 slides
Bitcoin and Blockchain Technology Presentation
Unlock the potential of cryptocurrency and distributed ledger technology with our "Bitcoin and Blockchain Technology" presentation templates. These templates are designed to elucidate complex concepts in an understandable format, making them ideal for educators, technologists, and business professionals. Compatible with PowerPoint, Keynote, and Google Slides, they are a versatile tool for anyone looking to explain or explore the innovative world of blockchain.


6 slides
Big Data Analytics Business Presentation
Analyze and visualize data-driven insights with the Big Data Analytics Business infographic. Designed with a central magnifying glass layout, this template highlights key metrics, trends, and processes in data analytics. Fully customizable and compatible with PowerPoint, Keynote, and Google Slides.


4 slides
Market Expansion Strategy in South America Map Presentation
Visualize growth opportunities with this South America market expansion map. Designed with directional arrows and regional color highlights, it helps communicate entry strategies, investment plans, or operational shifts. Ideal for business reports or strategy decks. Easily customizable and compatible with PowerPoint, Google Slides, and Keynote for seamless editing.


7 slides
Pyramid Scheme Infographic Presentation
A Pyramid Infographic is a great way to organize, highlight, and illustrate your ideas and content. This design uses visual hierarchy and colors to convey key information in an attractive way. The Pyramid incorporates colorful diagrams to allows your text to stand out while it is set against a white background. This is a simple, engaging design that can be easily edited. This is great for analyzing data and it is the perfect choice to impress the audience. It will surely help you convey your message in a much better way. It's a great way to communicate the key points of your Infographic.


6 slides
Project Proposal Timeline Infographic
Effectively manage and present the timelines of your projects with our Project Proposal Timeline Templates. Designed for clarity and impact, these templates aid project managers, planners, and coordinators in outlining the key milestones and phases of projects, ensuring all stakeholders are aligned with the project schedule. Each slide in the collection features a streamlined design, utilizing shades of green to emphasize different stages and important dates. The templates are equipped with intuitive layouts that include Gantt charts, timelines, and lists, making it easy to visualize the sequence of activities, dependencies, and deadlines. Customizable for various types of projects, these timeline slides allow for detailed specifications, enabling you to adjust durations, update tasks, and refine objectives as your project evolves. Whether used for internal planning or external presentations, these templates help convey your project's scope and schedule in a professional and easily understandable manner.


7 slides
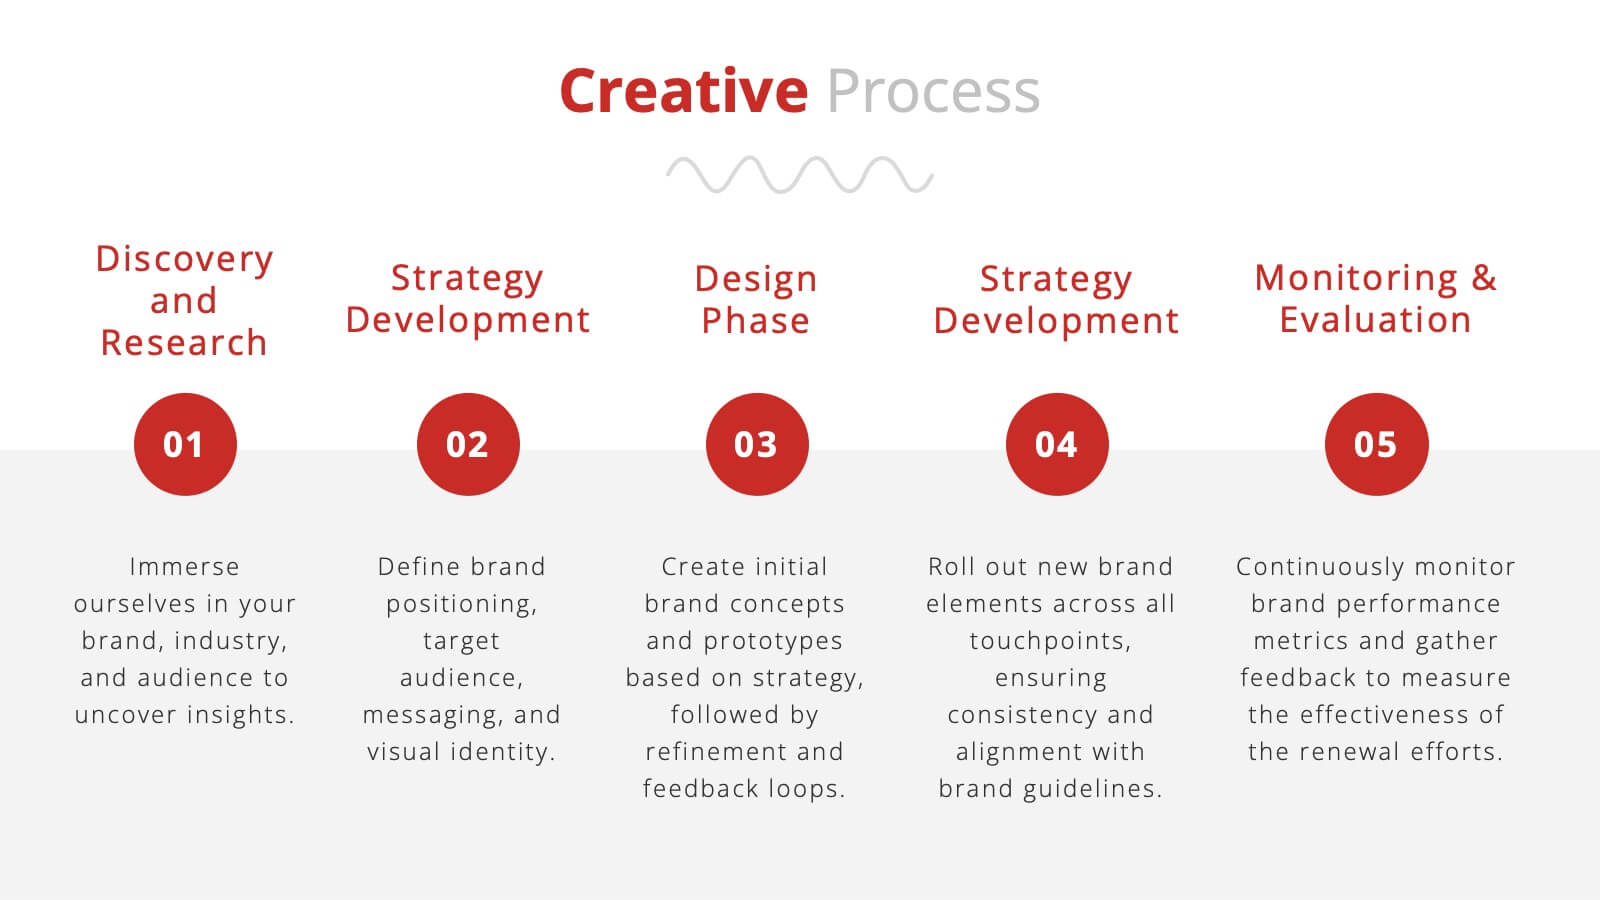
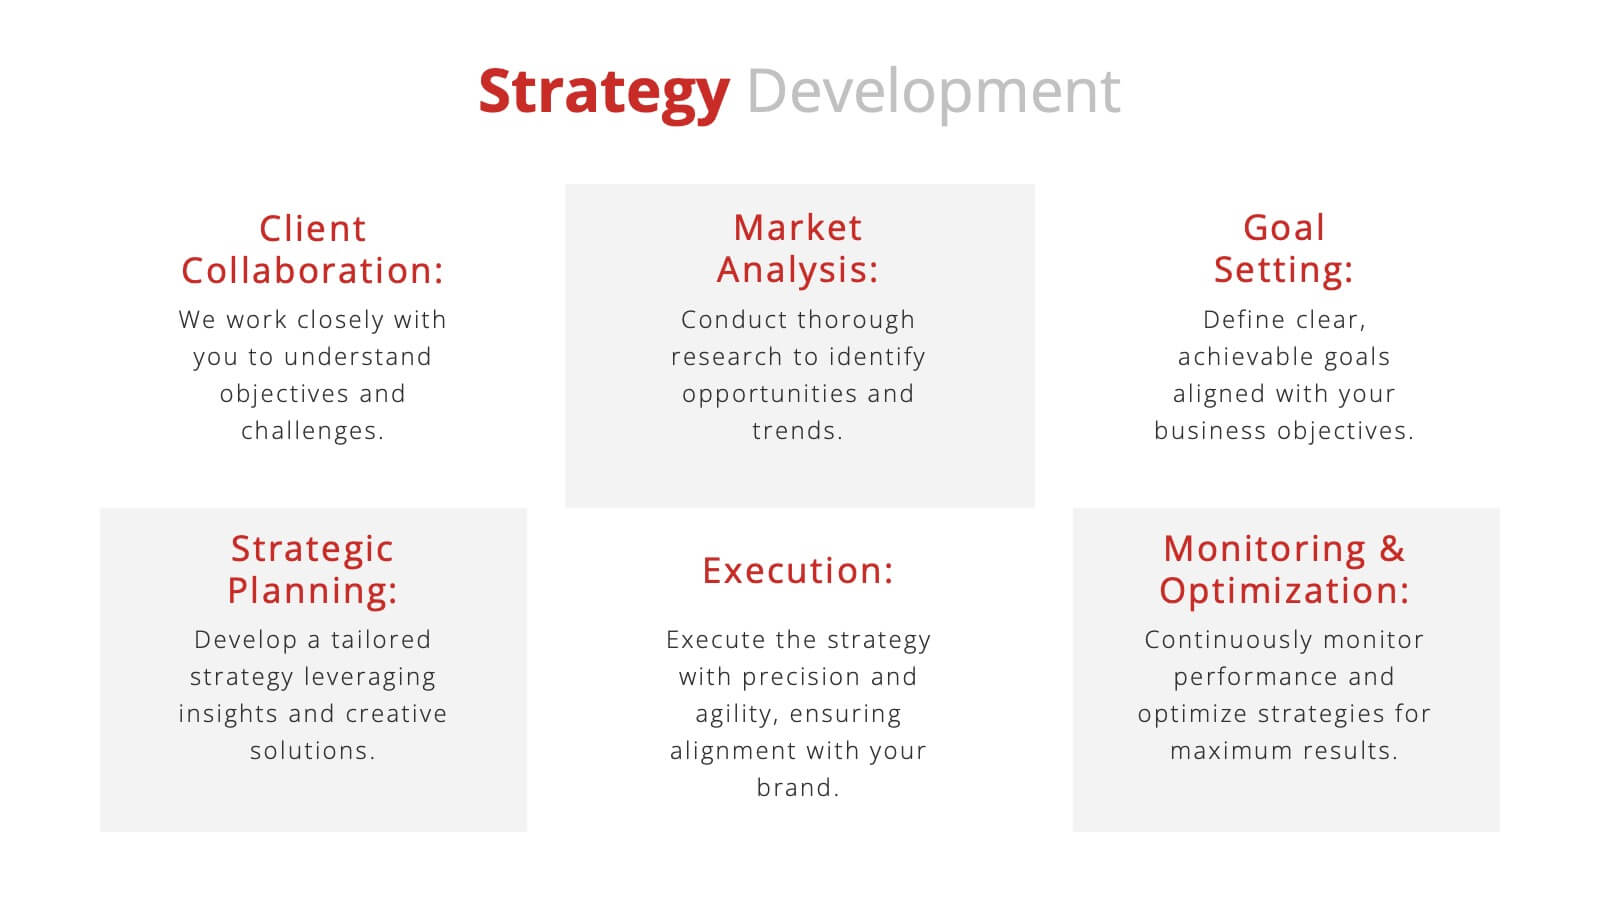
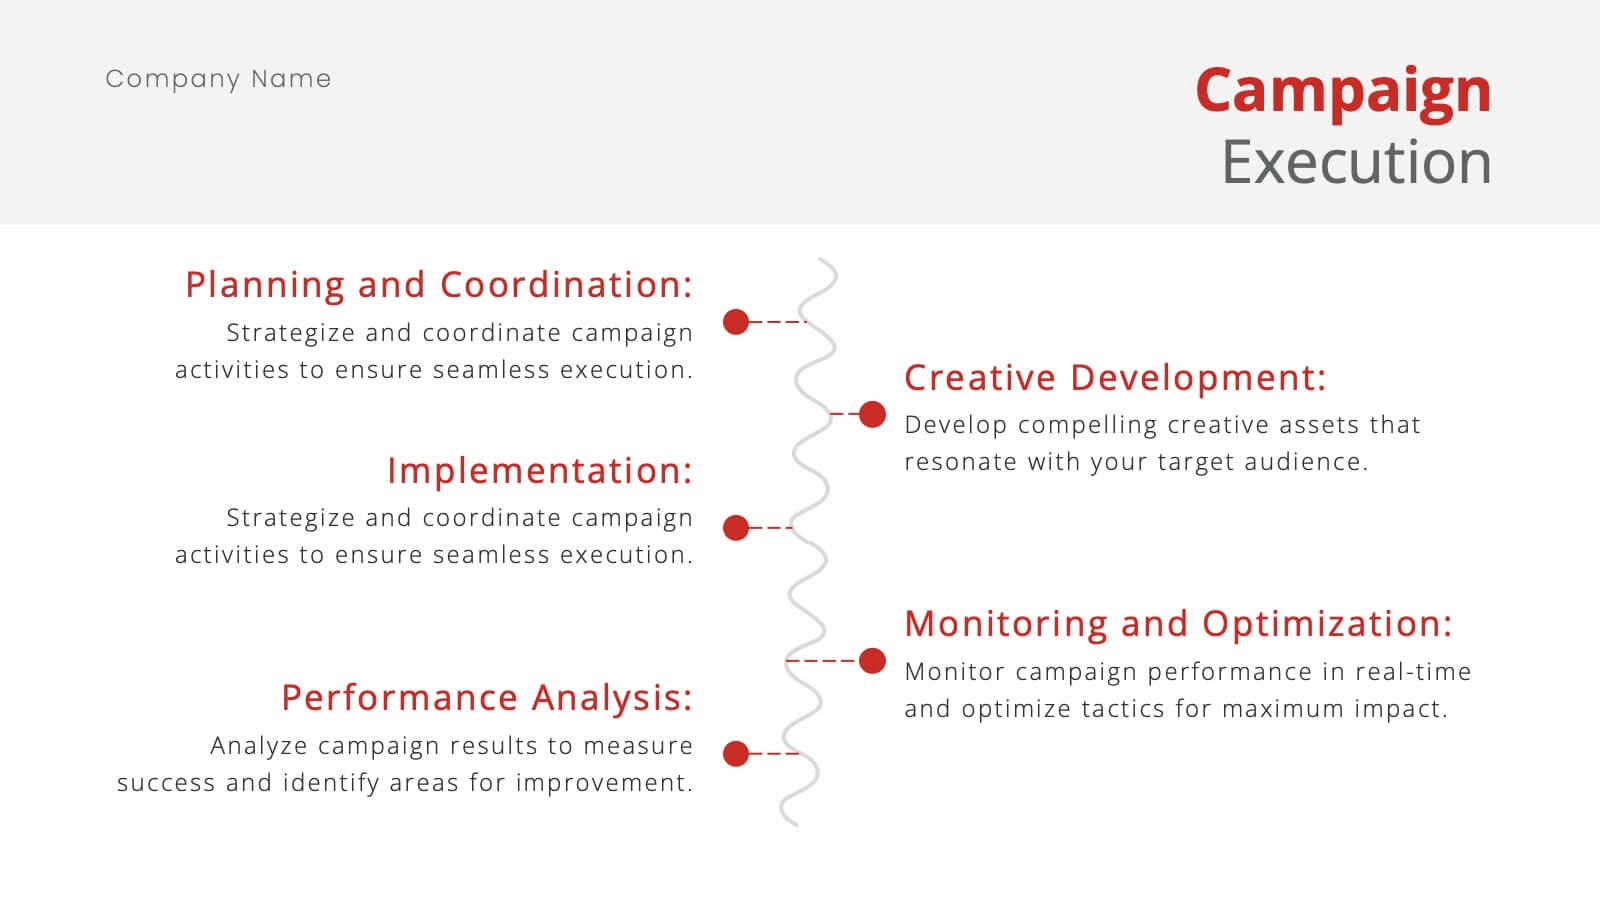
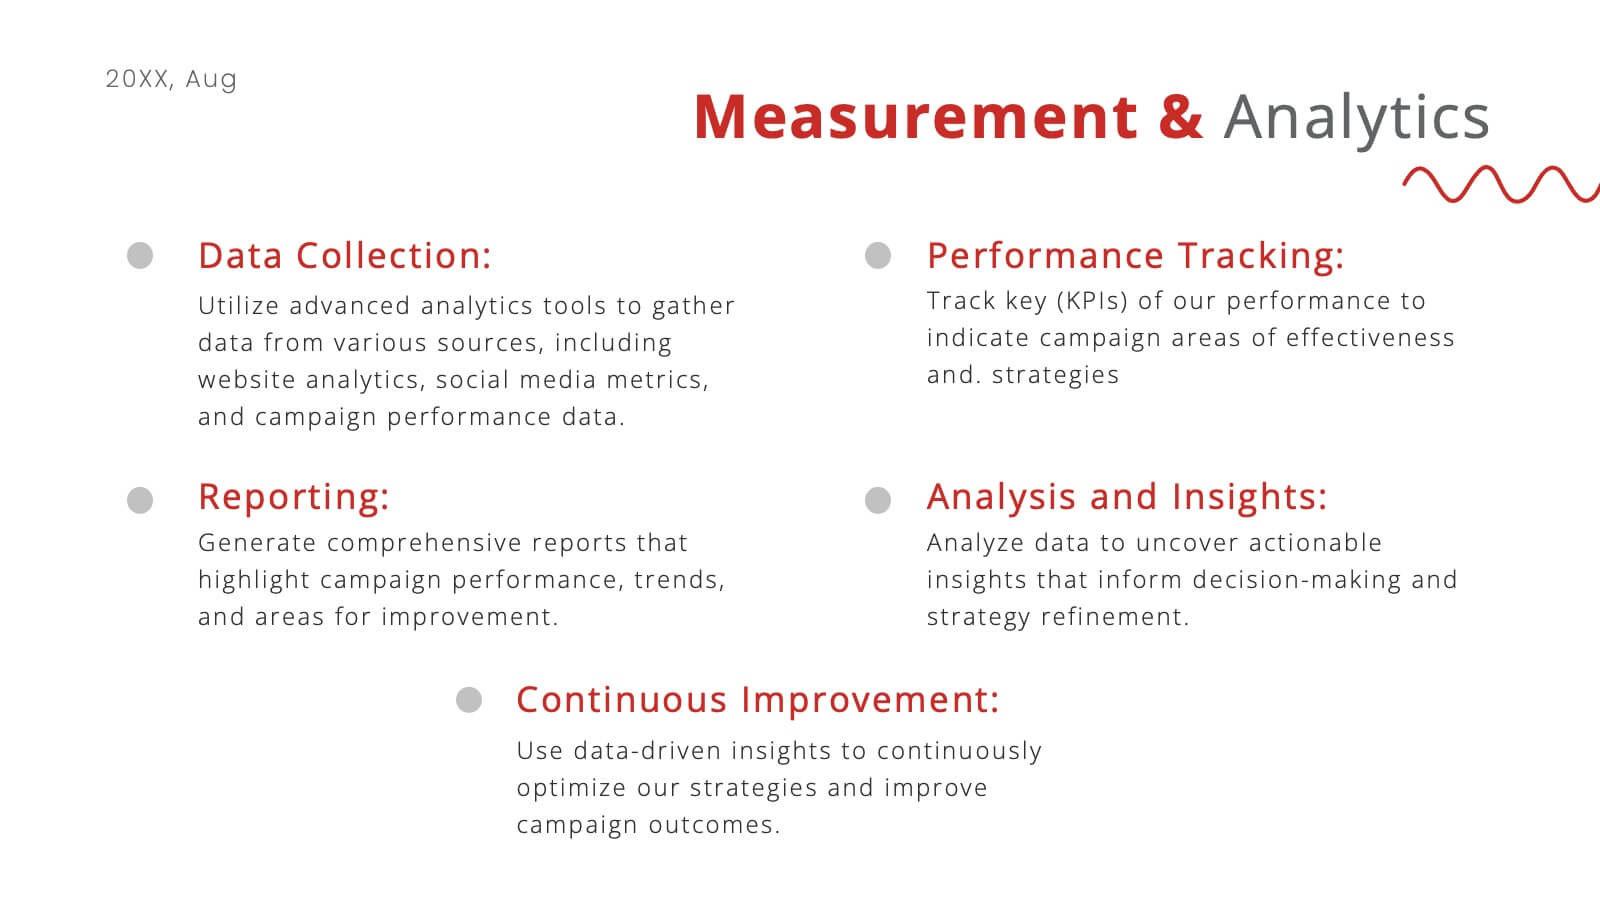
Business Strategy Infographic Presentation Template
A business strategy is a detailed plan that lays your goals, accomplishments and direction for the whole organization. A strategic plan will bring stability to your business and make it more profitable. This template can be used to inform your business on how essential a business strategy is. With this template, your business will learn that creating a strategy will help gain a better understanding of their organization's current strengths and weaknesses. This template is easy to use, includes helpful illustrations and allows you to add tips for managing your business more effectively.


5 slides
US State-by-State Sales Breakdown Presentation
Visualize regional performance with the US State-by-State Sales Breakdown Presentation. This slide uses a clean U.S. map layout to highlight state-specific sales metrics alongside color-coded legends and icons. Ideal for showcasing key market insights, regional trends, or territory growth. Fully editable in Canva, PowerPoint, and Google Slides.


7 slides
Customer Question for Support Infographic
Step into the spotlight with our vibrant Infographic Template, where every inquiry is a star! Designed to dazzle, this template offers a show-stopping way to address customer queries with flair and precision. Imagine vibrant backdrops and playful fonts that turn ordinary support interactions into captivating visual stories.Tailor-made for businesses eager to shine in customer service, this template transforms FAQs into eye-popping, memorable visuals. Whether it’s tech glitches, product how-tos, or service details, your answers will not only be seen—they’ll be remembered. Customize to fit your brand’s personality, deploying colors and styles that resonate with your audience.Ideal for help centers, product support pages, or digital kiosks, it makes customer support not just helpful, but spectacularly engaging. Ready for use with popular graphic design tools, it’s your backstage pass to standing ovations in customer care.


5 slides
CBD Black Market Infographics
Navigate the intricate realities of the cannabis industry with our CBD black market infographics. This essential visual resource, marked by its striking use of pink, orange, and purple hues. It's a tool for law enforcement agencies, legal consultants, and market researchers who are tracking or presenting on the unauthorized distribution within the cannabis industry. The template doesn't just illustrate statistics; it educates on the precautions and market dynamics overshadowed by the black market's presence. Featuring compelling graphics, relevant icons, these infographics synthesize data into more digestible content, aiding in informed decision-making and public awareness campaigns.


23 slides
Delphi Investor Pitch Presentation
The Delphi Pitch Deck offers a warm and inviting design, ideal for conveying complex business concepts in a clear and engaging manner. The deck features a cohesive layout that covers all the essential components of a successful pitch, including company overview, problem statement, solution, market opportunity, and target audience. With a focus on optimizing supply chain efficiency, the template is perfect for startups and businesses looking to showcase their unique selling proposition and innovative strategies. The deck also includes detailed sections on business model canvas, revenue model, competitive landscape, and financial projections, ensuring your audience receives a comprehensive understanding of your business. The soft color palette enhances readability while maintaining a professional tone, making it suitable for various industries. Fully compatible with PowerPoint, Keynote, and Google Slides, the Delphi Pitch Deck is the perfect tool for delivering a memorable and persuasive presentation.


24 slides
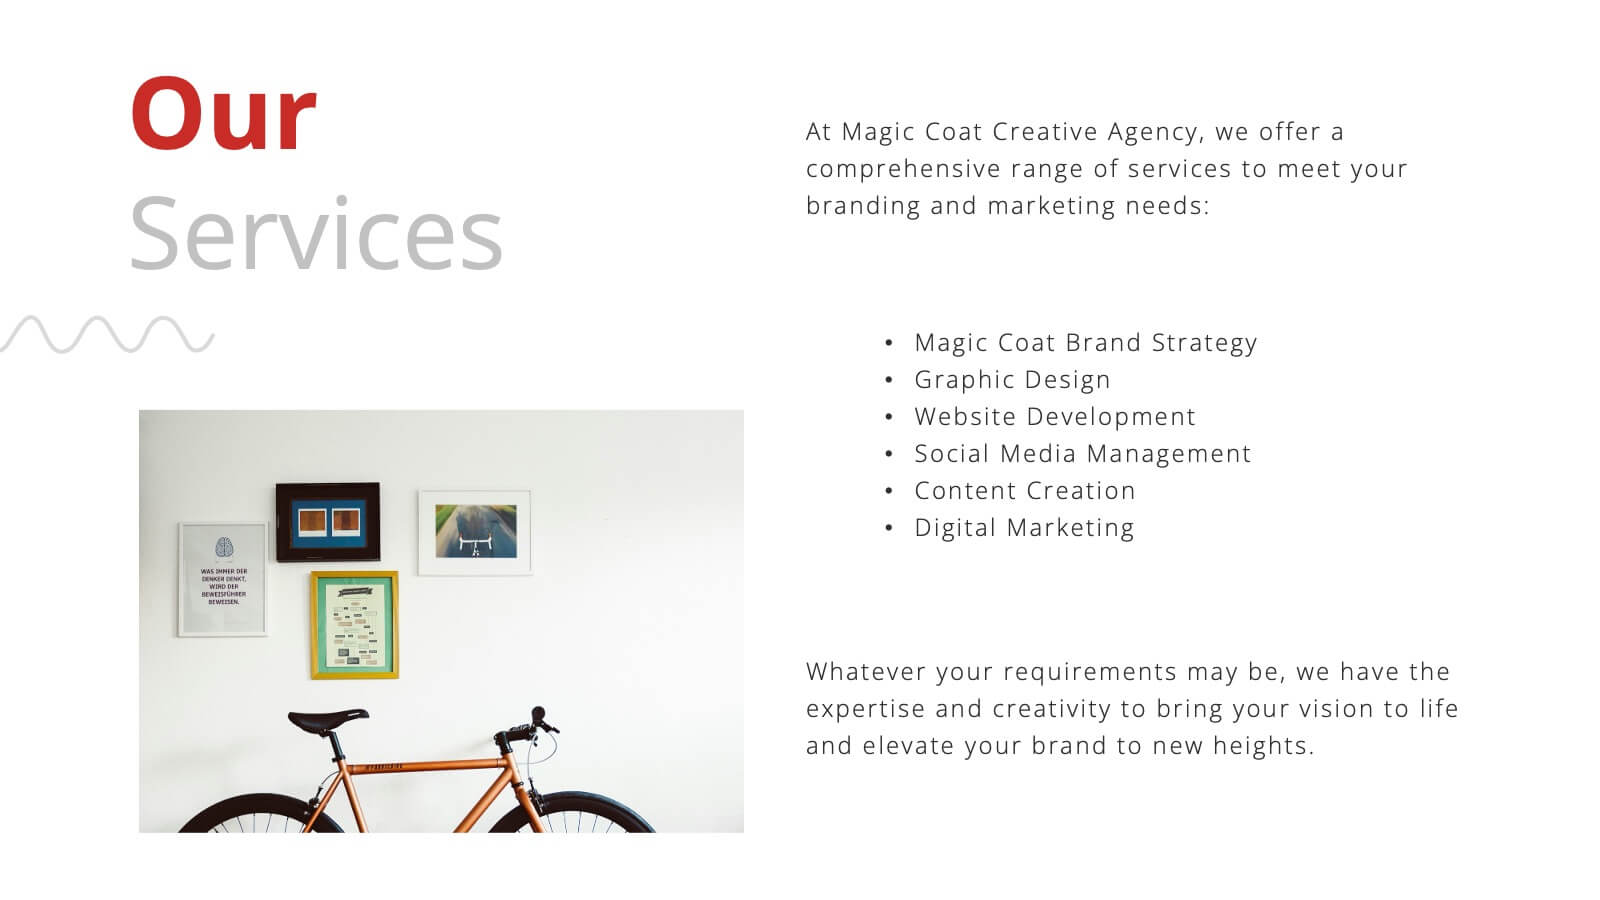
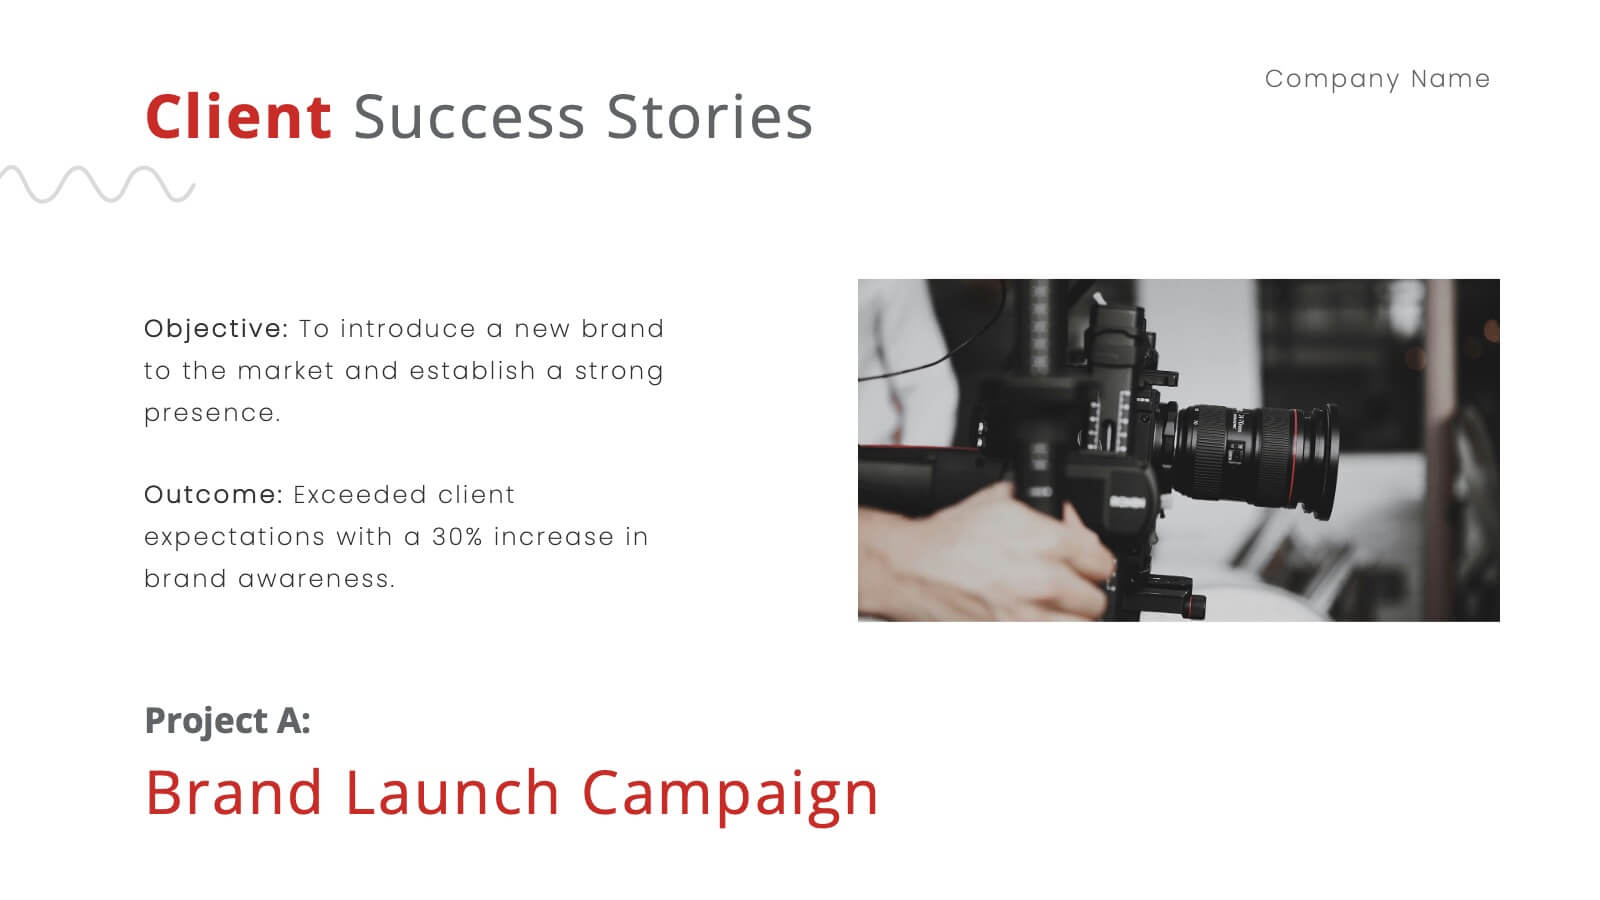
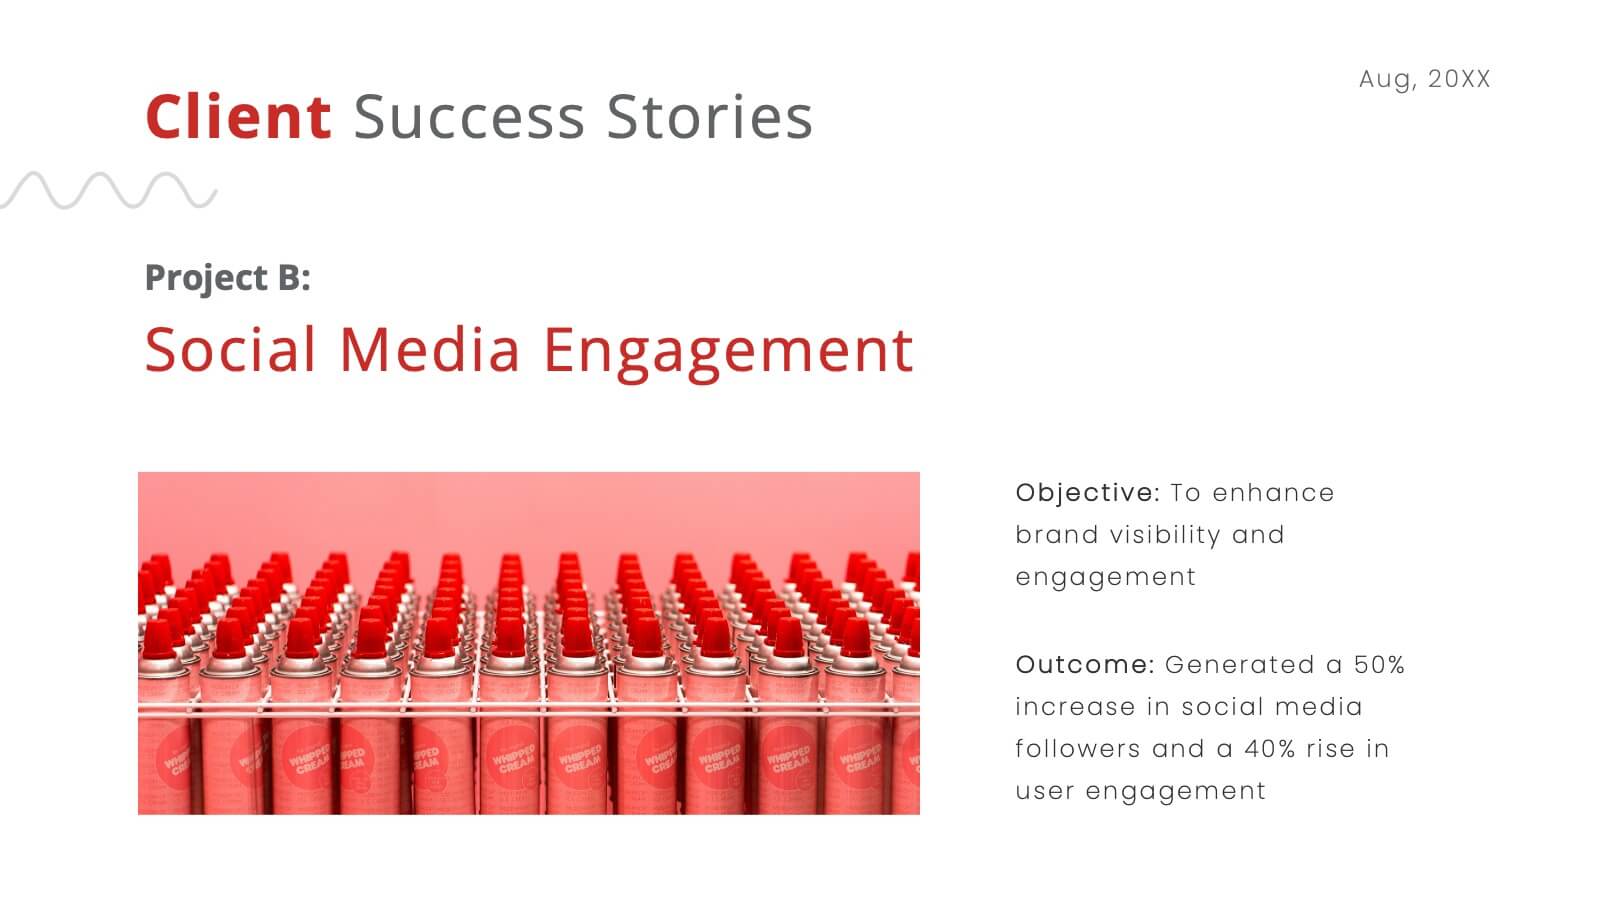
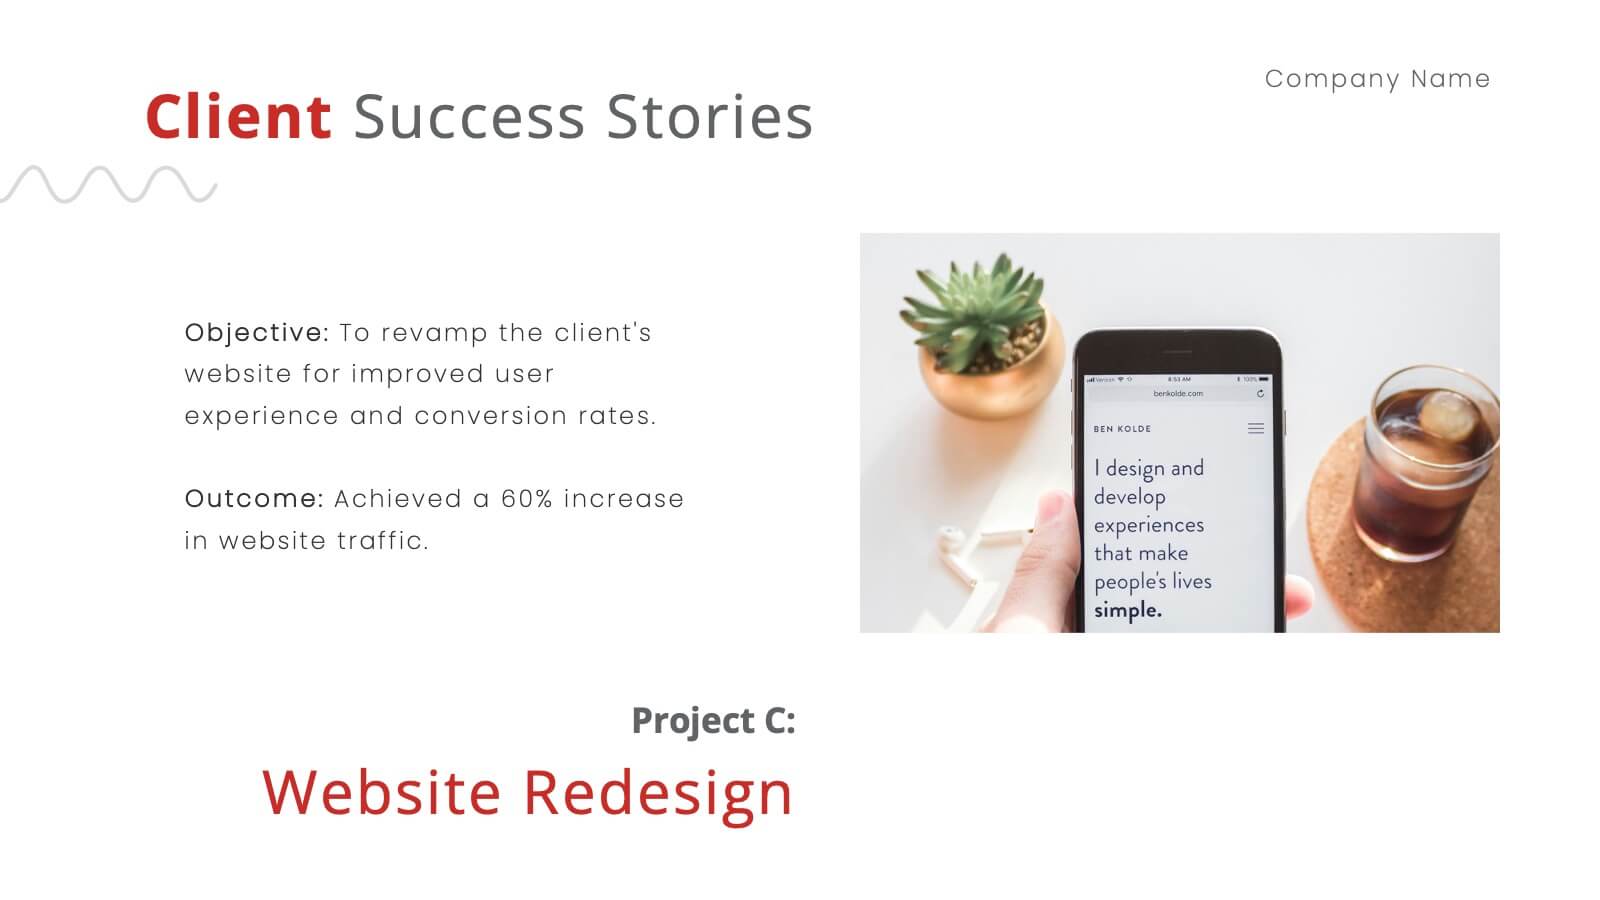
Nickel Advertising Agency Proposal Presentation
Take your advertising agency to the next level with this sleek and modern presentation template! Highlighting your services, team, success stories, and marketing strategies, it’s the perfect tool to showcase your agency’s strengths and capabilities. Fully customizable and compatible with PowerPoint, Keynote, and Google Slides, this template is ideal for impressing potential clients and partners.


4 slides
Idea Generation for Business Development Presentation
Visualize your brainstorming process with this dynamic lightbulb-themed slide. Perfect for showcasing strategic thinking, innovation pipelines, or development stages. With colorful icons and space for four key points, it’s easy to tailor in PowerPoint, Keynote, or Google Slides. Ideal for entrepreneurs, startups, and corporate ideation sessions. Clean, modern, and impactful.


4 slides
Buyer Persona Research and Profile Map Presentation
Make your audience feel like they already know your ideal customer. This creative template helps you visually map out key buyer persona data, such as demographics, goals, behavior, and pain points. Perfect for marketing strategy and customer research presentations. Fully compatible with PowerPoint, Keynote, and Google Slides for seamless editing.


5 slides
Restaurant Regulations Infographics
Restaurant Regulations are crucial for ensuring food safety and hygiene. This infographic is designed in vertical format, allowing for easy display on digital platforms such as social media or the restaurant's website. This is designed to help restaurants communicate regulations to their staff and customers. The use of visually appealing graphics and colors help make the information more engaging and easier to understand. It can also be customized with the restaurant's branding and logo to create a cohesive look and feel. The infographic is divided into sections, each for covering different areas of your regulations.