


Features
- 6 Unique slides
- Fully editable and easy to edit in Microsoft Powerpoint, Keynote and Google Slides
- 16:9 widescreen layout
- Clean and professional designs
- Export to JPG, PDF or send by email


Do you have any questions?
Recommend


6 slides
Break Even Options Infographic
Break-even analysis is a financial calculation that helps businesses determine the point at which their total revenue equals their total costs, resulting in neither a profit nor a loss. This infographic template provides a clear visual representation of the concept of breakeven in options trading, helping traders understand the point at which profits and losses balance out. This template is a valuable tool for businesses to assess the level of sales needed to cover their costs and begin making a profit. Use this template to provide your viewers insights and help make informed decisions to optimize operations.


6 slides
Product Life Cycle Stages Infographic
The product life cycle is a concept that describes the various stages that a product goes through from its introduction to its eventual decline in the market. This infographic visually represents the different stages a product goes through from its introduction to its eventual decline in the market. The product stages included in this template help businesses understand and manage the different phases of a product's existence and make informed decisions about marketing, production, and strategy. This template is fully customizable and compatible with Powerpoint, Keynote, and Google Slides.


6 slides
Strategic PESTEL Presentation
Kickstart smarter strategy sessions with a clean, colorful layout that makes external factor analysis feel effortless. This presentation helps teams map trends, identify risks, and understand the broader environment shaping business decisions. Clear visuals keep insights organized and actionable. Fully compatible with PowerPoint, Keynote, and Google Slides.


6 slides
Experience-Based Smile Indicator Slide
Visualize customer sentiment with the Experience-Based Smile Indicator Slide Presentation. Featuring a clean horizontal scale of five emotive icons—from delighted to dissatisfied—this slide is ideal for summarizing user experience, support ratings, or service feedback. Fully customizable in PowerPoint, Keynote, and Google Slides, it's a smart, visual way to display satisfaction levels.


4 slides
Cost Analysis and Budget Overview Presentation
Break down financial details with clarity using the Cost Analysis and Budget Overview Presentation. This slide helps you present cost structures, budget allocations, and key financial metrics side by side using icons and visual data blocks. Perfect for reports, planning, or investment decks. Fully editable in PowerPoint, Google Slides, Keynote, and Canva.


7 slides
Social Media Infographic Presentation Template
Social media is an important business tool due to the fact that it allows you to reach, nurture, and engage with customers no matter where they are located. Additionally, it allows you to target new audiences, create brand awareness, and grow your following. This template features a clean, fun design that is easy to read. With a variety of slides and infographics, it makes it simple to create. This template will inform you how social media can be a powerful tool. This template is a great way to keep your information organized and includes tips that can be added at the bottom of each section.


5 slides
Hydrological Cycle Explained Presentation
Break down complex water systems with ease using the Hydrological Cycle Explained Presentation. This clean and modern slide illustrates each phase of the cycle—from precipitation to collection—with intuitive icons and a pipeline layout. Ideal for educational, environmental, or sustainability content. Fully editable in Canva, PowerPoint, Keynote, and Google Slides.


5 slides
Social Media Strategies Presentation
Bring your online vision to life with a clean, modern layout that makes planning campaigns feel effortless. This presentation helps you map out goals, content pillars, audience insights, and platform tactics with clarity and impact. Fully editable and compatible with PowerPoint, Keynote, and Google Slides.


6 slides
Budget Allocation Strategy Presentation
Break down your budget plan with this clear and modern 6-point layout. Featuring a central money bag icon and segmented categories, this slide is perfect for financial strategy, departmental budgeting, or resource distribution. Fully editable in Canva, PowerPoint, or Google Slides for easy customization to match your brand.


6 slides
Strategic Project Proposal Overview
Present your project priorities with clarity using this bold and colorful Strategic Project Proposal slide. With five stacked segments, it’s ideal for outlining phases, features, or deliverables in a structured format. Fully editable in PowerPoint, Keynote, and Google Slides to suit any industry or workflow.


10 slides
Business Performance Metrics Presentation
Track and display your business metrics effectively with the "Business Performance Metrics" presentation templates. These visually engaging slides are designed to help you present key performance indicators in a clear and structured manner, enhancing understanding and decision-making. Ideal for corporate presentations, these templates are fully compatible with PowerPoint, Keynote, and Google Slides, ensuring seamless integration into your workflow.


10 slides
Pharmaceutical Industry Report Presentation
Turn complex medical data into clear insights with this sleek, capsule-themed presentation. Ideal for pharmaceutical companies, healthcare professionals, and research analysts, it simplifies industry reports, drug data, and market trends with a clean, professional design. Fully editable and compatible with PowerPoint, Keynote, and Google Slides for easy customization.


4 slides
Business Growth through AIDA Model Presentation
Visualize the buyer’s journey with this engaging AIDA model slide. Featuring rounded 3D-style shapes and clear progression from Attention to Action, this layout is ideal for marketing plans, customer engagement strategies, or sales funnels. Each stage is color-coded and icon-enhanced for clarity. Easily customizable in PowerPoint, Keynote, and Google Slides.


6 slides
PESTEL Management Infographic
PESTEL analysis is a framework used to assess and analyze the external macro-environmental factors that can impact an organization, industry, or market. This infographic template provides an overview of the PESTEL analysis framework and its application in strategic management. This template provides a clear and concise explanation of the PESTEL analysis framework, detailing each component of the acronym for you to use. It highlights the significance of considering these external factors when formulating business strategies and making informed decisions. Compatible with Powerpoint, Keynote, and Google Slides.

21 slides
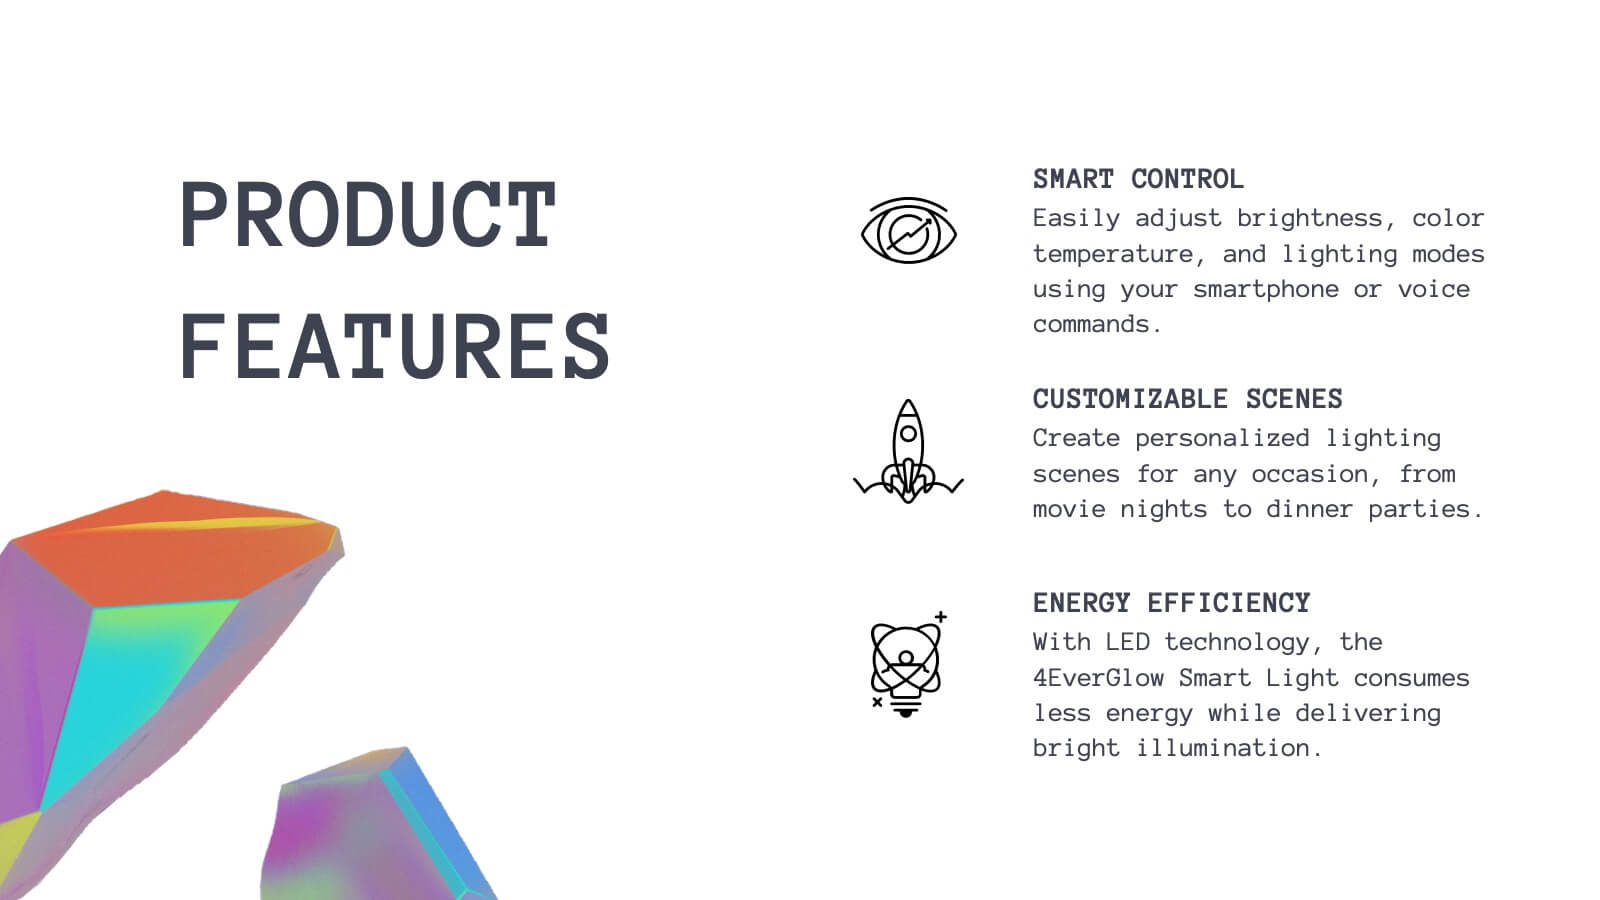
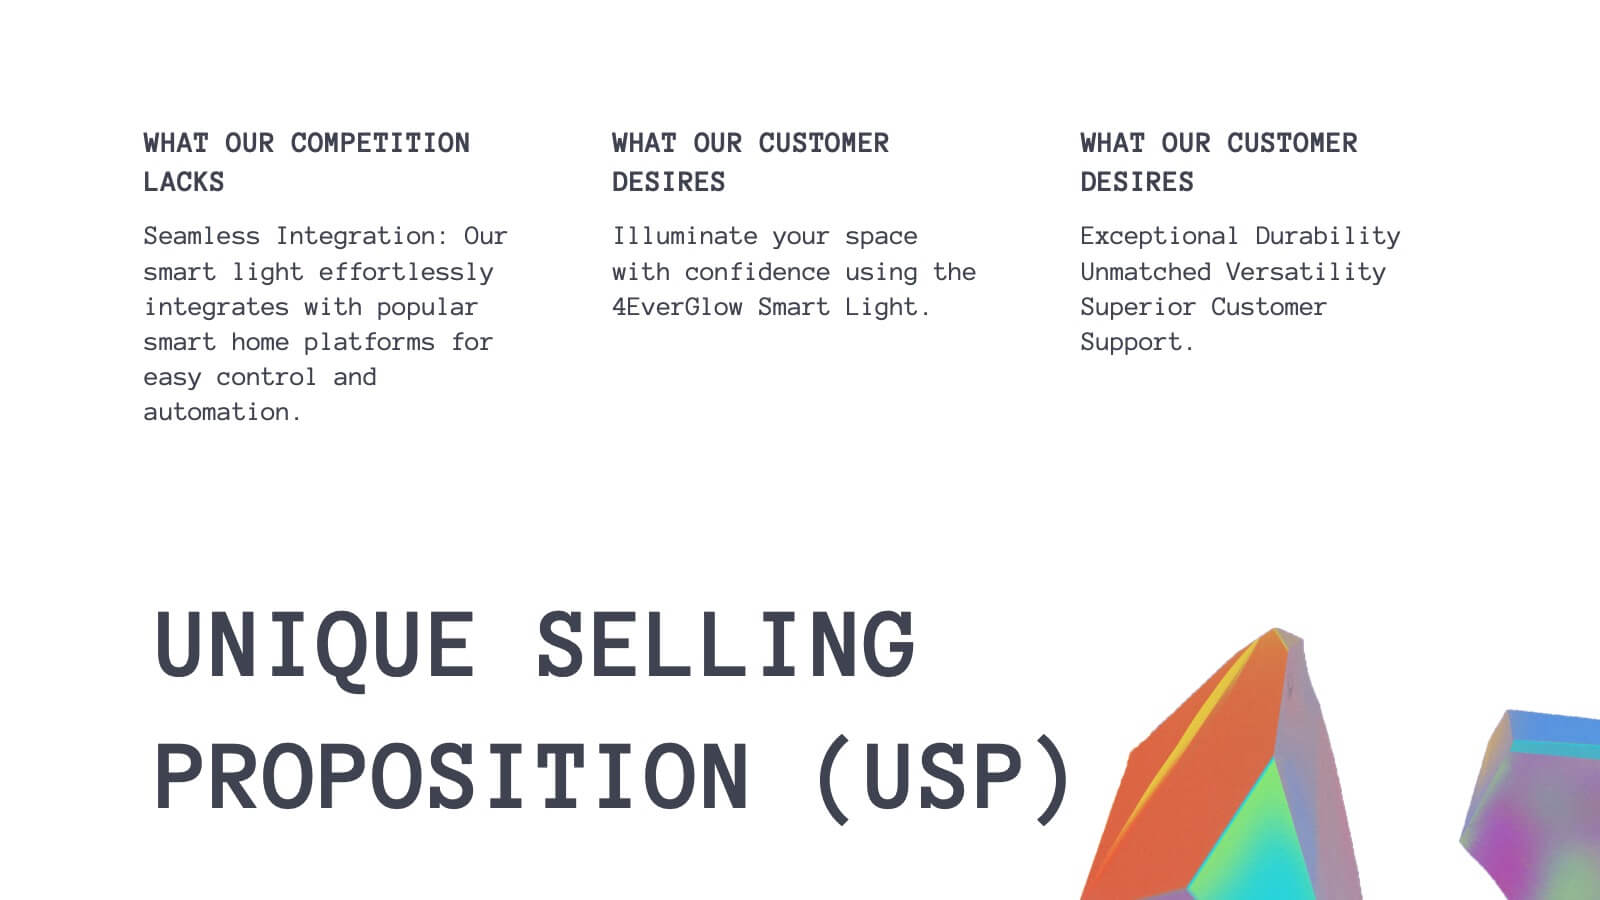
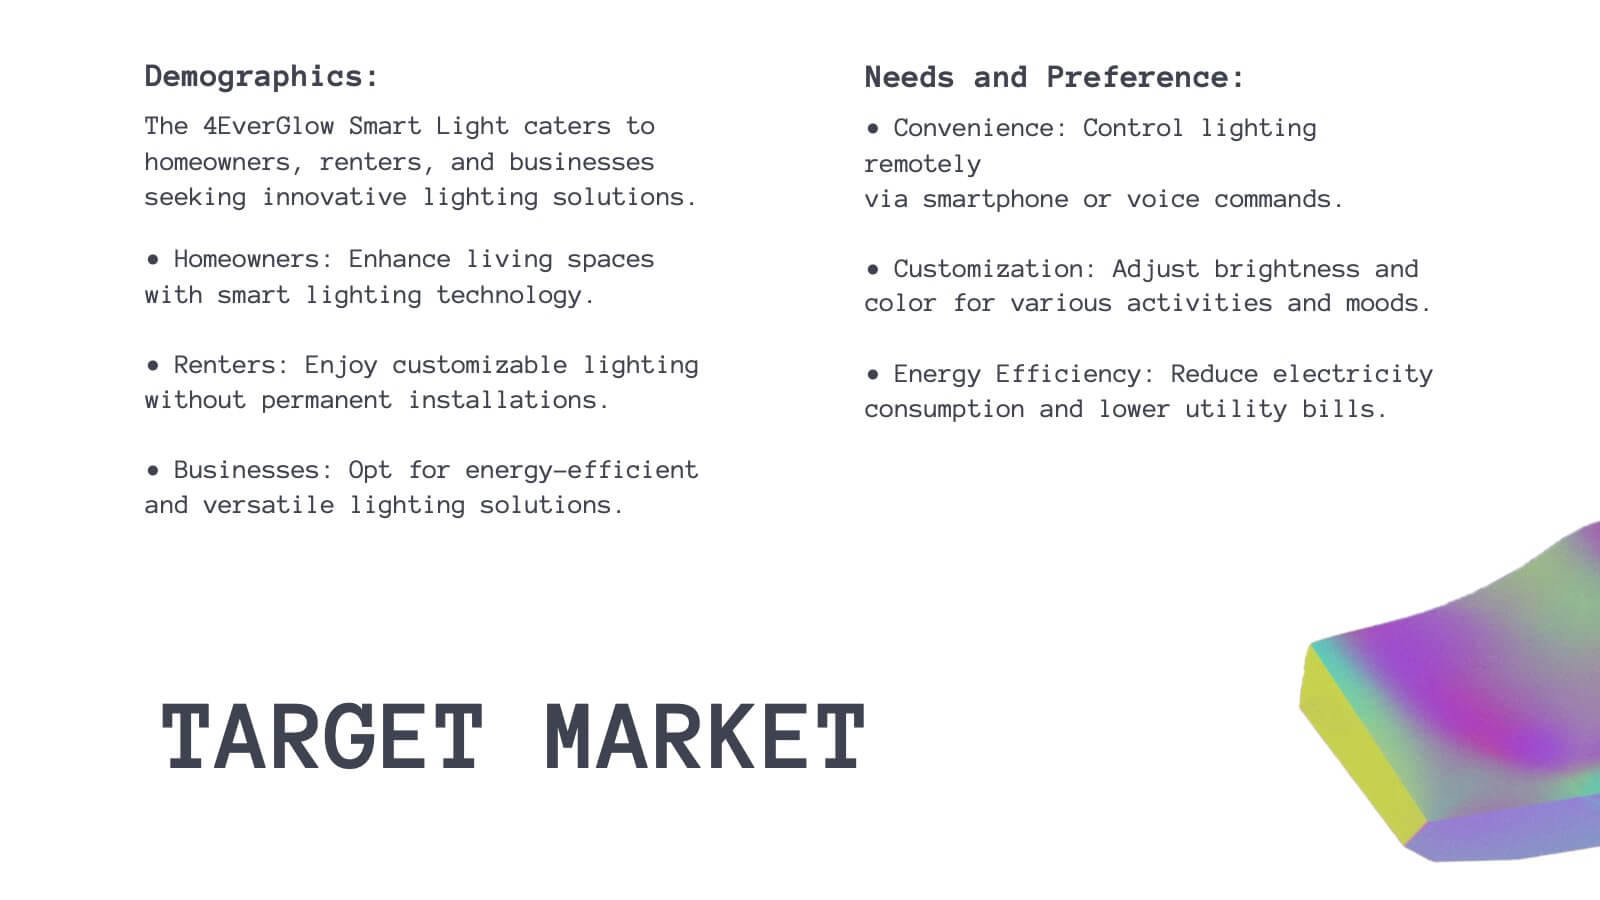
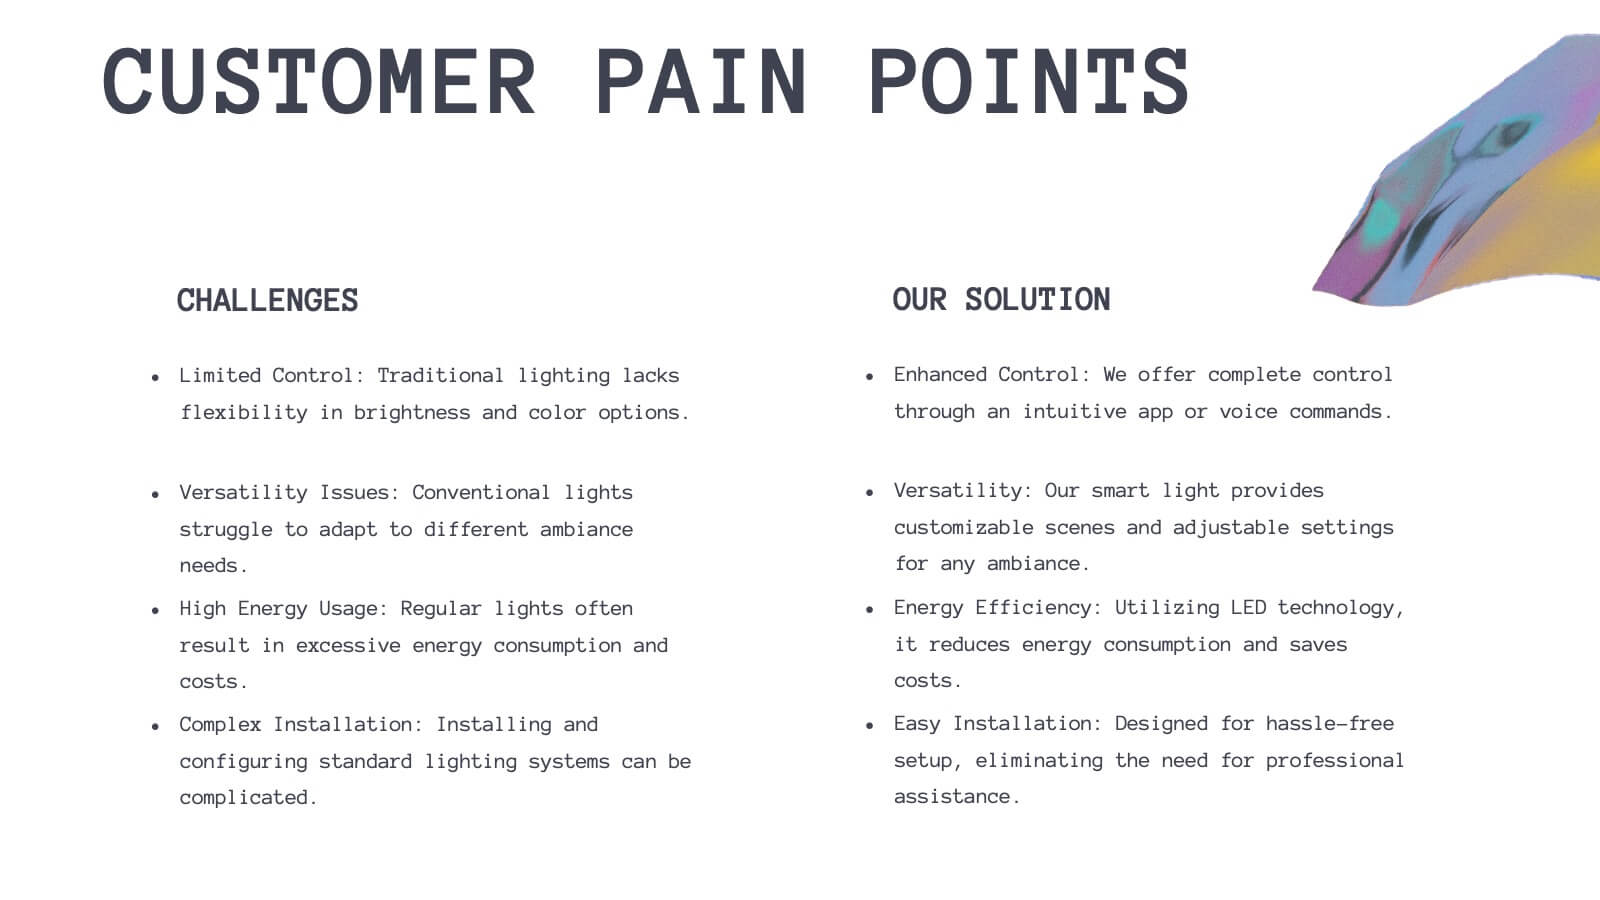
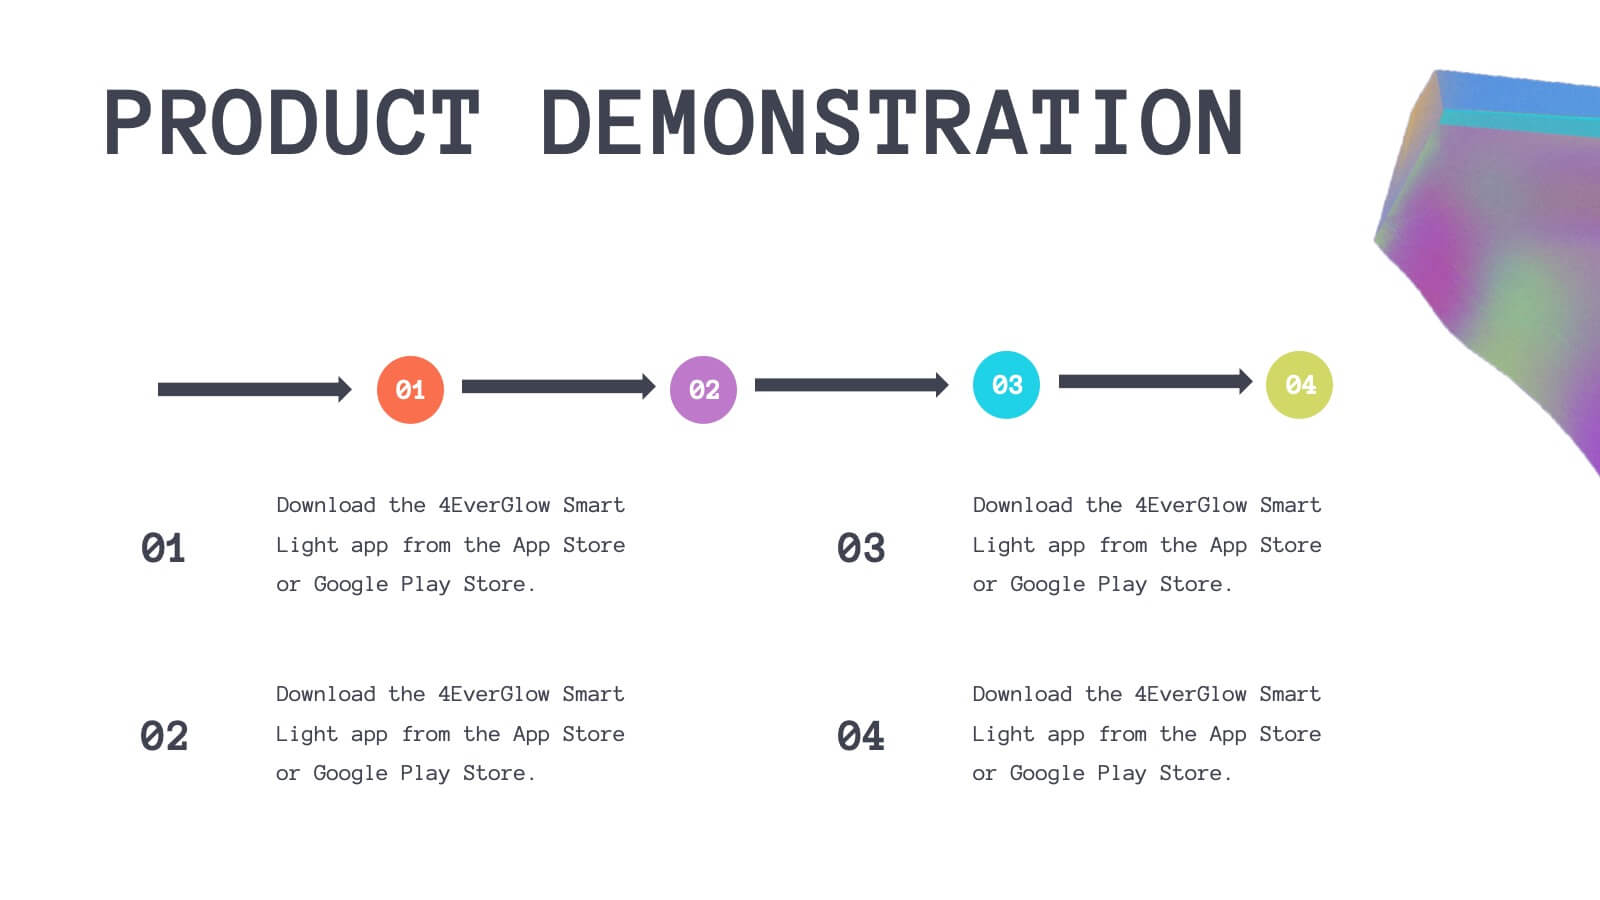
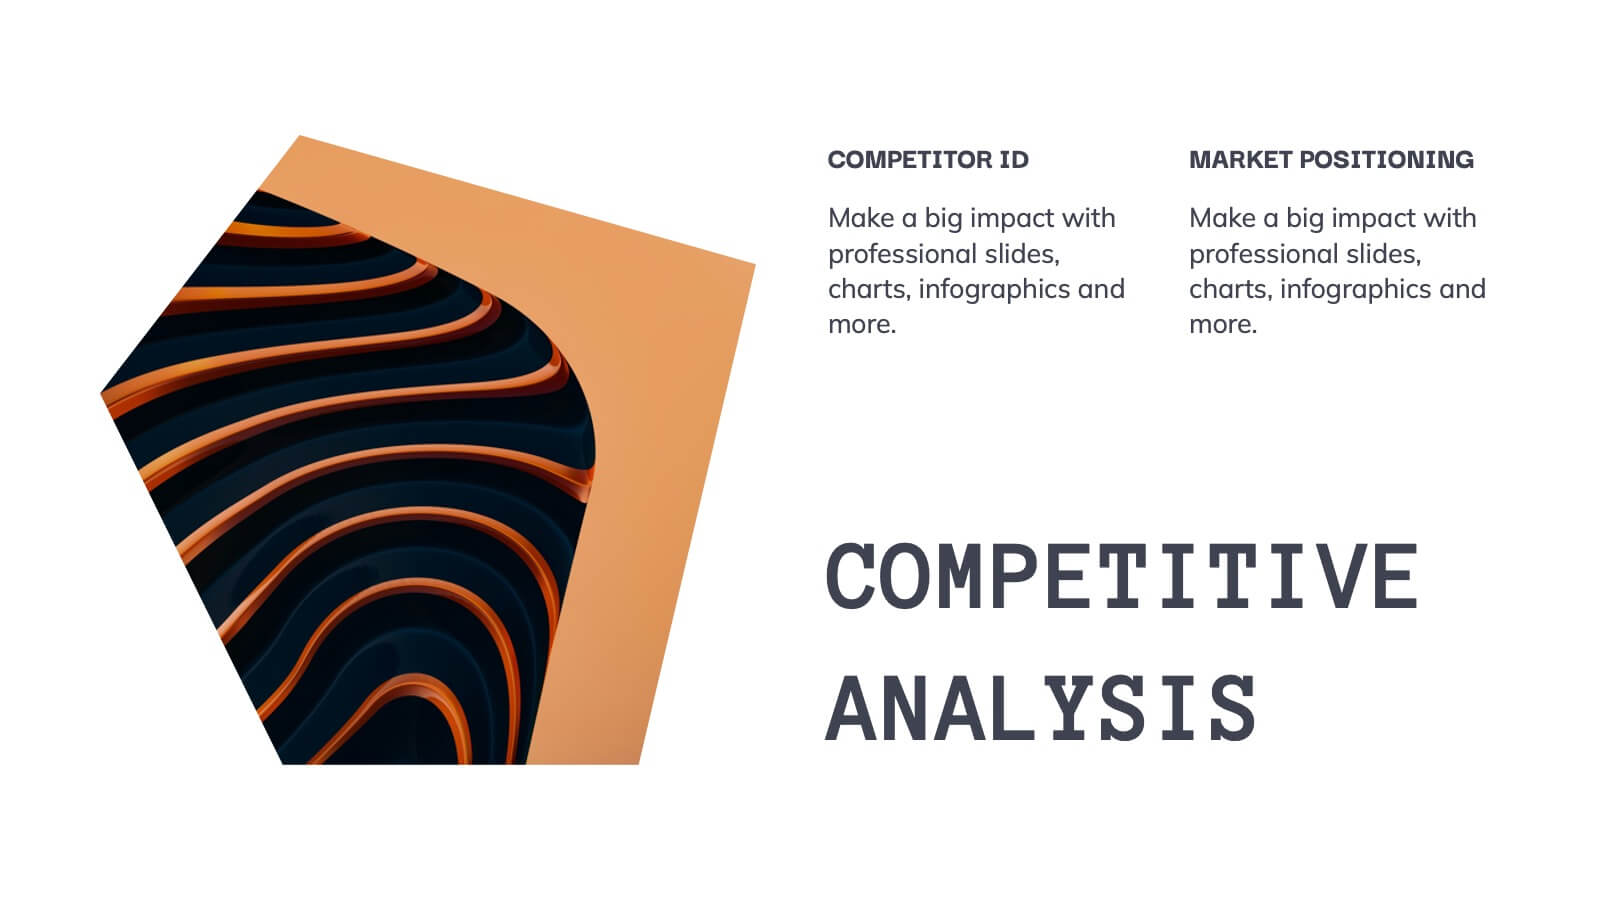
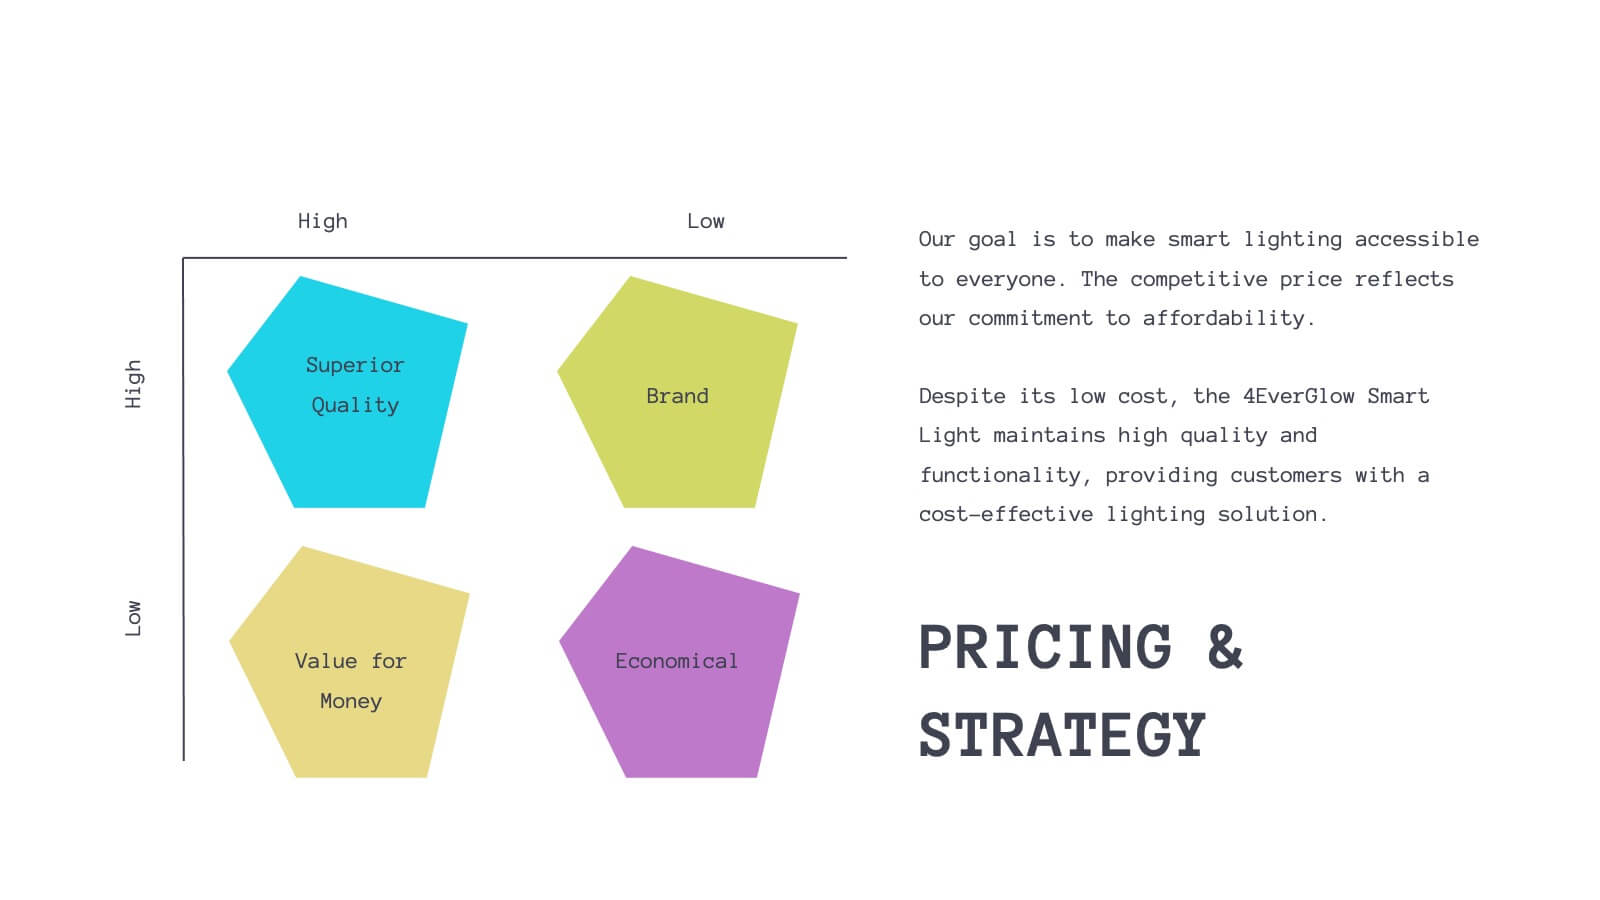
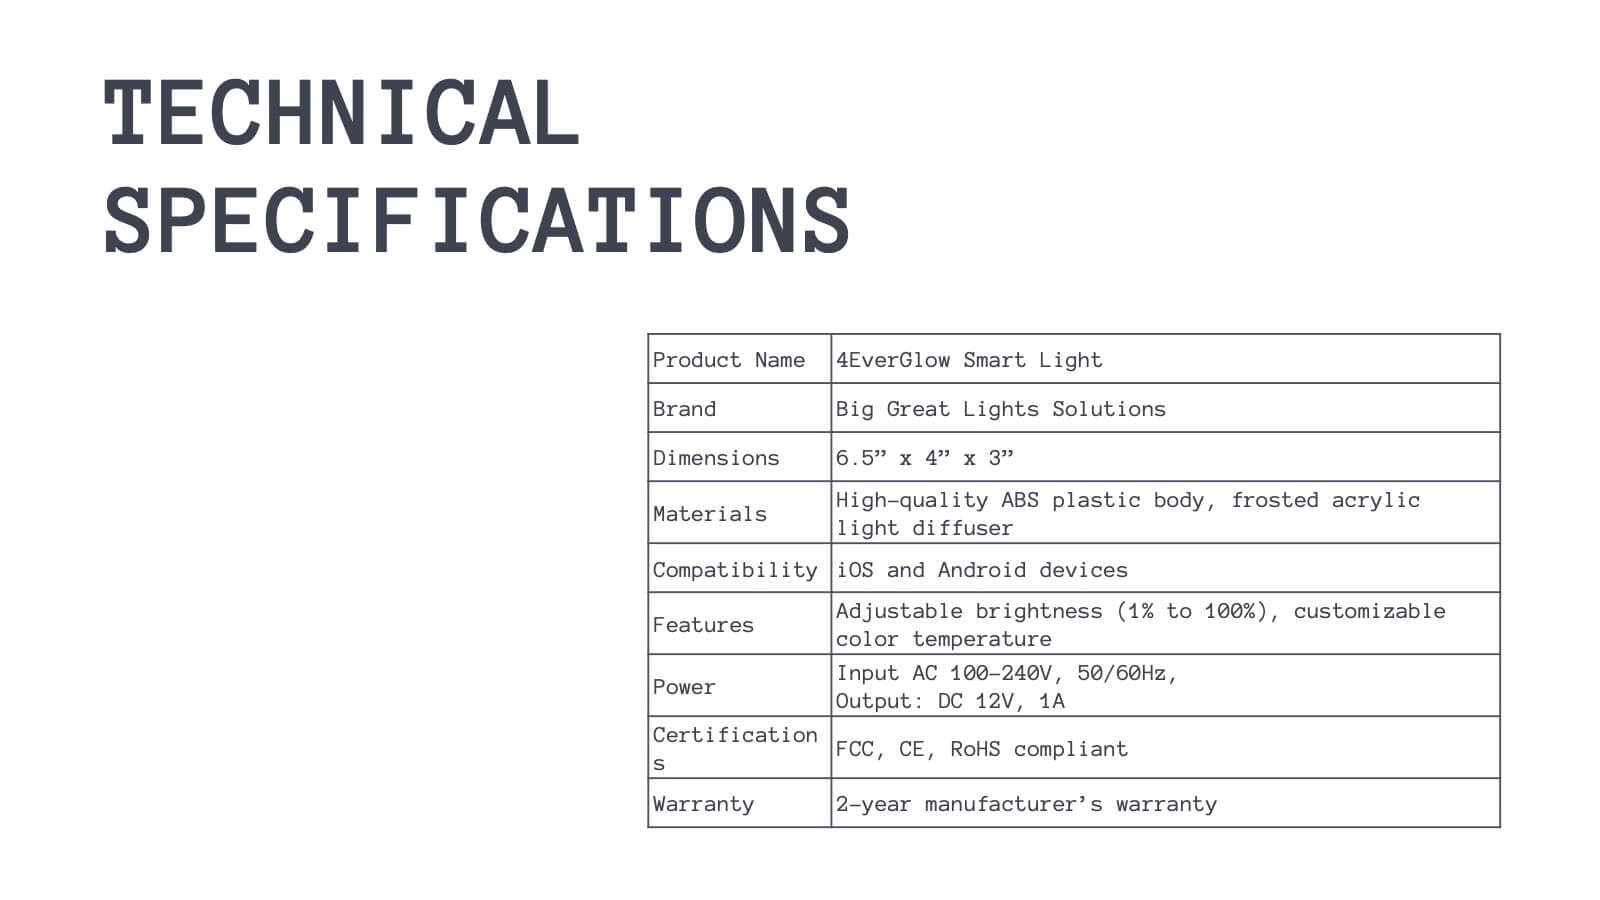
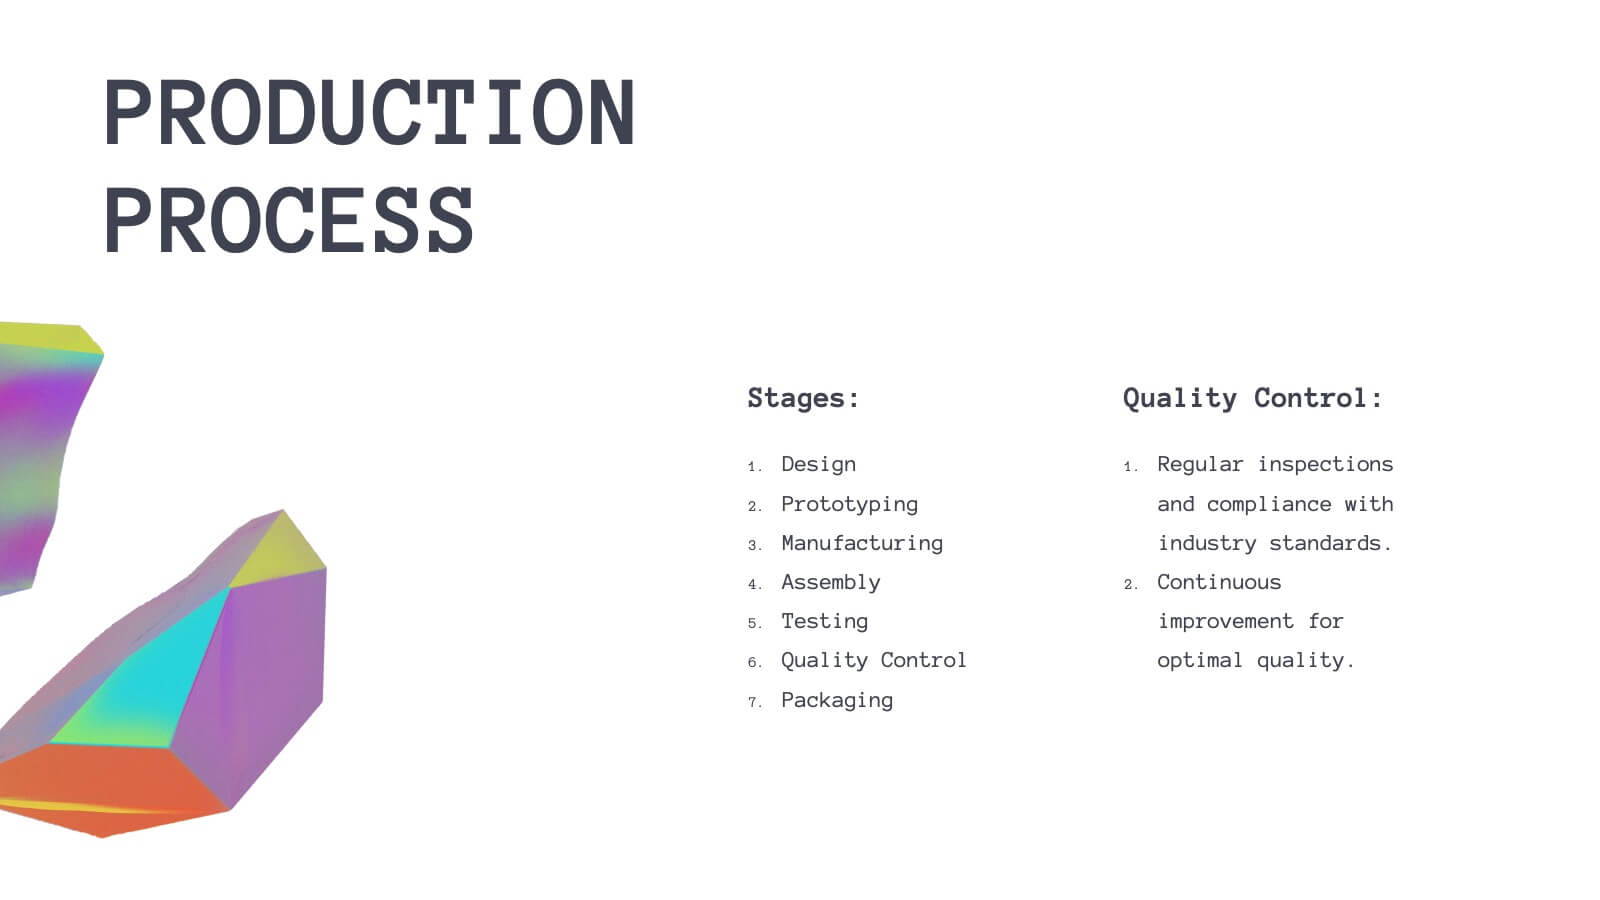
Luster Product Roadmap Presentation
Bring your product journey to life with this vibrant, modern presentation template! Perfect for guiding your audience through product features, customer pain points, and competitive analysis, it’s designed for maximum clarity and engagement. Whether you’re showcasing technical specs or marketing strategies, this template fits all your needs. Compatible with PowerPoint, Keynote, and Google Slides.


7 slides
Master Six Sigma Infographic Presentation
Six Sigma is a methodology used by organizations to improve their business processes and eliminate defects. Use this template to explore the key concepts of Six Sigma and how it can be applied in different industries. This templates include helpful illustrations, charts and tips which allow you to present information in a clear and concise way that makes it easy for your audience to understand and take notes. This template has been made using modern fonts, appealing color combinations and simple layouts. The clean and simple design is compatible with Powerpoint, Keynote and Google Slides.
6 slides
Arrow Segments for Goal Tracking Presentation
Clearly define objectives and measure performance with the Arrow Segments for Goal Tracking Presentation. This visually engaging dartboard-style layout is perfect for showcasing KPIs, targets, or strategic milestones. Each arrow represents a key focus area, allowing you to highlight priorities and progress. Fully customizable in PowerPoint, Google Slides, and Canva.