


Features
- 8 Unique Slides
- Fully editable and easy to edit in Microsoft Powerpoint, Keynote and Google Slides
- 16:9 widescreen layout
- Clean and professional designs
- Export to JPG, PDF or send by email


Do you have any questions?
Recommend


6 slides
Environmental Policy and Sustainability Plan Presentation
Bring your sustainability message to life with a visual that flows as smoothly as your plan. This infographic presentation template helps explain your environmental goals, action steps, and policy structure using a dynamic, easy-to-follow circular layout. Perfect for eco reports and green strategy briefs. Compatible with PowerPoint, Keynote, and Google Slides.


21 slides
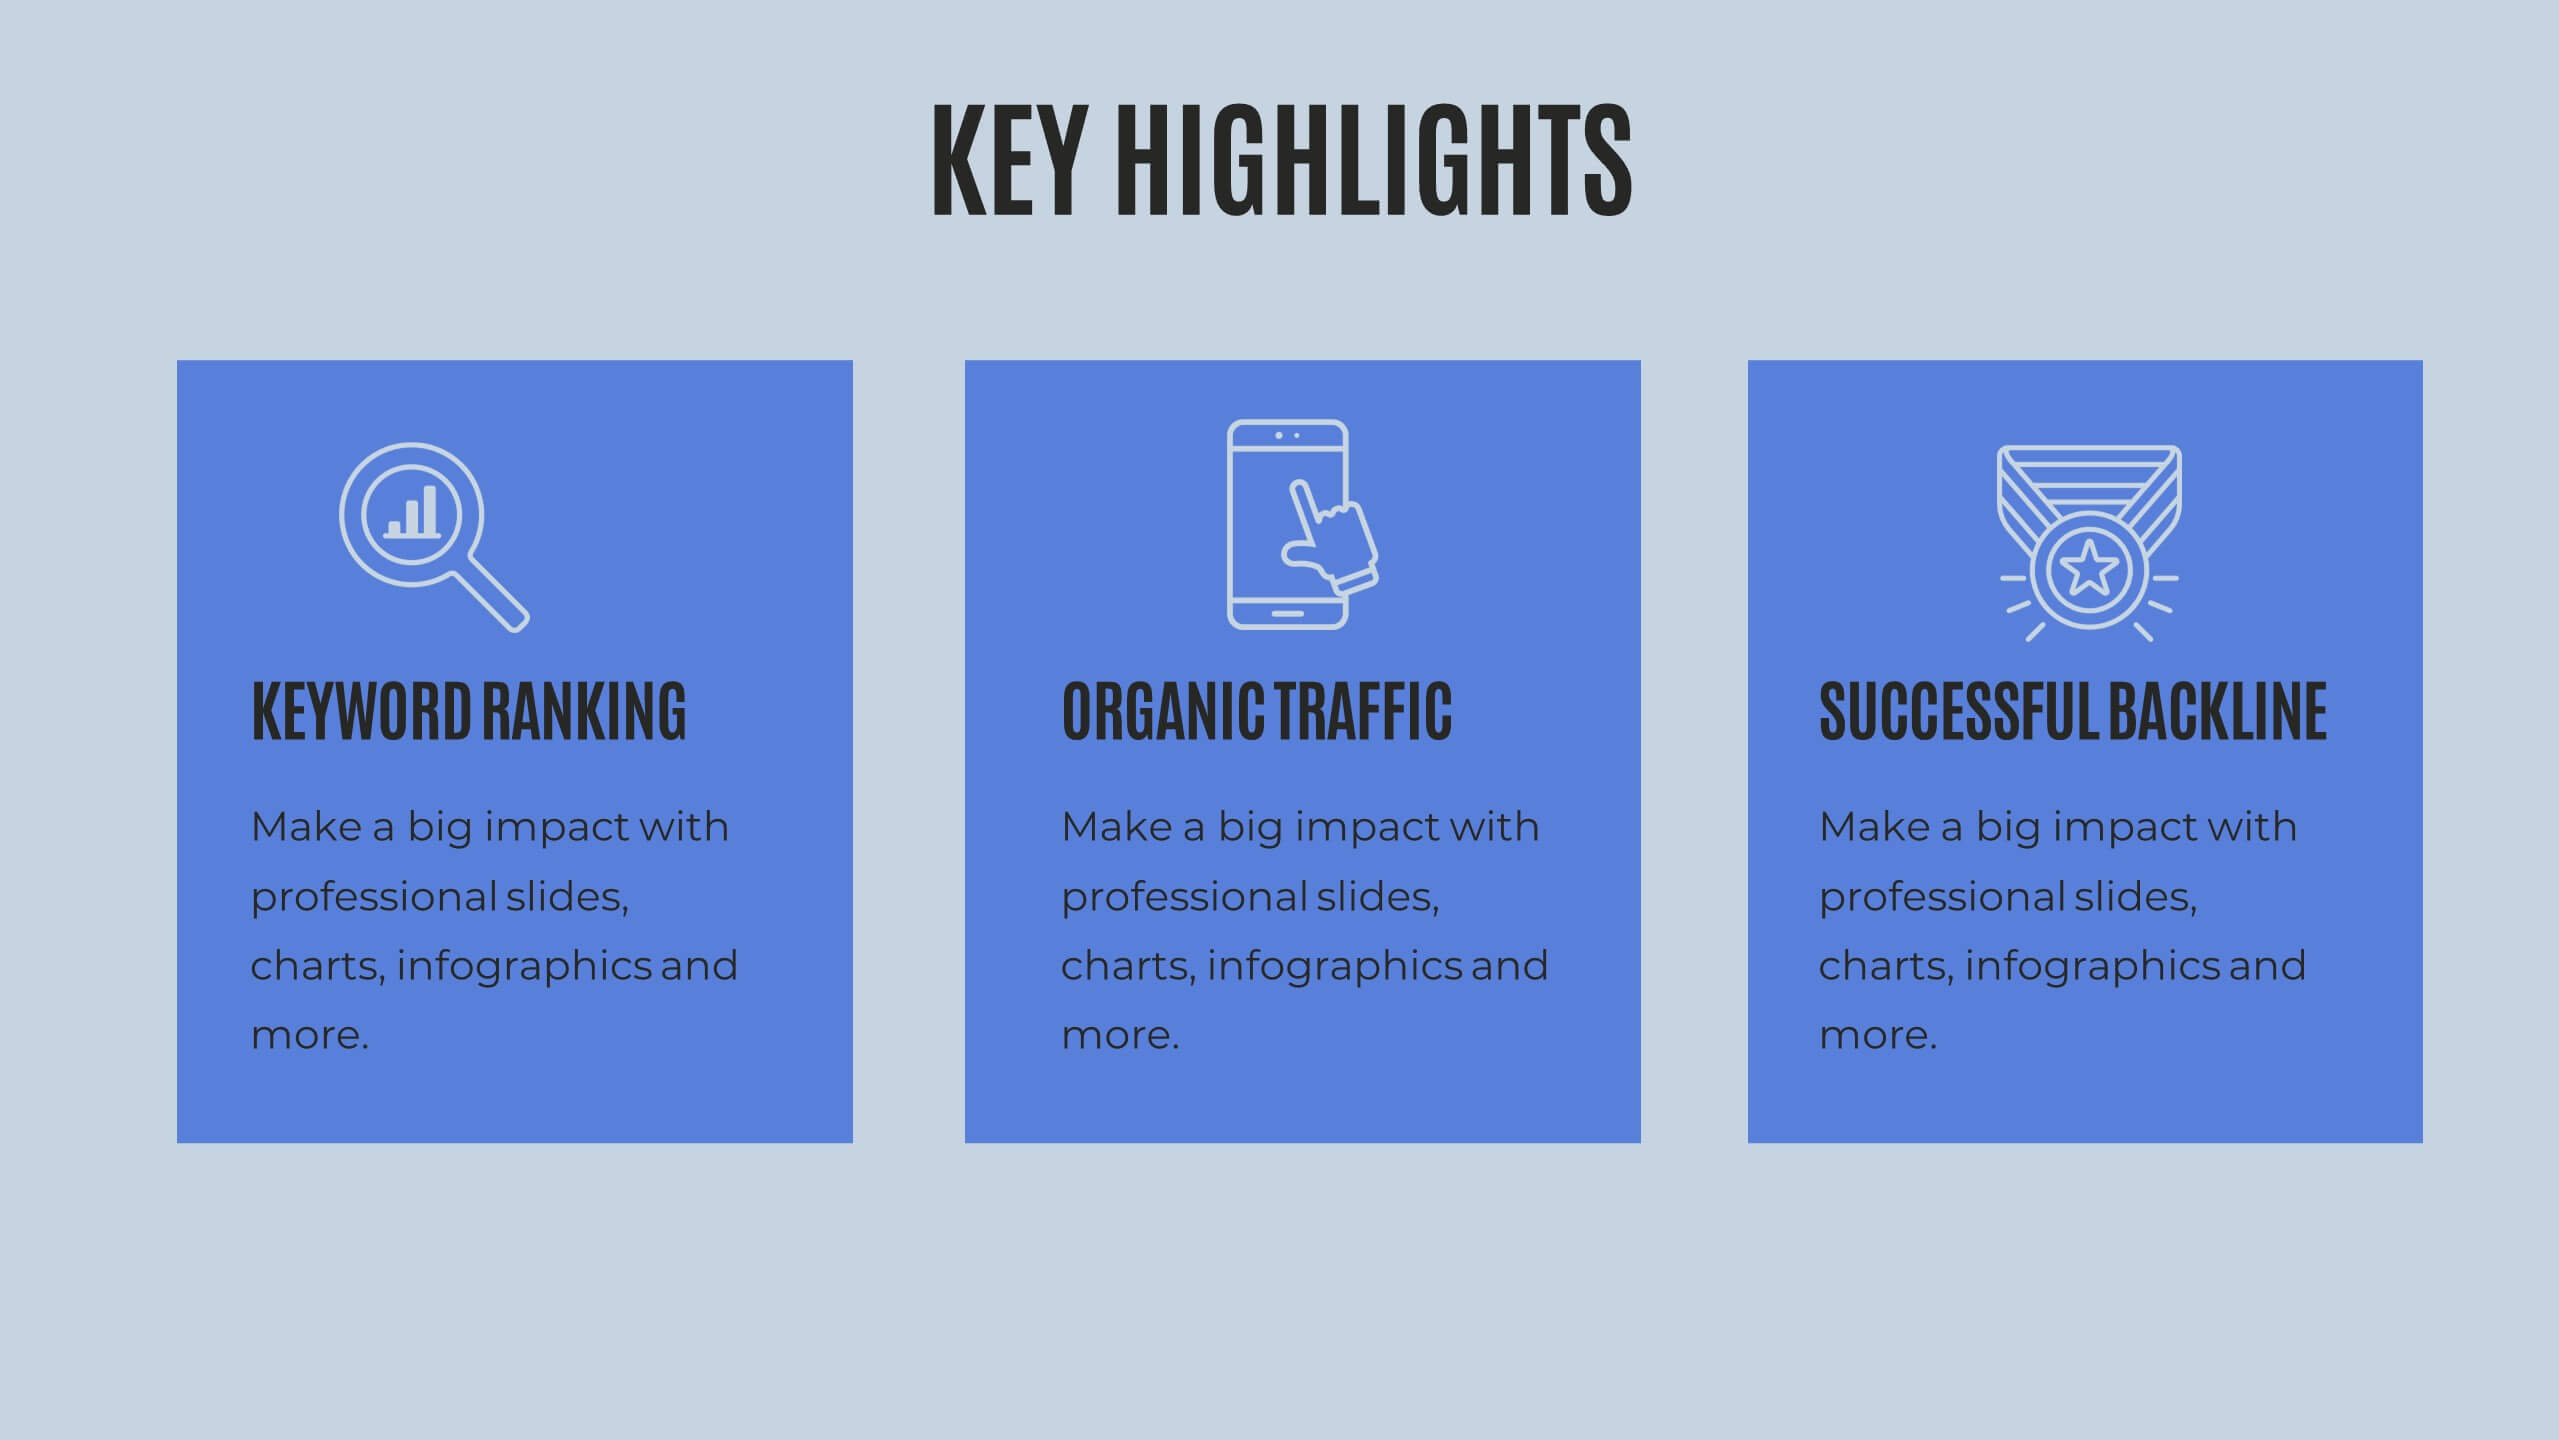
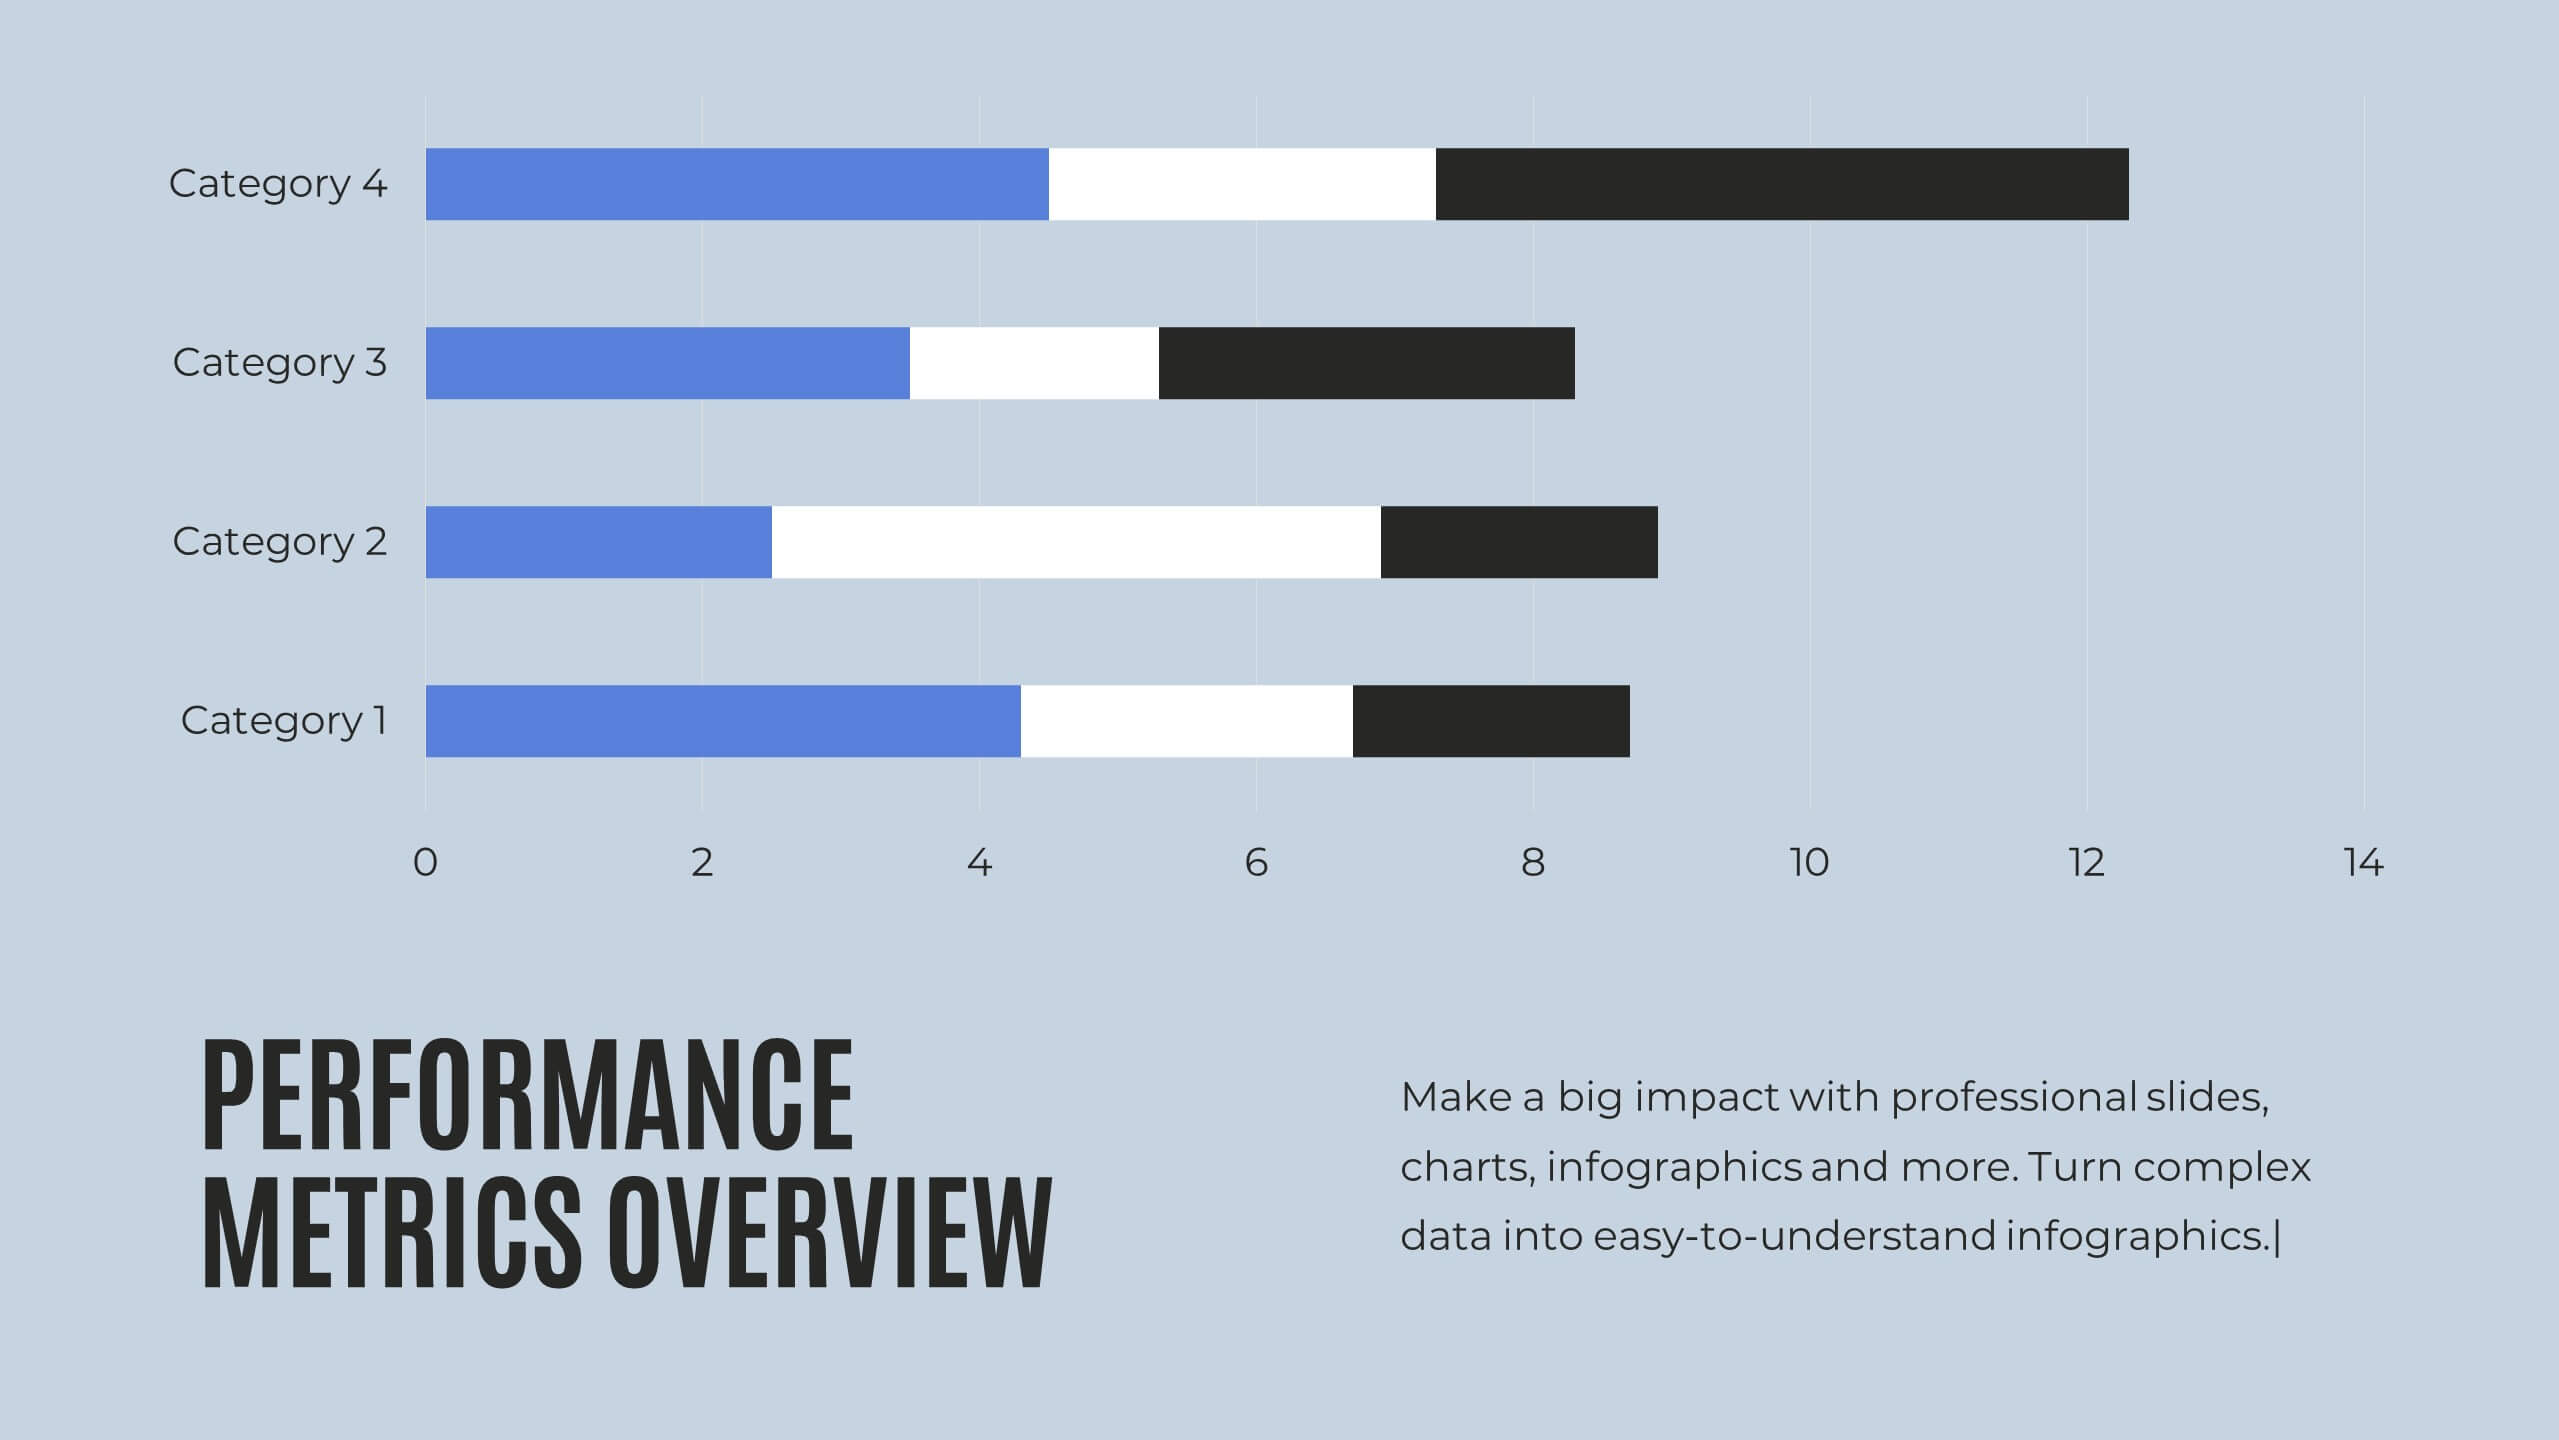
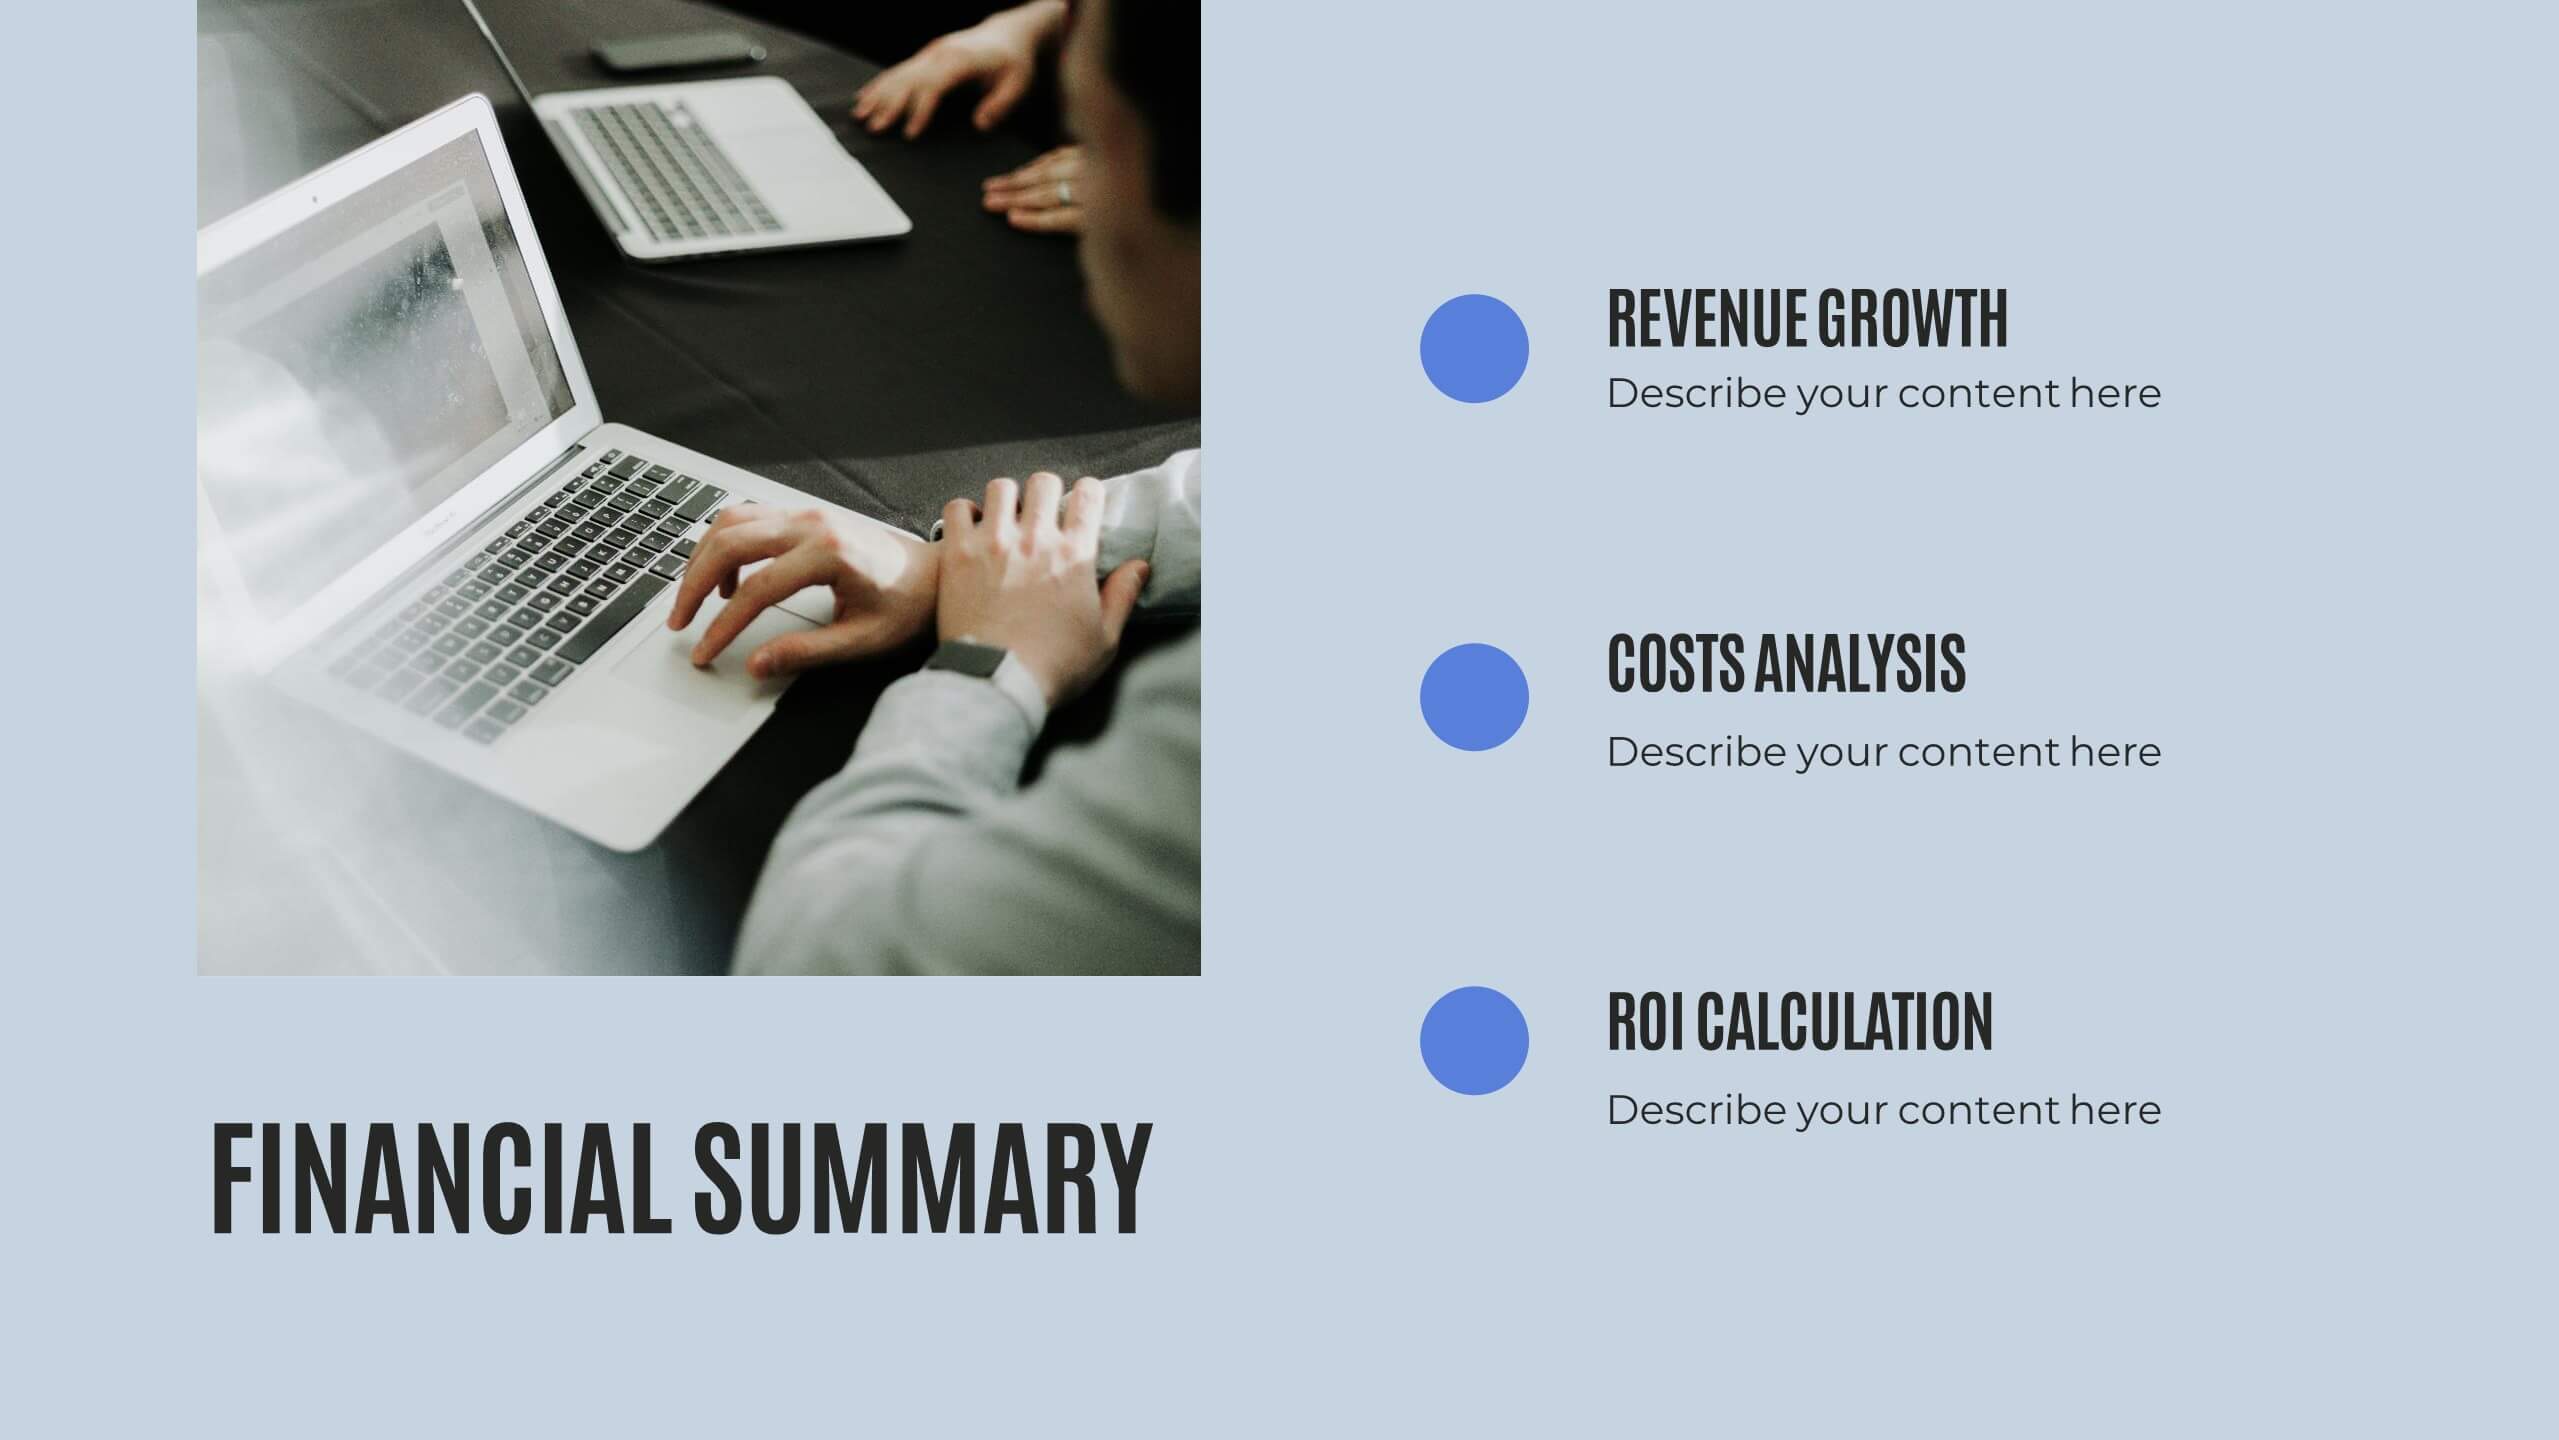
Quill Research Findings Report Presentation
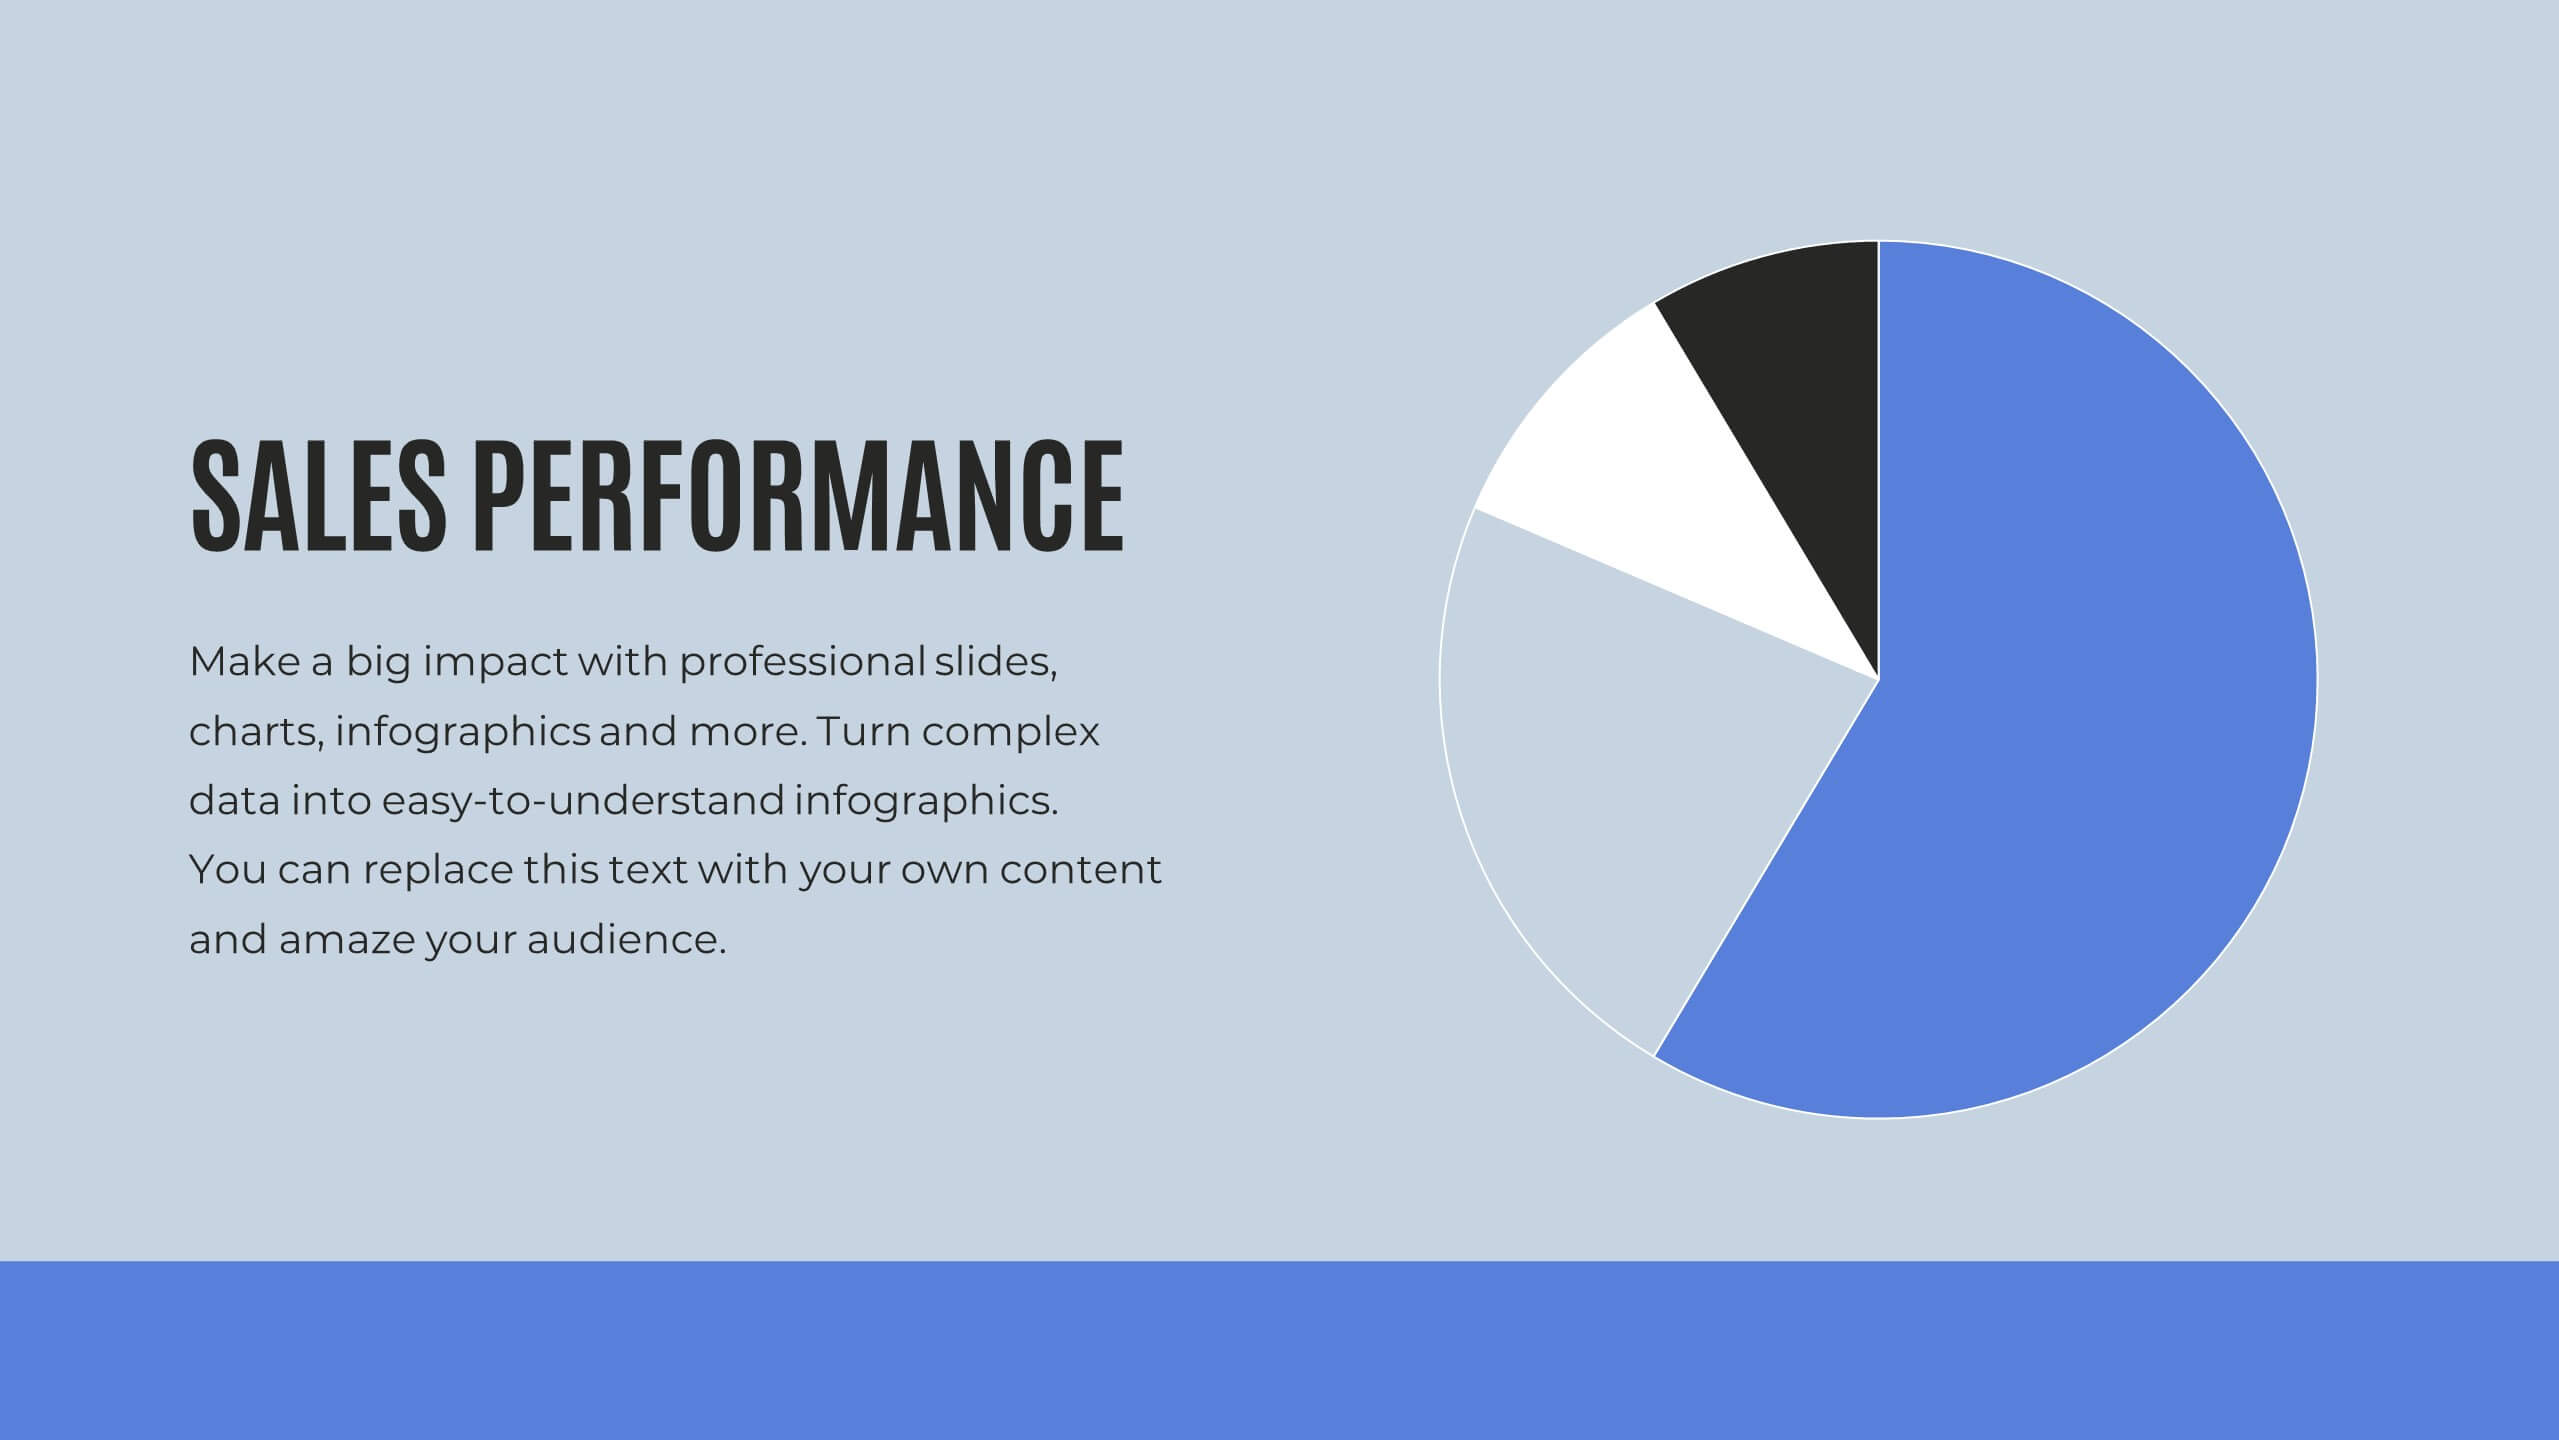
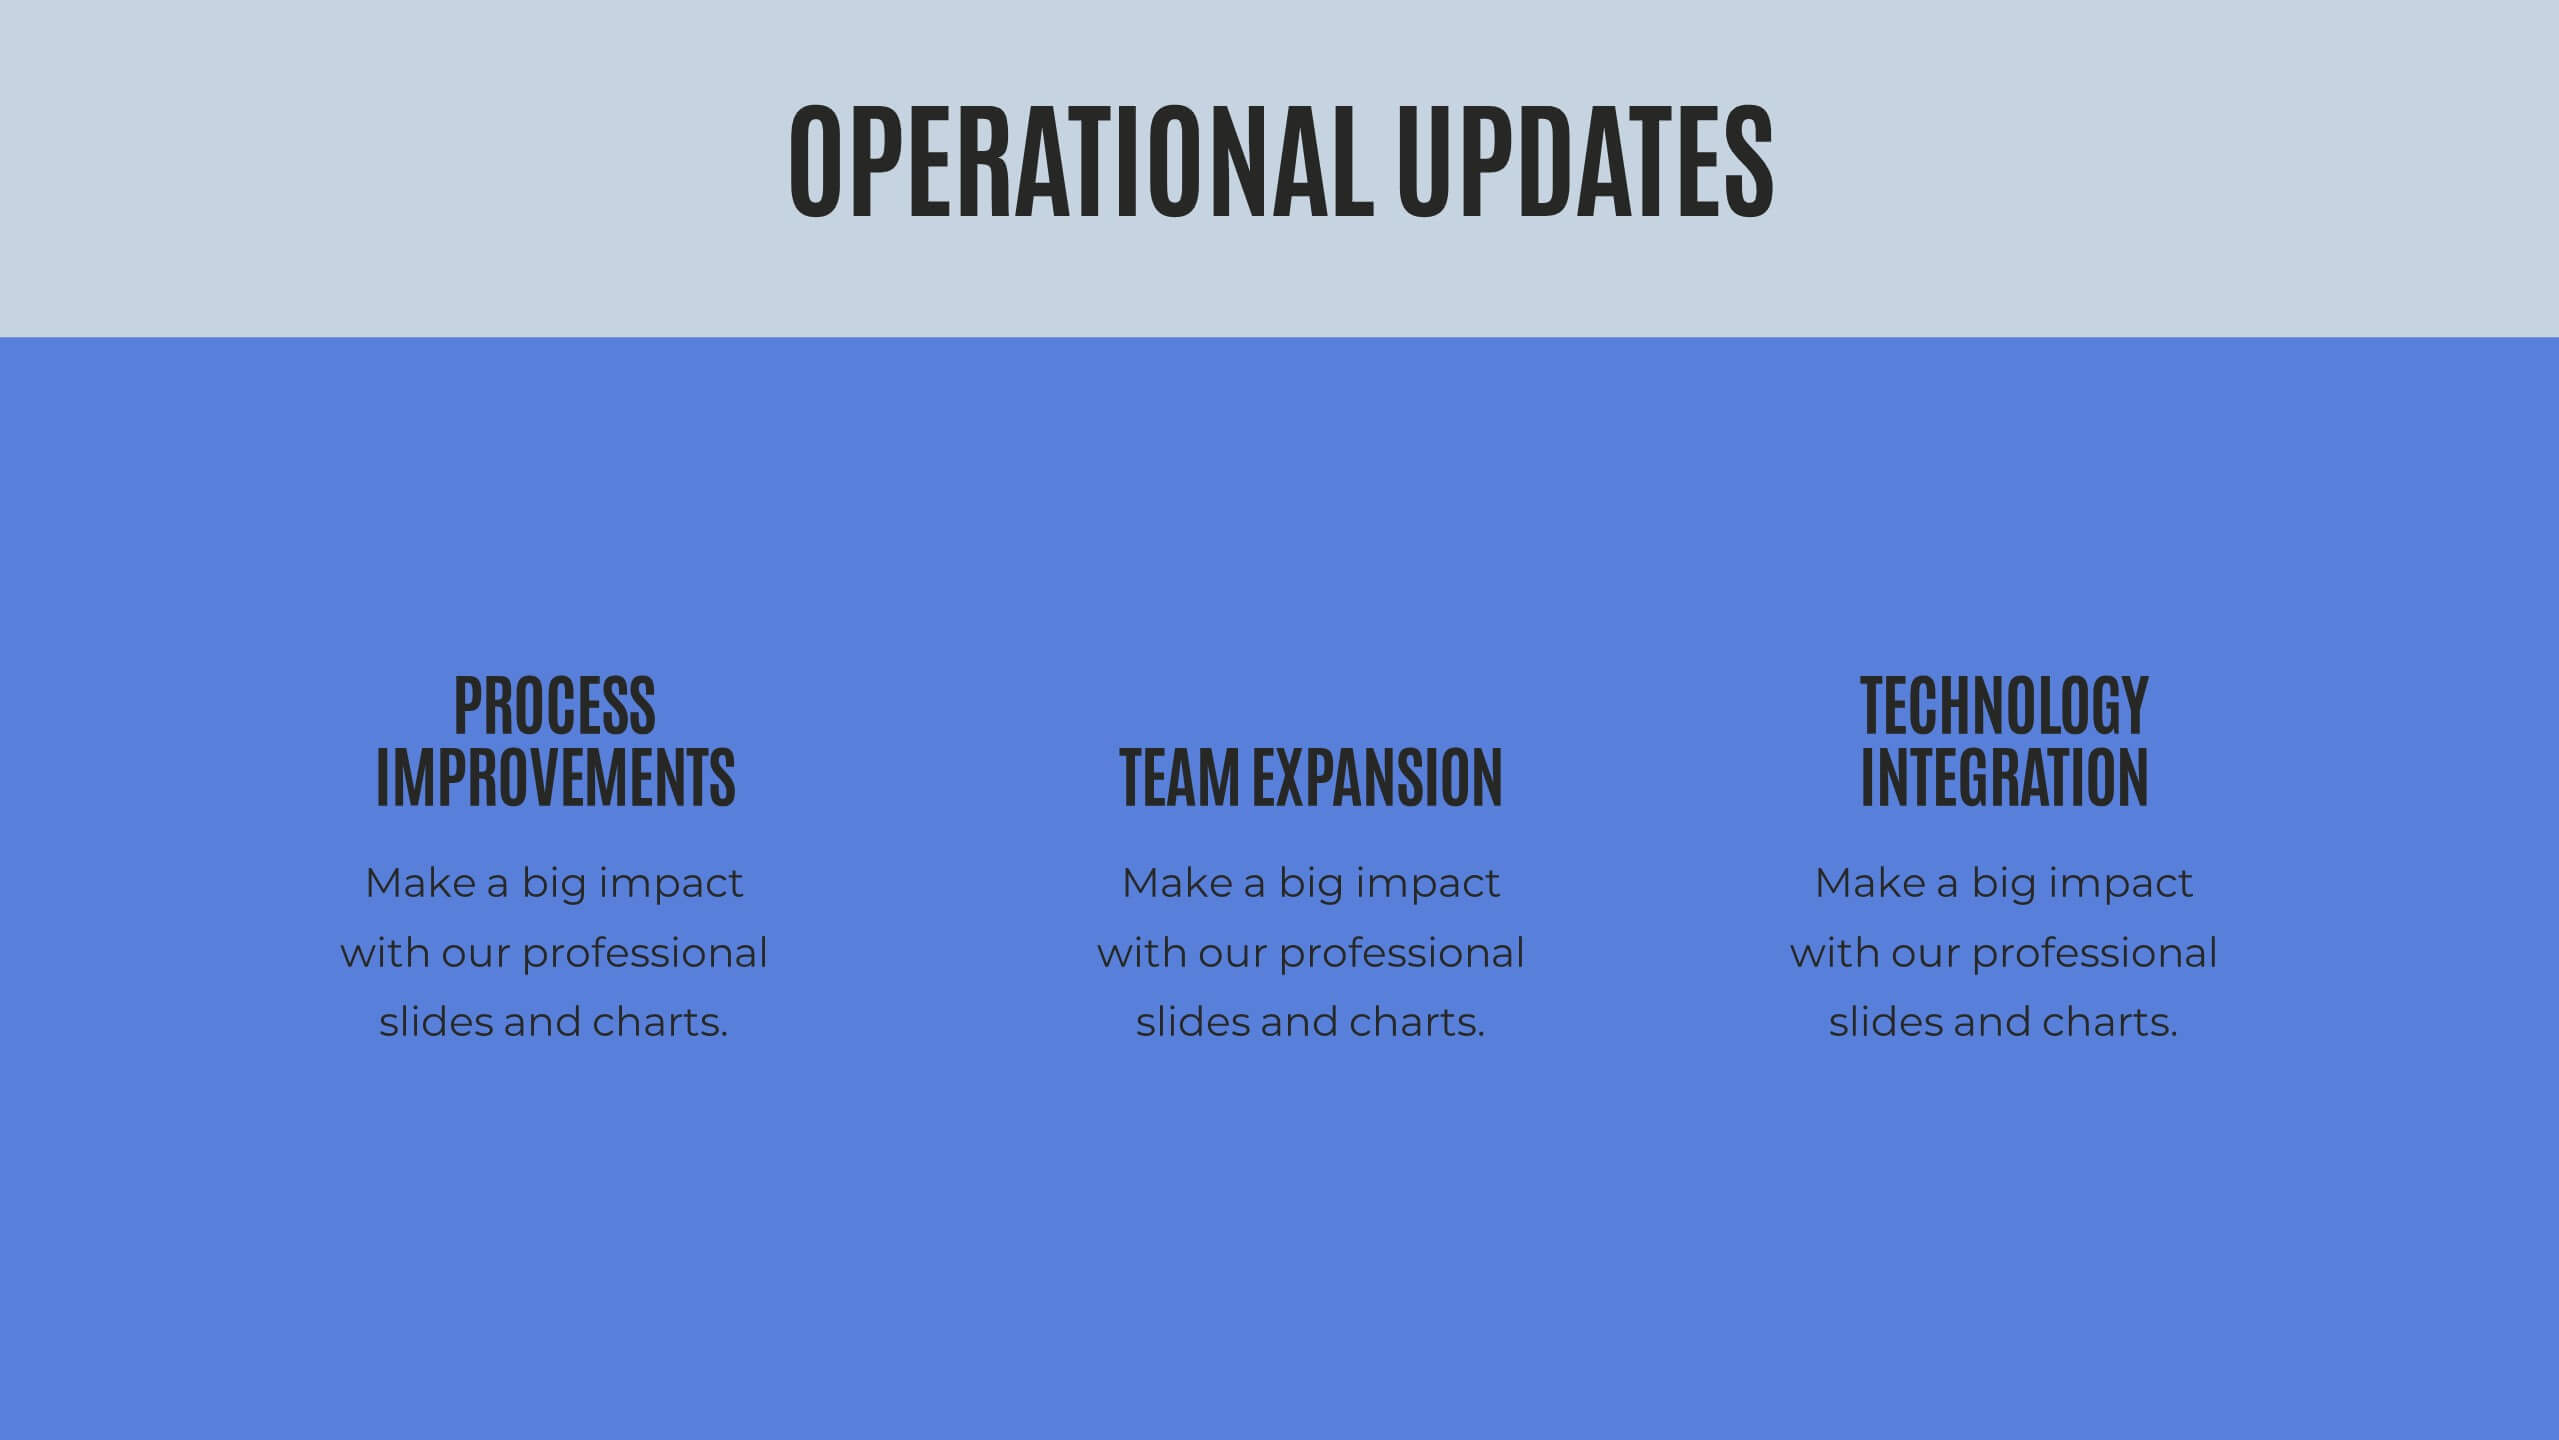
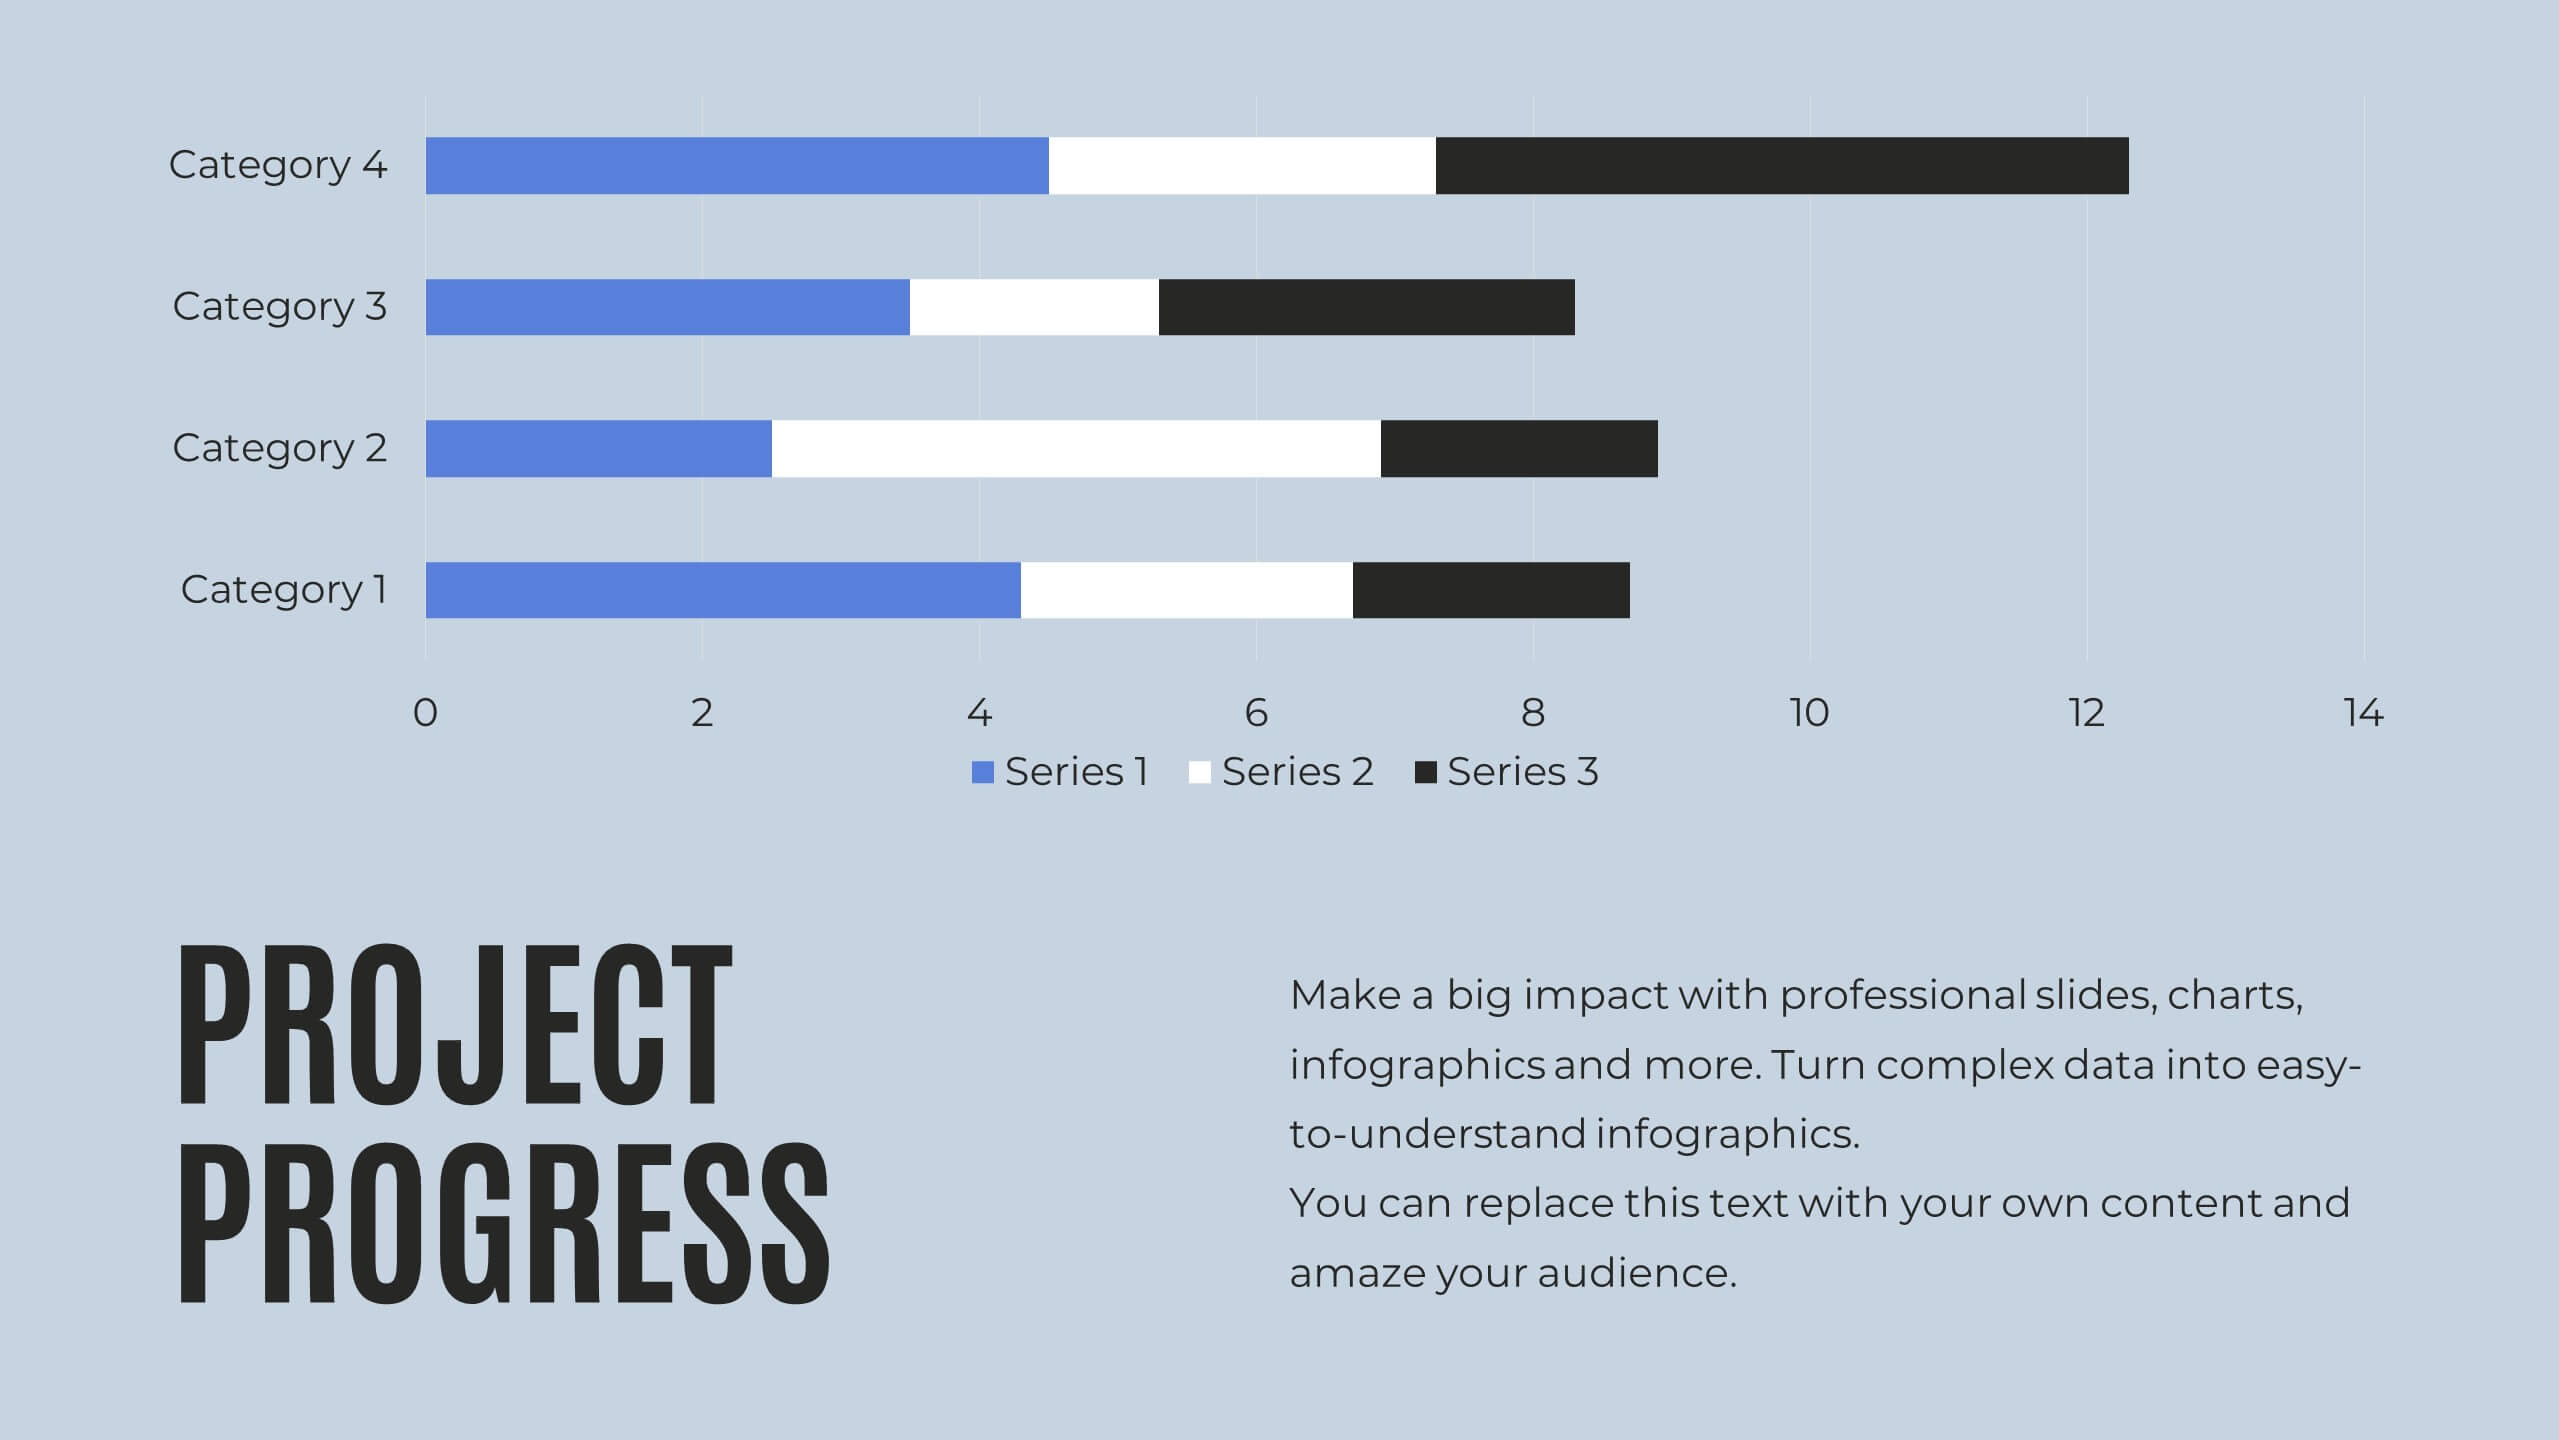
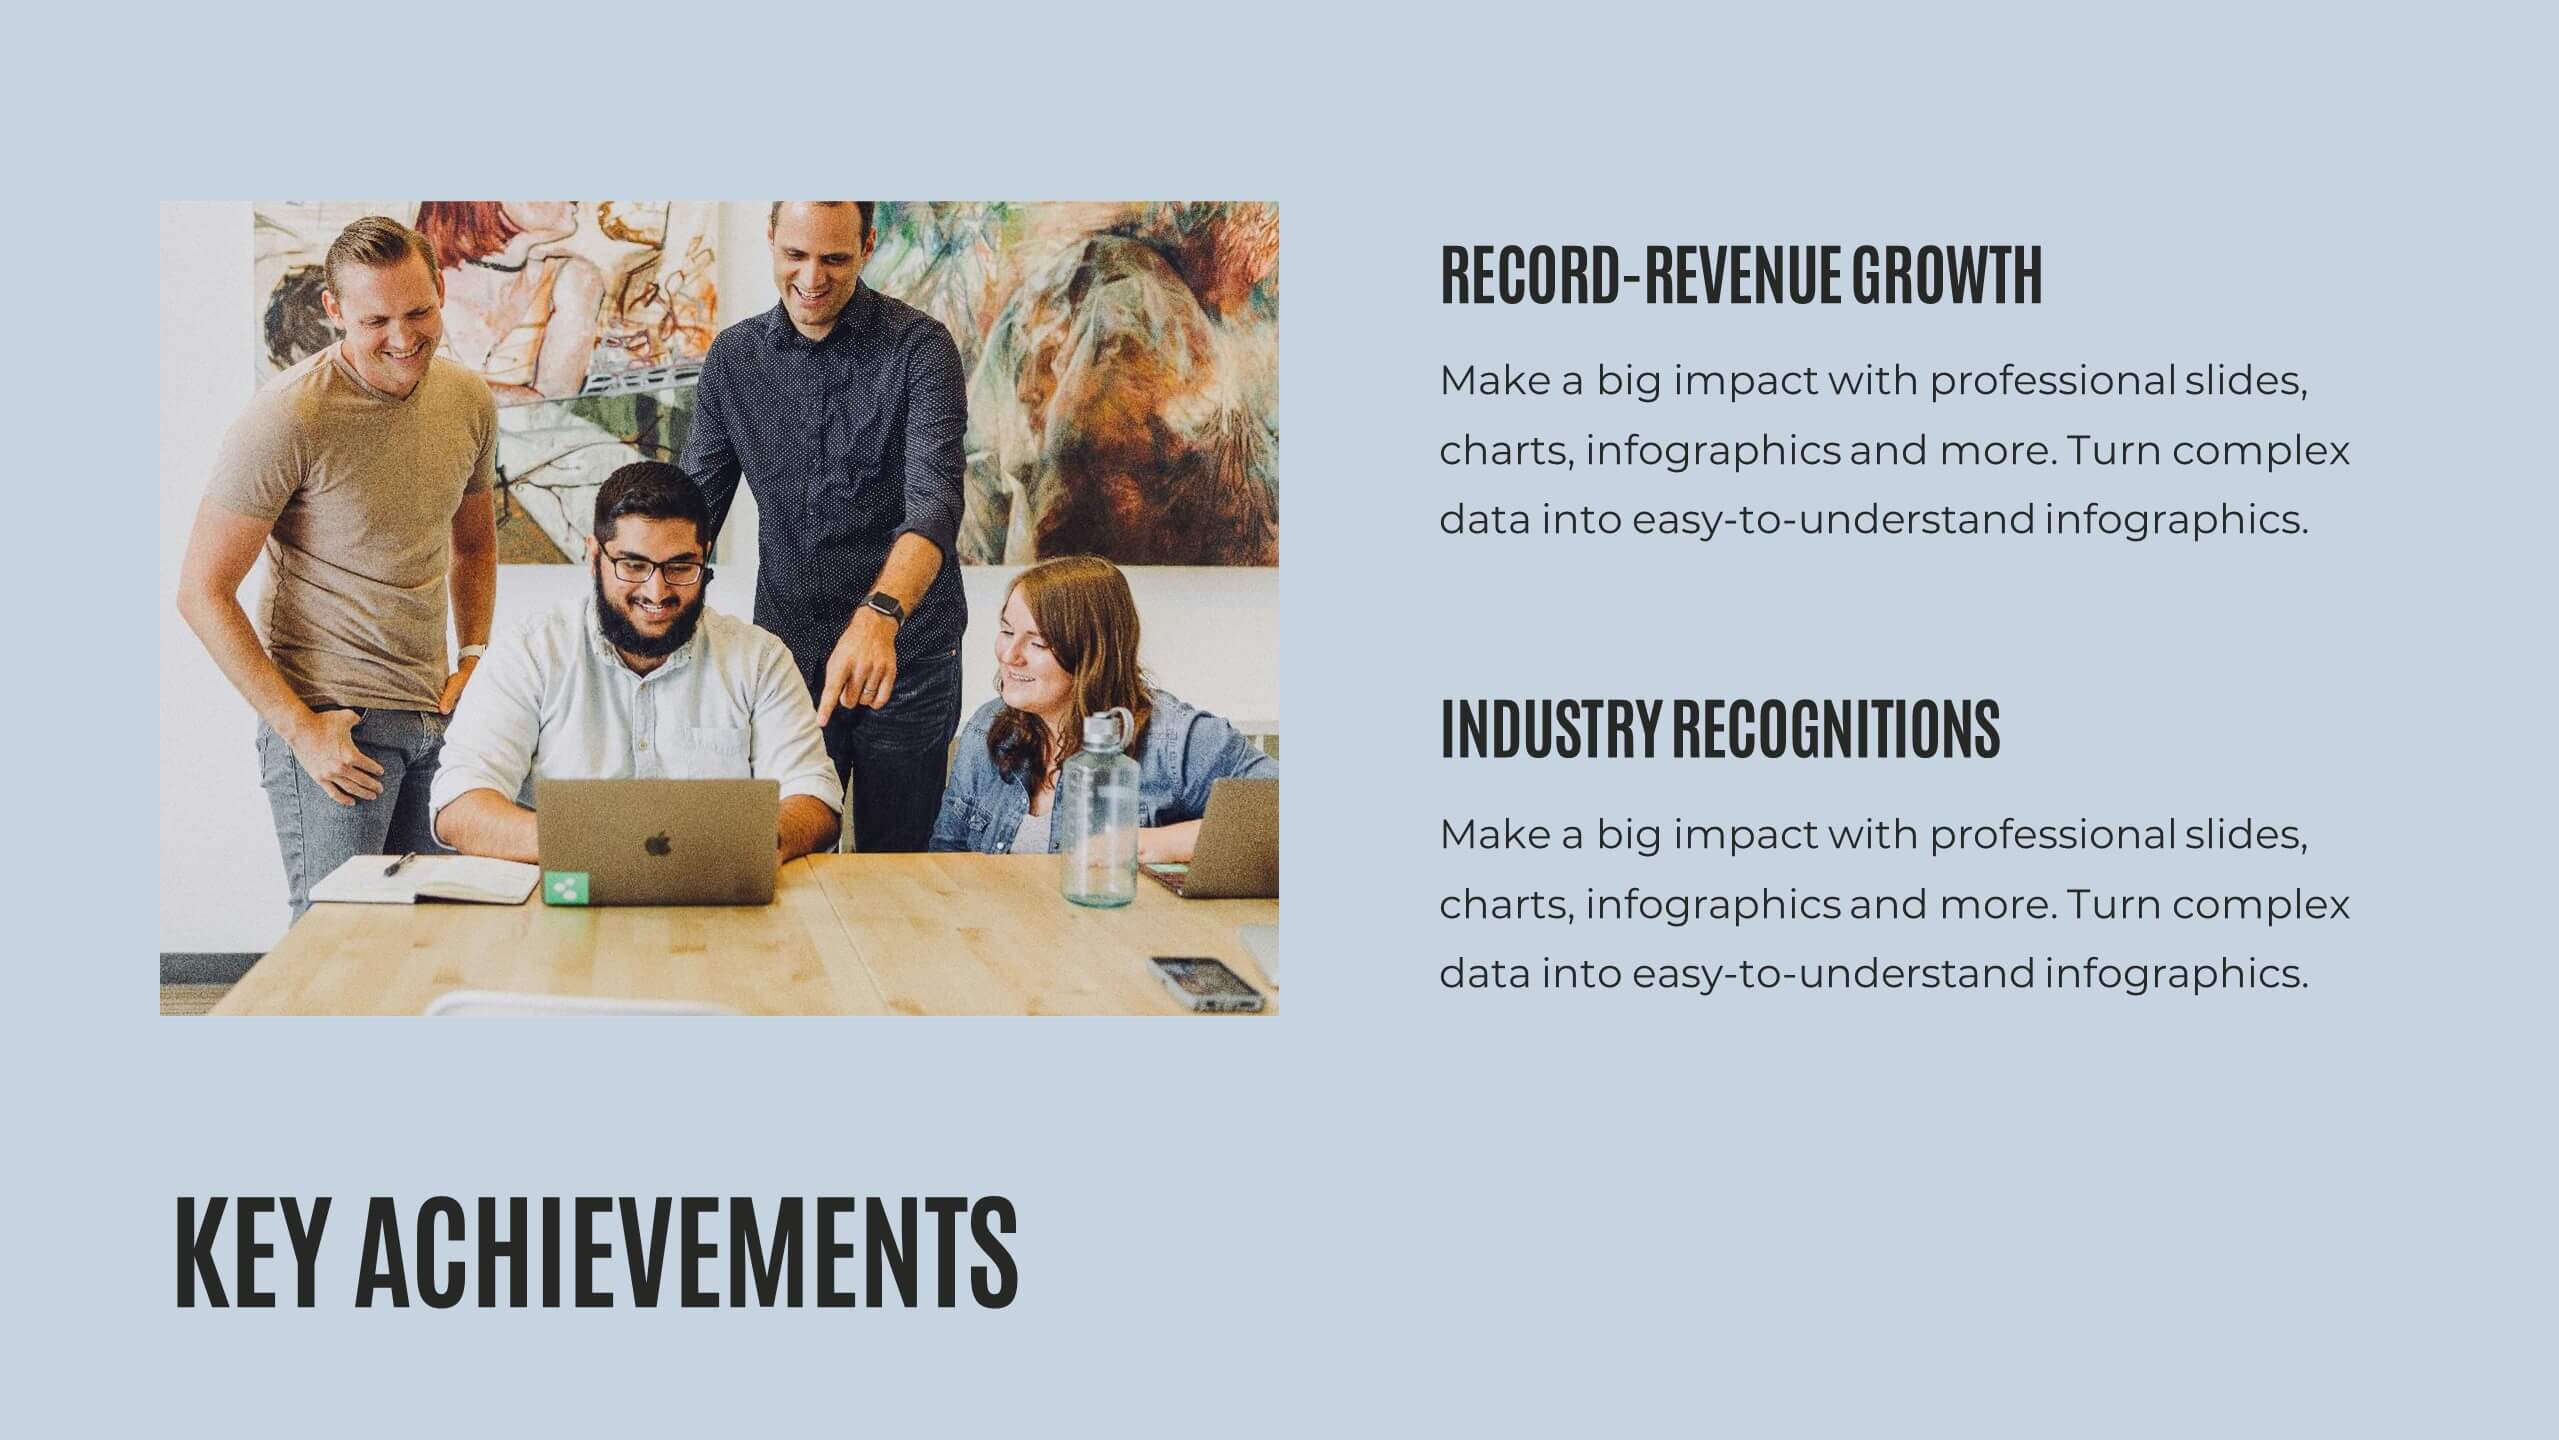
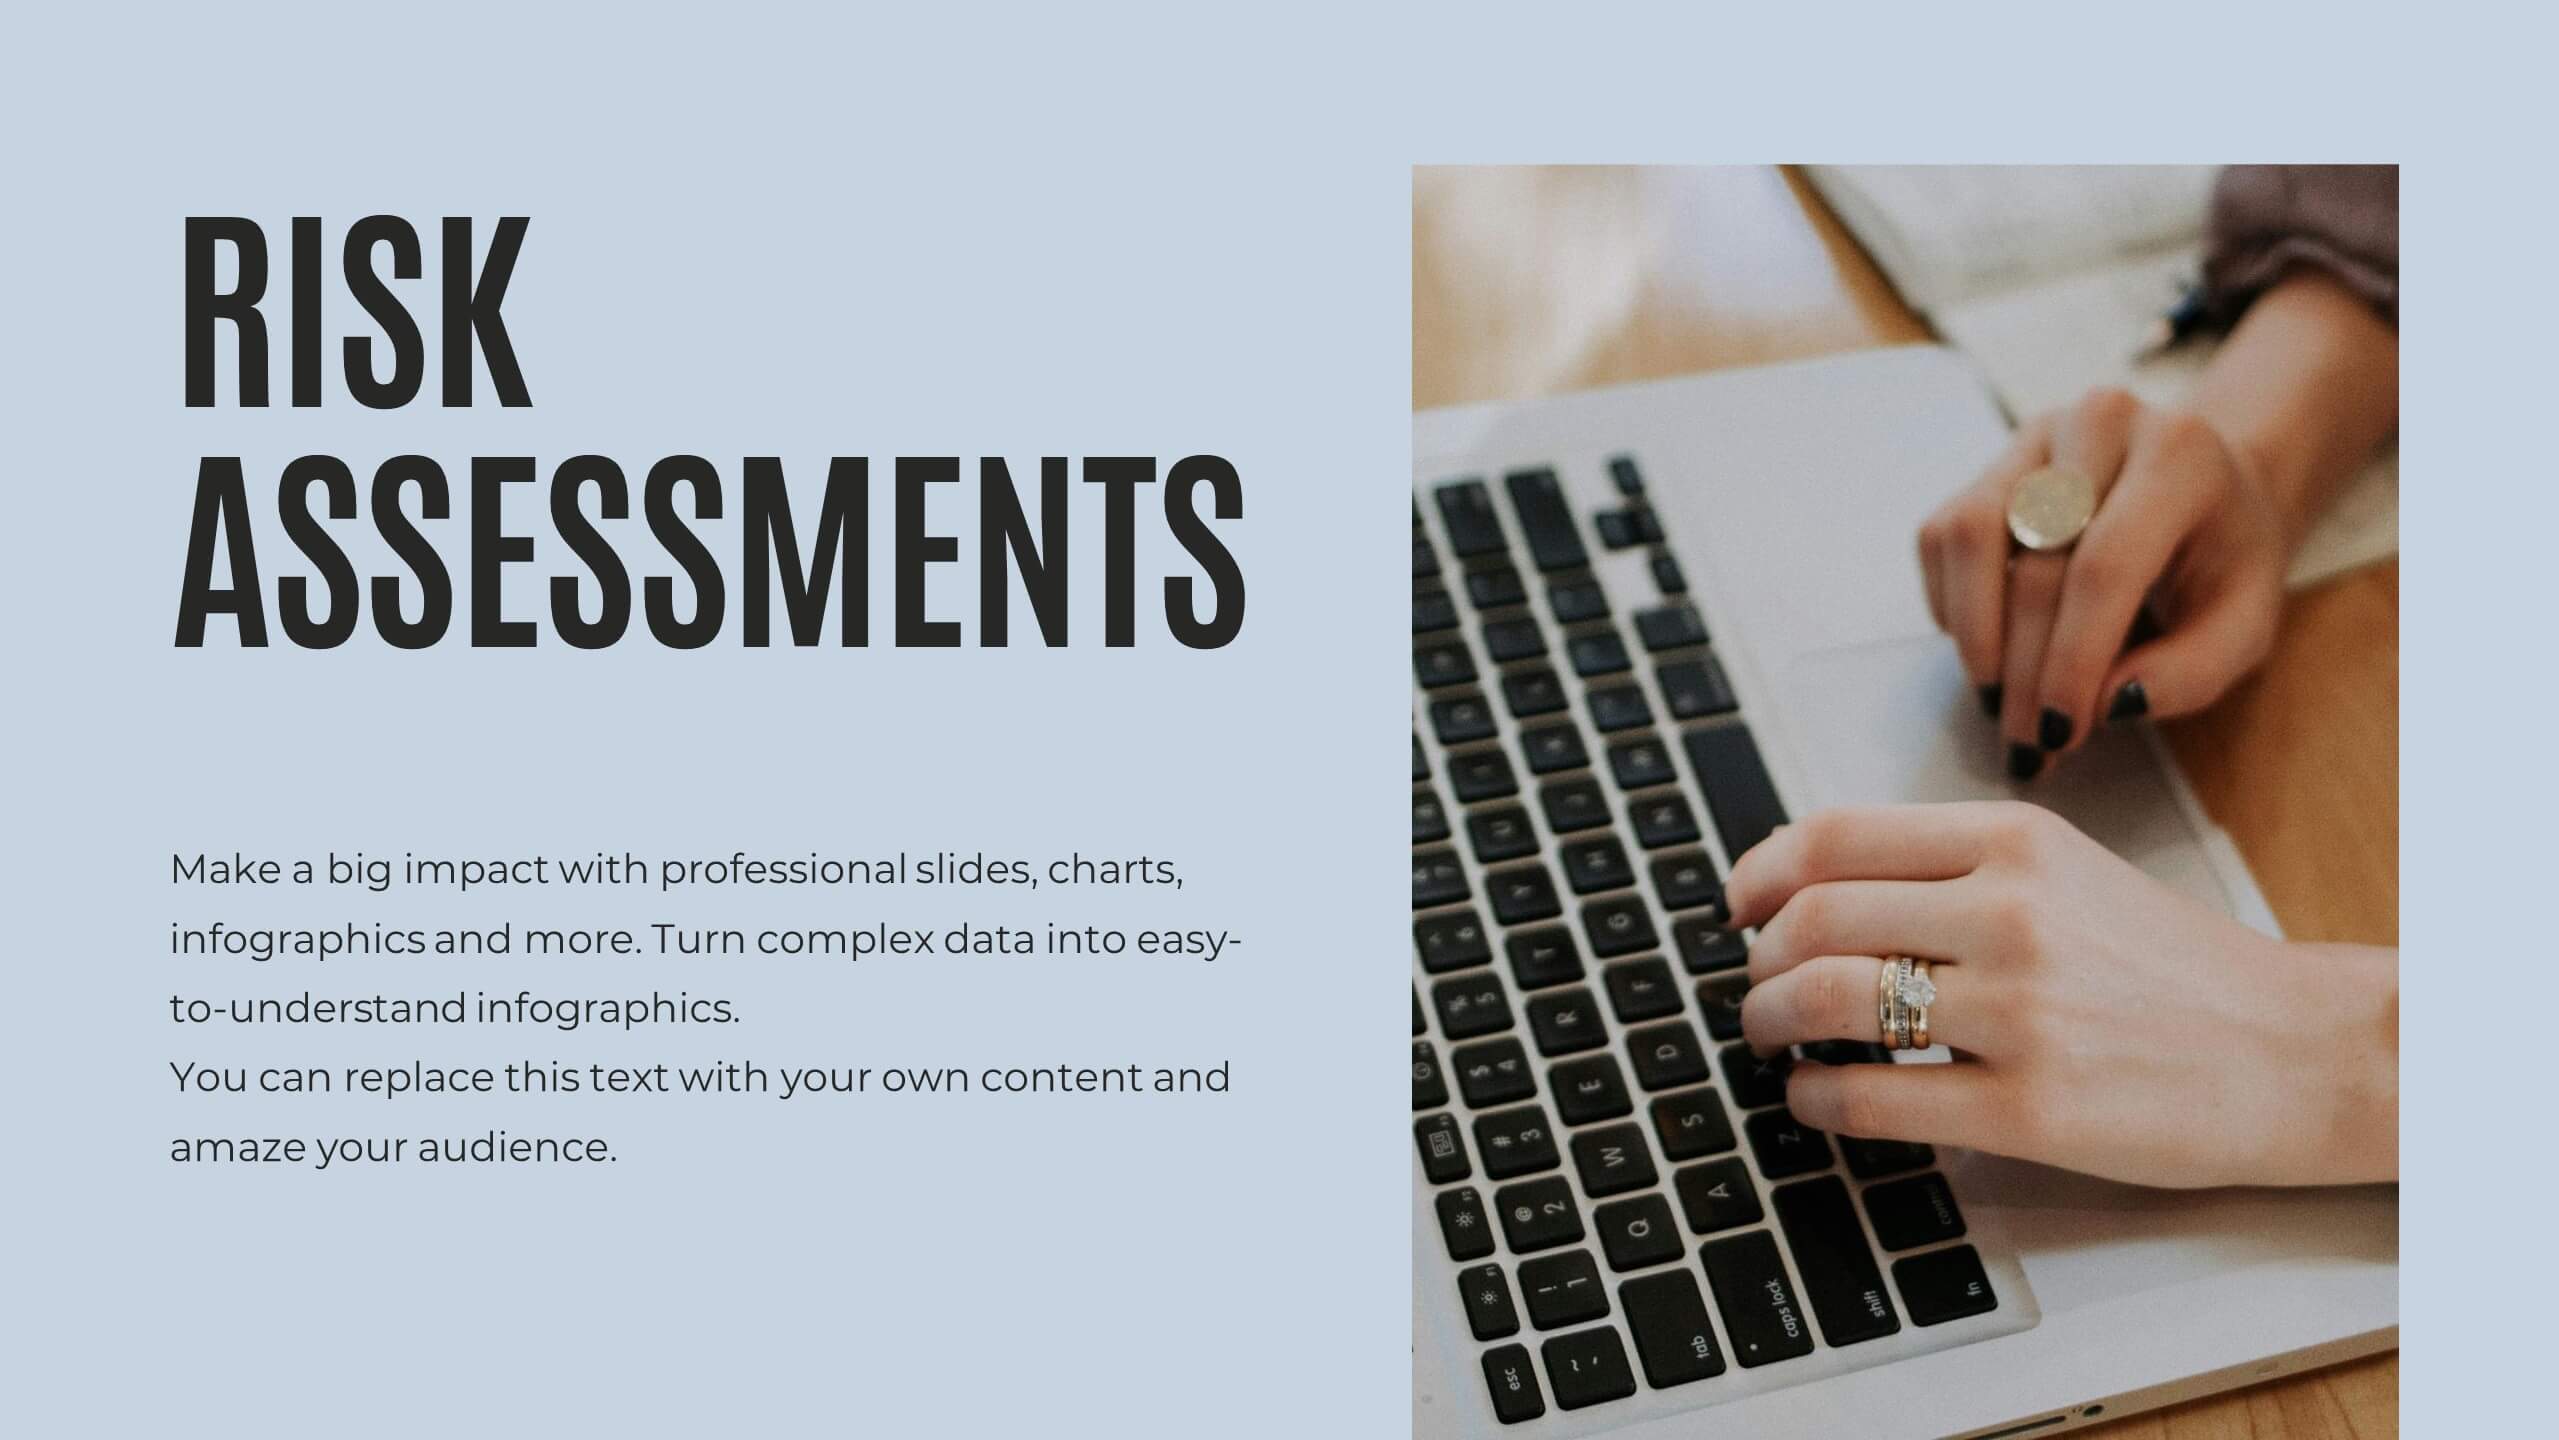
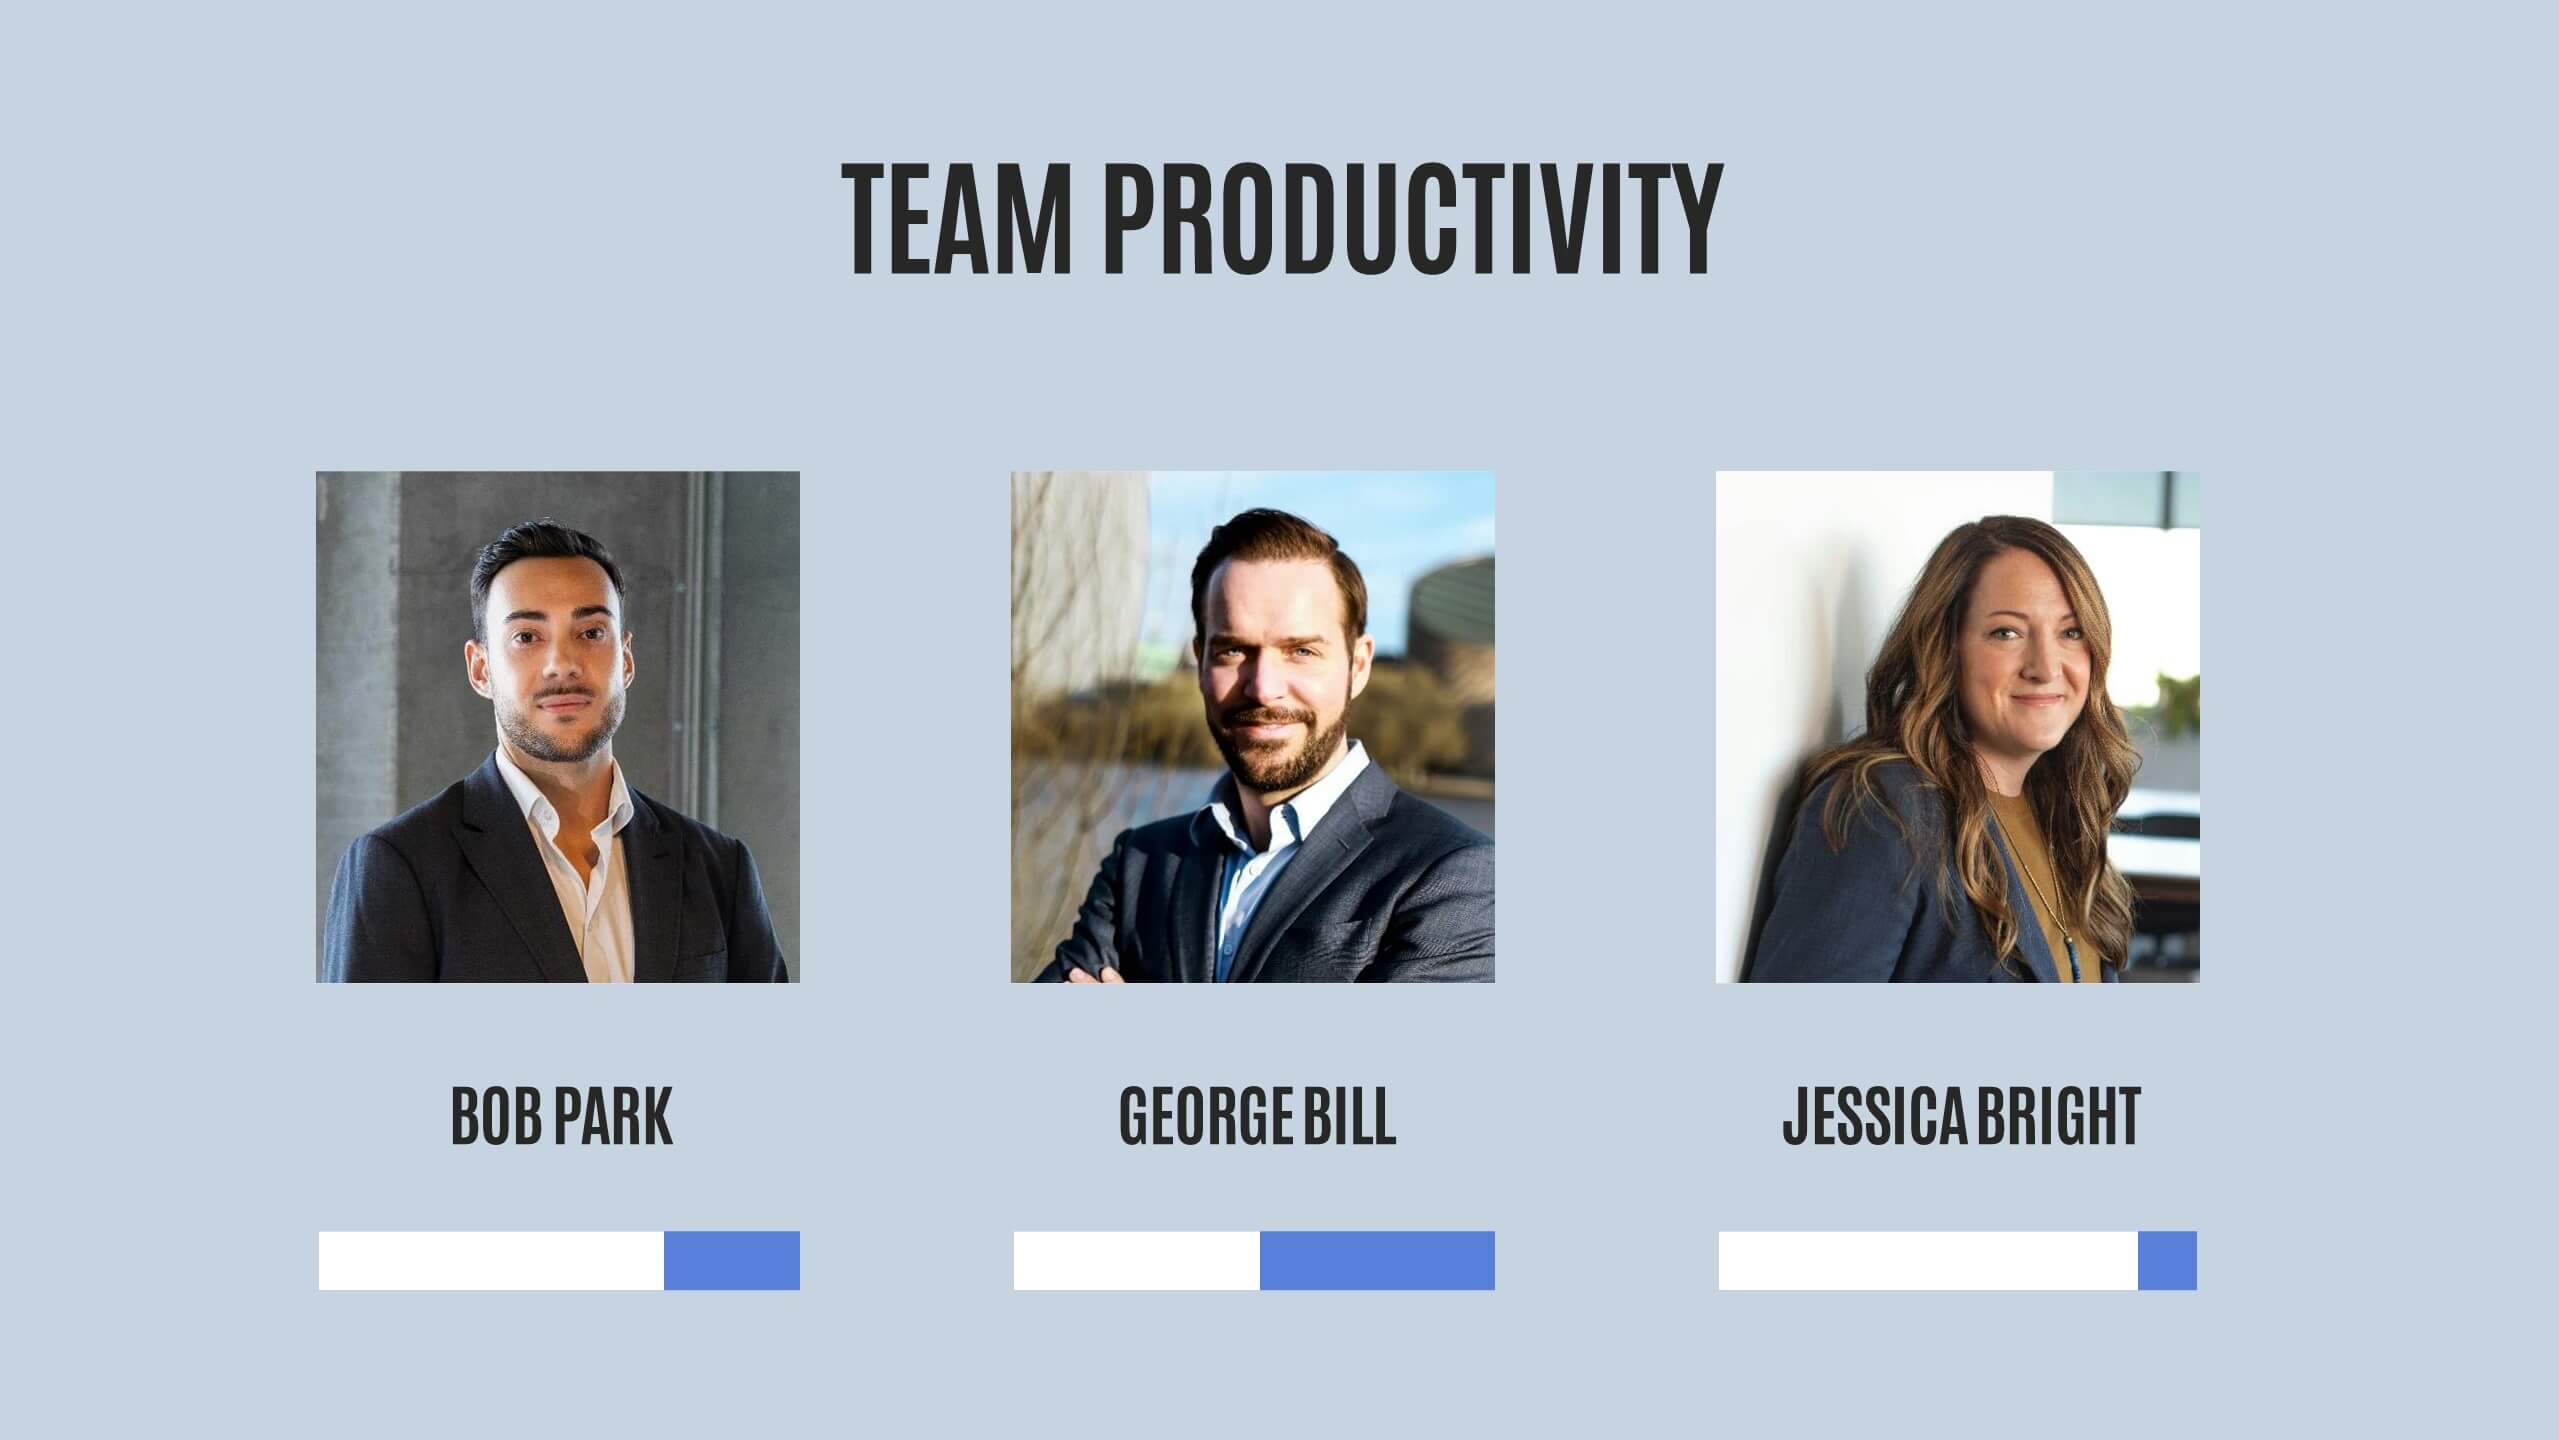
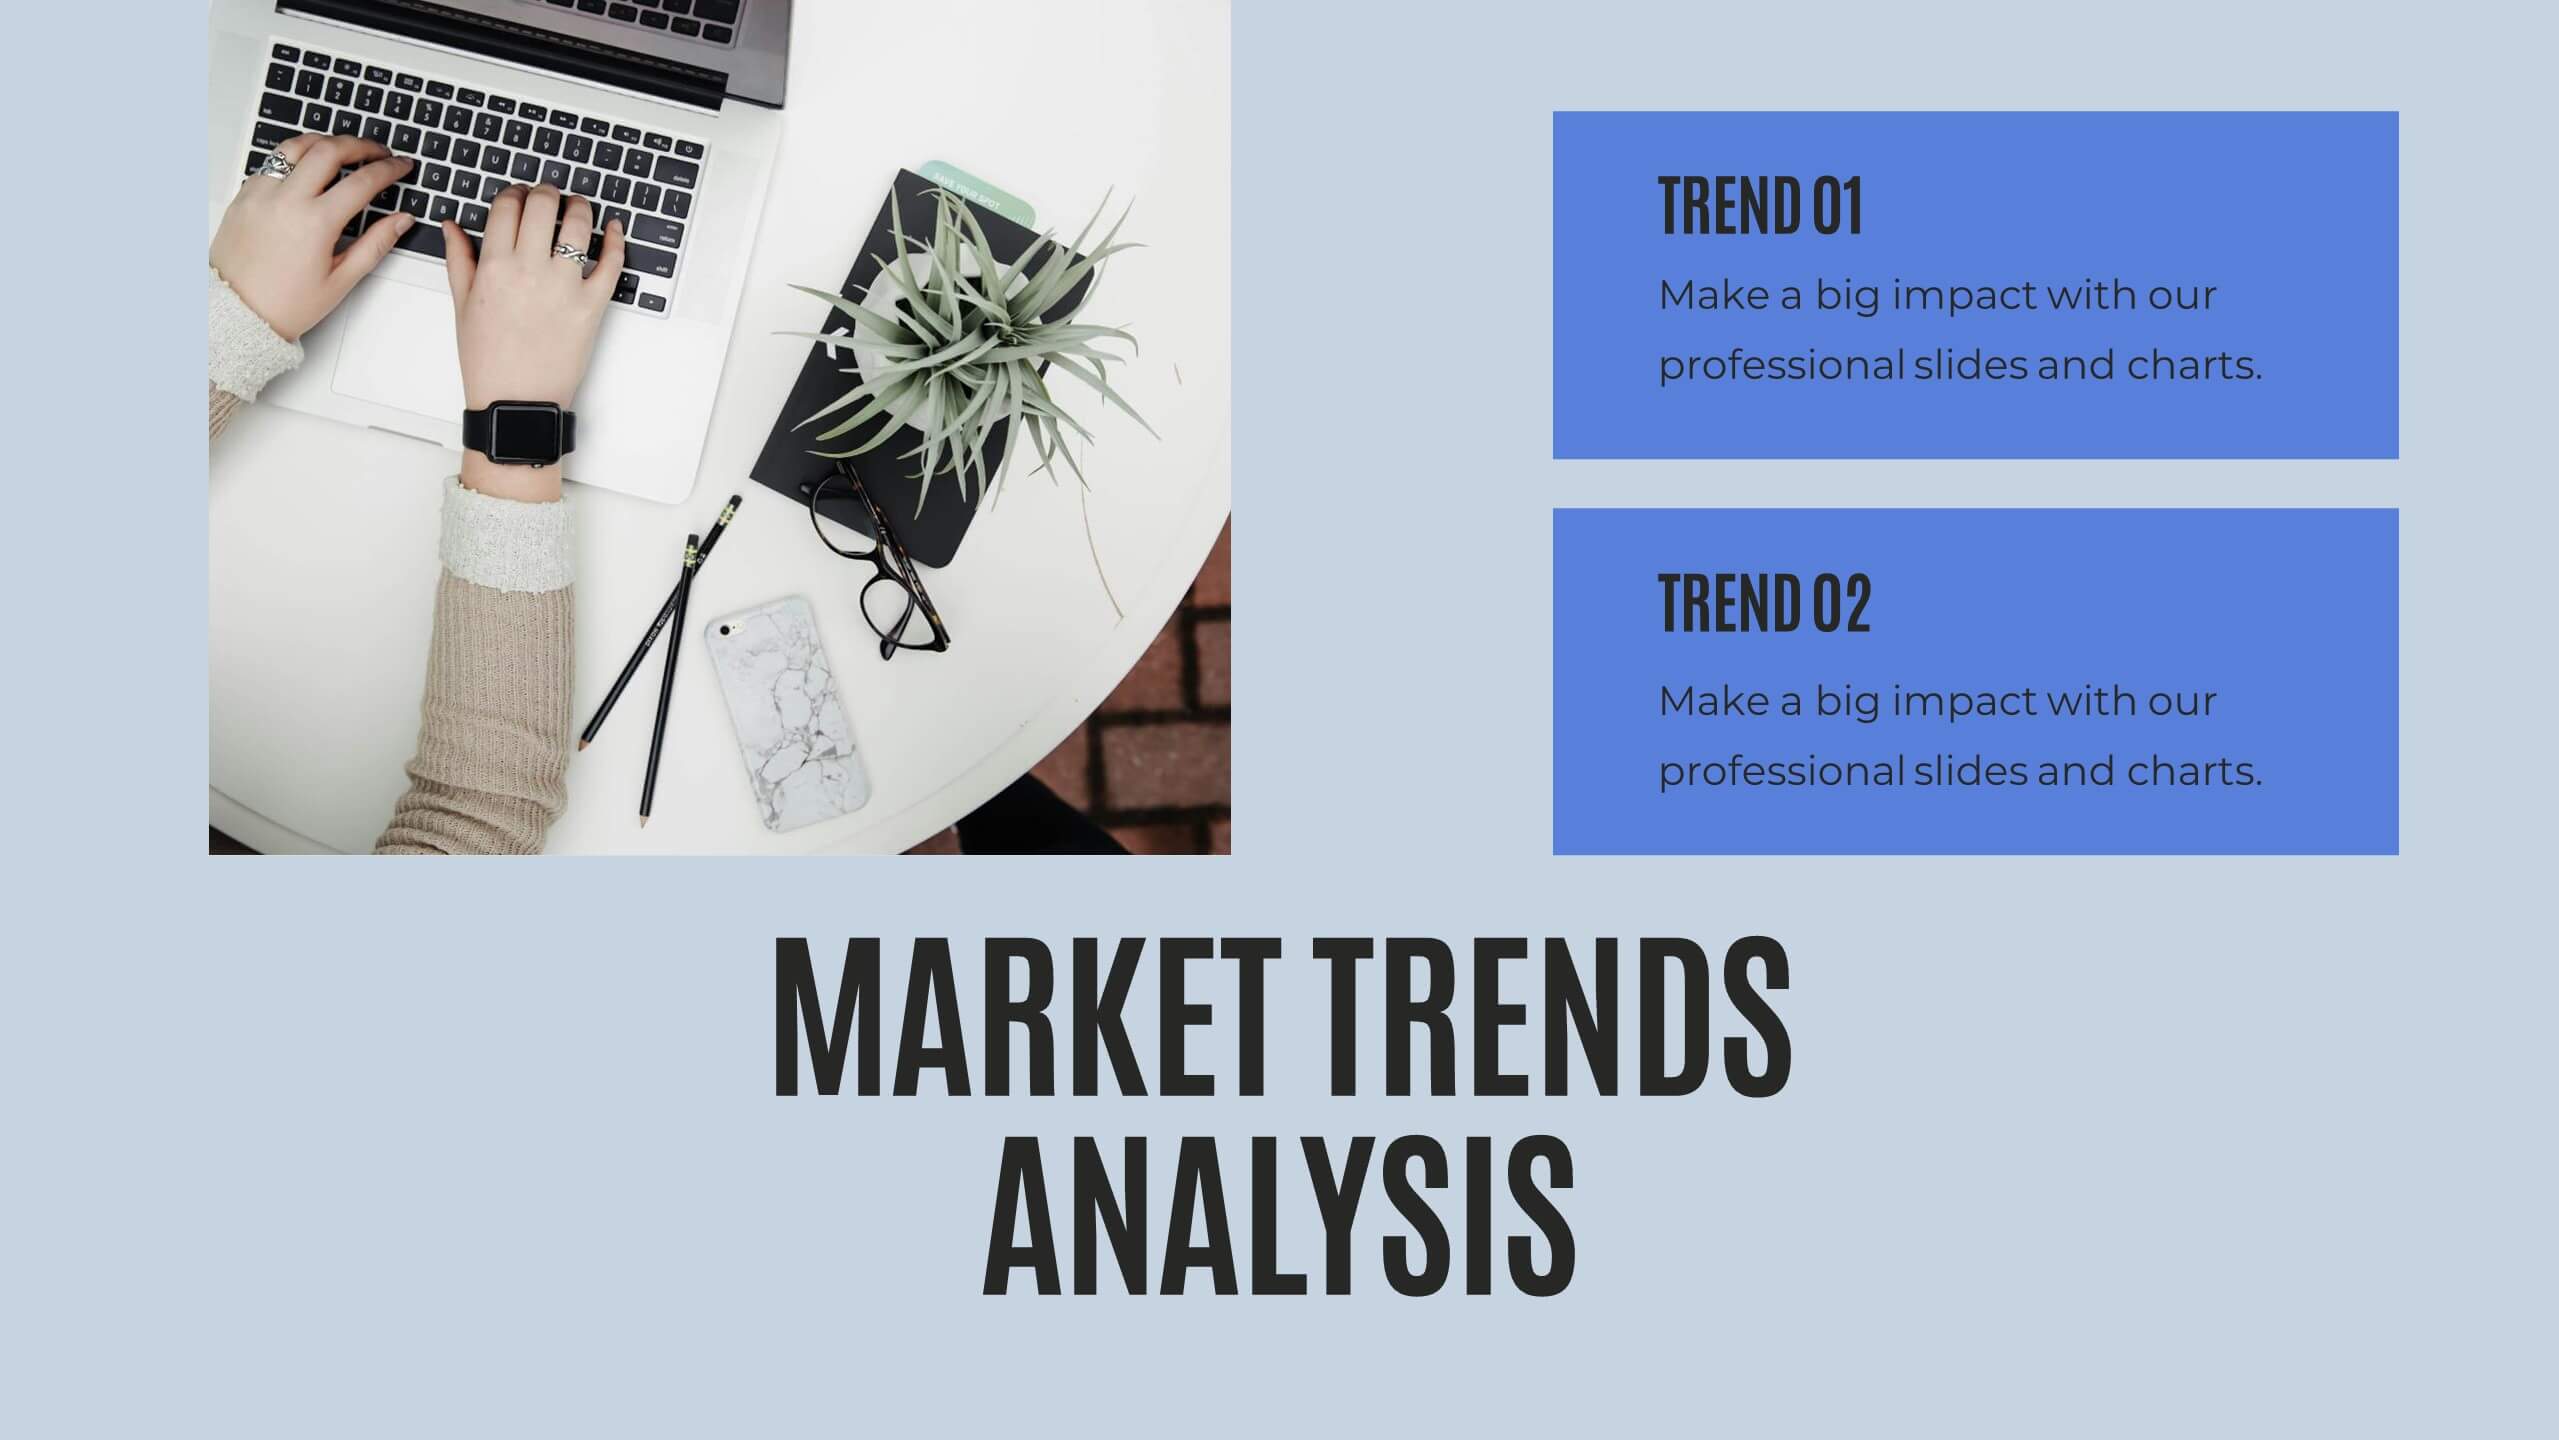
Illuminate your findings with this comprehensive research report template! Perfect for presenting key highlights, performance metrics, and financial summaries, it features professional slides for project progress, risk assessments, and market trends analysis. Engage your audience with clear visuals and detailed content. Compatible with PowerPoint, Keynote, and Google Slides for seamless presentations on any platform.


4 slides
Neuroscience-Inspired Concept Mapping Presentation
Visualize abstract ideas with clarity using the Neuroscience-Inspired Concept Mapping Presentation. Featuring a head silhouette and four labeled concept nodes, this layout is perfect for connecting ideas, frameworks, or steps in a thought process. Fully editable in PowerPoint, Canva, and Google Slides for seamless customization and presentation.


8 slides
Startups Pitch Deck Presentation
Bring your idea to life with a bold, energetic layout designed to showcase vision, traction, and future potential. This presentation helps you communicate your business model, strategy, and key insights with clarity and confidence. Clean visuals and structured sections keep your message strong and compelling. Fully compatible with PowerPoint, Keynote, and Google Slides.


7 slides
TAM SAM SOM Research Infographic
TAM, SAM, and SOM are acronyms often used in business and marketing to analyze and understand the potential market for a product or service. This infographic template acts as a compass, guiding you through the seas of Total Available Market (TAM), Served Available Market (SAM), and Share of Market (SOM). Compatible with Powerpoint, Keynote, and Google Slides. This showcases creative visualization methods to represent TAM, SAM, and SOM effectively, ensuring clarity and engagement. Use this template to discuss how insights from TAM SAM SOM analysis can shape business strategies, drive growth, and enhance competitiveness.


5 slides
Manufacturing Insights Infographics
Manufacturing insights refer to valuable information, analysis, and observations derived from the manufacturing industry. These vertical set of infographics are designed to provide valuable insights and data related to the manufacturing industry. This template is ideal for manufacturing companies and researchers looking to present complex data in an engaging manner. The template includes infographics that break down the manufacturing process into easily understandable steps, using simple graphics and icons. This template is easily editable, allowing users to adjust colors, charts, and data to match their specific manufacturing insights.


7 slides
IT Architecture Solution Infographic
Enhance your presentations with our IT Architecture Solution infographic, tailored for optimal clarity in Powerpoint, Keynote, and Google Slides. This infographic offers a comprehensive visual tool to simplify complex IT structures, ideal for professionals aiming to articulate intricate systems with ease. Its design facilitates a clear understanding of hierarchical IT frameworks, making it perfect for educational environments, business meetings, and tech conferences. Our IT Architecture Solution infographic is crafted to aid in the seamless conveyance of IT strategies and structures. The intuitive layout provides a straightforward narrative to IT infrastructure, ensuring your audience grasps technical details without feeling overwhelmed. This infographic is a must-have for anyone presenting IT concepts, delivering a balanced combination of simplicity and detail that caters to both novice and expert levels. With compatibility across various presentation platforms, this infographic integrates smoothly into your existing slides, enhancing your ability to communicate effectively in the digital age. Elevate your IT presentations with this essential visual aid.


7 slides
Blue Ocean Diagram Presentation
The Blue Ocean Strategy goal is to create a market space that is untapped, and in doing so, break away from the competition, create new demand, and increase profits. This template is designed for use in Powerpoint, Keynote, and Google Slides, and is perfect for anyone looking to create an informative and engaging presentation on this topic. This template is a useful tool for professionals and students. It provides informative illustration and information about the Blue Ocean Strategy to help you visually present your research, build a strategy or deliver a presentation on blue ocean strategies.


8 slides
Puzzle Piece Strategy Connection Presentation
Align your ideas with clarity using the Puzzle Piece Strategy Connection Presentation. This vertical puzzle layout visually connects four key steps, making it perfect for illustrating strategy alignment, workflow processes, or integrated systems. Easily editable in PowerPoint, Canva, or Google Slides—ideal for team briefings or strategic roadmaps.


7 slides
AIDA Selling Model Infographic
The AIDA model is a widely used marketing and advertising framework that outlines the stages a consumer typically goes through when engaging with a product or service. This infographic template is a dynamic and compelling tool designed to conquer the attention and minds of your audience. AIDA, the cornerstone of marketing, stands for Attention, Interest, Desire, and Action—an unyielding formula for successful engagement. Fully customizable and compatible with Powerpoint, Keynote, and Google Slides. Prepare to take your marketing strategies to exhilarating heights with this infographic.


3 slides
Future of Aviation Technologies Presentation
Soar into the future of flight with this sleek, data-driven layout that visualizes progress and innovation in aviation. Perfect for showcasing new technologies, sustainability efforts, or industry growth trends, it balances clarity and impact. Fully customizable and compatible with PowerPoint, Keynote, and Google Slides for effortless presentation design.


6 slides
Strategic Planning with OKRs
Align your business strategy with measurable outcomes using this OKR-based planning slide. Highlight objectives, key activities, and results alongside a clear problem-solution structure. Perfect for strategy sessions and team planning meetings. Fully editable in PowerPoint, Keynote, and Google Slides.


5 slides
Suicide Awareness Stats Infographics
Navigate the sensitive topic of suicide with the suicide awareness stats infographics template. Crafted with care in shades of blue, white, and purple, this vertical, informative infographic serves as a profound educational tool. It is essential for mental health advocates, educational institutions, and community outreach programs, offering a respectful yet impactful way of presenting statistics and information. The template includes thoughtfully designed graphics, relevant icons, and placeholders for real-world images, ensuring the data speaks volumes in raising awareness, promoting prevention, and supporting life-affirming actions within various communities.


7 slides
Social Media Marketing Infographic
Social Media Marketing refers to the use of social media platforms and networks to promote a product, service, or brand. This fully editable, infographic template looks great on all devices and contains all complete set of slides shown above. You can use this colorful infographic to features tips on how to use social media posts, videos, chats and websites along with a brief explanation of each. Add your logo, banner images and call to action. The template is compatible with Powerpoint, Keynote and Google Slides, so you can easily add in your custom data for a professional finish.


6 slides
5-Stage Sales Funnel Presentation
Visualize your sales process effortlessly with this 5-Stage Sales Funnel template. Ideal for showcasing lead conversion, customer journey, and sales strategies, this design is fully customizable. Adjust colors, text, and icons to fit your needs. Compatible with PowerPoint, Keynote, and Google Slides for seamless integration into your presentations.


5 slides
Importance of Sex Education Infographics
Sex Education is an important aspect of human development, but it can be a difficult topic to discuss. It is important for individuals to be knowledgeable about their own bodies and health, as well as understand healthy relationships and consent. These Infographics are visual tools designed to illustrate the need for sex education in schools and society. This template includes statistics, data, and facts about the benefits of sex education, including reducing the risk of sexually transmitted infections and unintended pregnancies, promoting healthy relationships, and empowering young people to make informed decisions about their sexual health.


8 slides
Virtual Team Collaboration Presentation
The "Virtual Team Collaboration" presentation template is designed to highlight different facets of teamwork in a remote setting. Each slide features a central visual metaphor illustrated by connected circles, symbolizing the interconnected nature of virtual team activities and communication. The layout provides placeholders for titles and descriptive text, making it suitable for detailing various aspects of virtual collaboration such as project management, communication protocols, and role assignments. The design encourages a clear and organized presentation of information, facilitating discussions on best practices and strategies for effective remote teamwork.