


Features
- 5 Unique slides
- Fully editable and easy to edit in Microsoft Powerpoint, Keynote and Google Slides
- 16:9 widescreen layout
- Clean and professional designs
- Export to JPG, PDF or send by email


Do you have any questions?
Recommend


6 slides
Workload Distribution and Calendar Plan Presentation
Stay on top of weekly responsibilities with the Workload Distribution and Calendar Plan Presentation. This visual planning template helps teams clearly assign tasks across days of the week, making it easy to organize schedules and boost productivity. Fully editable in PowerPoint, Keynote, and Google Slides.


6 slides
Enterprise Loyalty Program Infographic
A loyalty program is a structured marketing strategy designed to encourage customers to continue doing business with a company or brand by offering various incentives, rewards, and benefits for their ongoing loyalty and repeat purchases. This infographic template is a visual representation of the key components, benefits, and features of a loyalty program designed for a large-scale business or enterprise. This template visually conveys the value of the program, encourages participation, and showcases the benefits that customers can enjoy by becoming loyal members. This is compatible with Powerpoint, Keynote, and Google Slides.


5 slides
Website SEO Performance Analytics Presentation
Visualize your website’s performance data clearly and professionally with this structured SEO analytics slide. This template features a tiered layout with a central search bar icon and four vertically-aligned data sections—perfect for breaking down KPIs like traffic sources, bounce rates, keyword rankings, and conversion rates. Ideal for digital marketers, SEO analysts, and reporting presentations. Fully editable in PowerPoint, Keynote, and Google Slides.


5 slides
Pricing Strategy and Comparison Table Presentation
Present your pricing plans with clarity and impact using the Pricing Strategy and Comparison Table Presentation. This slide offers a structured layout to compare features, pricing tiers, and plan benefits side-by-side. Perfect for SaaS, services, or product pitches. Fully editable in Canva, PowerPoint, Google Slides, and Keynote.


3 slides
Business Self-Introduction
Make a memorable first impression with this clean, skill-focused introduction slide. Ideal for presenting professional backgrounds, role highlights, and expertise levels. Great for resumes, team intros, or portfolio decks. Fully editable in PowerPoint, Keynote, and Google Slides.


8 slides
Employee Performance Review Presentation
Assess and visualize team performance effectively with these "Employee Performance Review" presentation templates. Crafted to simplify performance analysis, these slides allow you to pinpoint strengths and areas for improvement through clear, sequential visual layouts. They are perfect for managers looking to foster growth and productivity, and are fully compatible with PowerPoint, Keynote, and Google Slides.


22 slides
Hellenic Small Business Pitch Deck Presentation
Unleash the spirit of entrepreneurship with this captivating Hellenic-themed presentation! Designed specifically for small business pitches, this template allows you to showcase your business concept, market analysis, and financial plans with elegance and clarity. Its vibrant visuals will engage your audience and leave a lasting impression. Compatible with PowerPoint, Keynote, and Google Slides.


5 slides
IT Support and Systems Presentation
Streamline your tech communication with a clean, structured layout that highlights your IT services, support processes, and system workflows. Perfect for teams presenting solutions, infrastructure overviews, or technical strategies, this presentation brings clarity to complex topics. Fully compatible with PowerPoint, Keynote, and Google Slides for effortless editing and delivery.


5 slides
Mission and Values Alignment
Align your purpose with progress using this clean, directional layout that maps your mission, core values, and strategic focus in a unified flow. Perfect for internal briefings or culture decks, this slide visually connects each value to your organizational journey. Fully compatible with PowerPoint, Keynote, and Google Slides.


4 slides
Social Campaign Planning Presentation
Bring clarity to your outreach goals with a bold, funnel-style layout that makes every campaign step easy to visualize. This presentation helps you outline stages, objectives, and audience actions in a clean, structured format ideal for marketing teams. Fully editable and compatible with PowerPoint, Keynote, and Google Slides.


5 slides
Renewable Natural Energy Resources Infographics
Renewable natural energy resources, also known as renewable energy sources, are energy sources that are replenished naturally and sustainably. These vertical infographics serve as educational tools to promote awareness and understanding of renewable energy sources. They can be used in presentations, workshops, educational materials, or sustainability initiatives to inspire individuals, organizations, and communities to embrace and invest in renewable energy for a greener and more sustainable future. They are fully customizable and compatible with Powerpoint, Keynote, and Google Slides.


5 slides
Cloud Computing Services Overview Presentation
Simplify cloud service explanations with this Cloud Computing Services Overview template. Perfect for IT professionals, business leaders, and tech strategists, this slide visually breaks down key cloud services and infrastructure using an intuitive, easy-to-understand layout. Featuring color-coded icons and modern design, this template helps showcase essential cloud computing components effectively. Fully compatible with PowerPoint, Keynote, and Google Slides for seamless integration into your presentations.


7 slides
Cryptocurrency Market Infographic Presentation
The importance of cryptocurrency includes decentralization, privacy, accessibility, investment potential, and innovation. This template introduces the most comprehensive cryptocurrency infographic to help you increase your understanding of cryptocurrencies. You can use this template to present examples and tips on how to navigate and make commercial use of cryptocurrency. This template is designed in Powerpoint, Keynote, and Google Slides which allows you to easily edit this presentation and include your data. The cryptocurrency theme allows you to make your data stand out with a unique design.


23 slides
Ethelin Digital Strategy Presentation
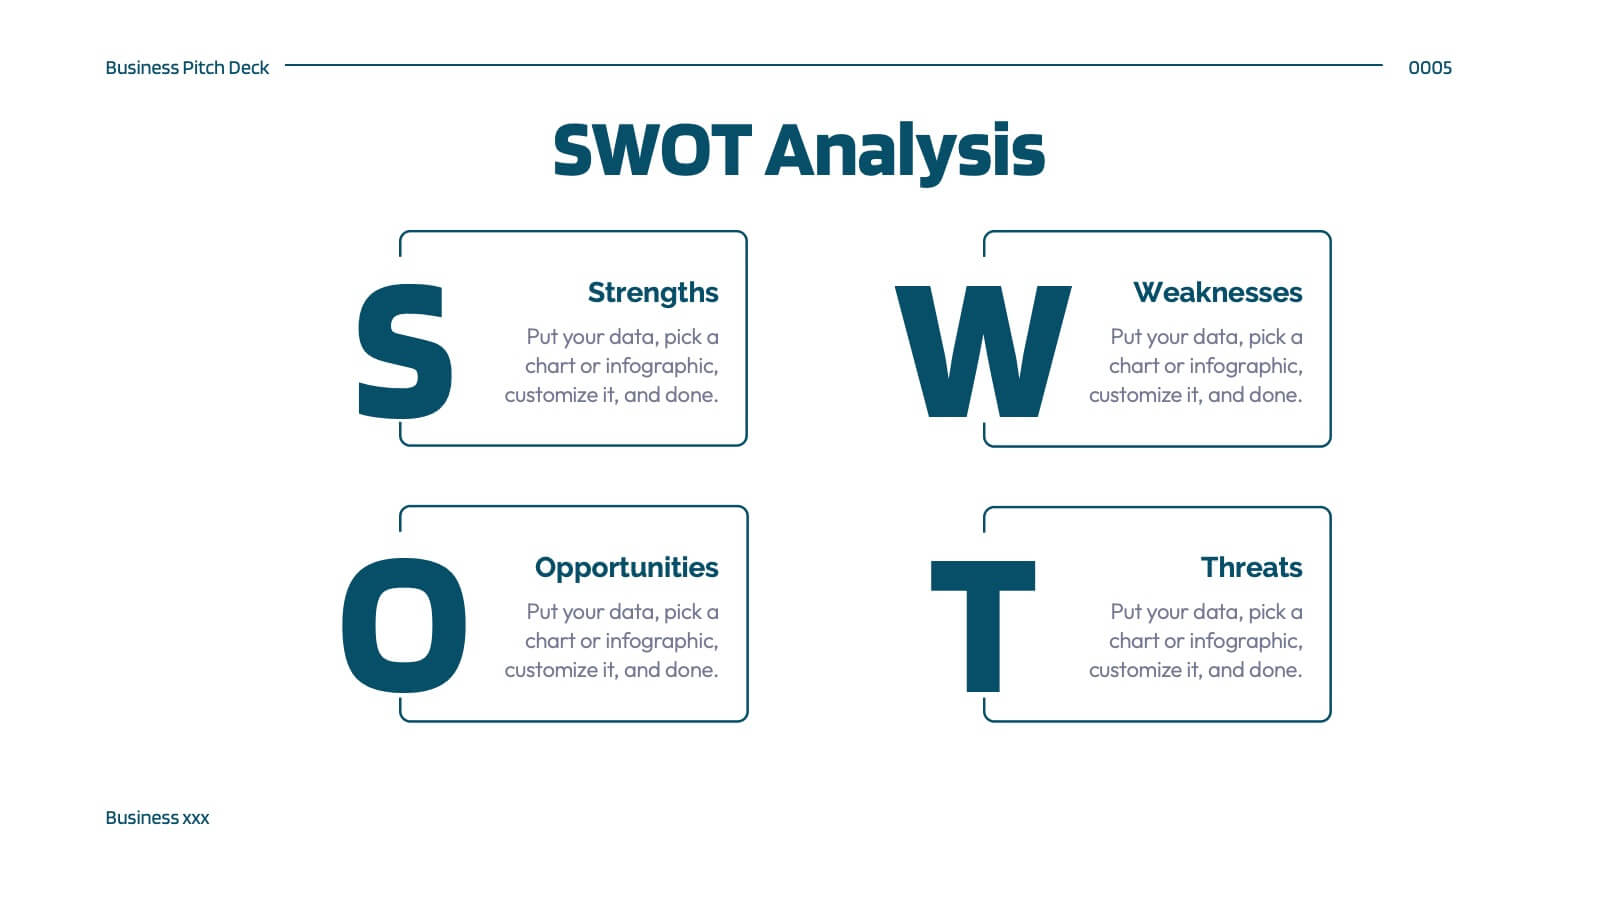
The digital strategy presentation template is designed to showcase your company's goals, market analysis, and strategic initiatives. Featuring slides for SWOT analysis, performance metrics, and action plans, it’s perfect for business planning and stakeholder engagement. Fully customizable and compatible with PowerPoint, Keynote, and Google Slides.


8 slides
Data-Driven KPI Slide Presentation
Bring your data to life with a sharp, modern layout that turns complex metrics into clear, compelling visuals. This presentation helps you showcase performance insights, compare trends, and highlight key takeaways with ease. Fully customizable and compatible with PowerPoint, Keynote, and Google Slides.


6 slides
Agile Delivery Framework for Projects Presentation
Visualize agile project phases with this spiral delivery framework slide. Ideal for project managers and scrum teams to outline each step in a continuous delivery process. Features six clearly labeled stages, icons, and bold colors. Fully editable in PowerPoint, Keynote, and Google Slides for clear, structured agile workflow presentations.


7 slides
Academic Year Schedule and Class Structure Presentation
Organize your school week with clarity using the Academic Year Schedule and Class Structure Presentation. Perfect for teachers, school coordinators, and academic planners, this timetable slide helps map out subjects and activities across days and periods. Fully customizable in PowerPoint, Keynote, Google Slides, and Canva for seamless editing.