


Features
- 20 Unique Slides
- Fully editable and easy to edit in Microsoft Powerpoint, Keynote and Google Slides
- 16:9 widescreen layout
- Clean and professional designs
- Export to JPG, PDF or send by email


Do you have any questions?
Recommend


5 slides
Corporate Goal Alignment and Execution Presentation
Drive strategic clarity with this streamlined Corporate Goal Alignment and Execution slide. This template visually connects key initiatives with execution pathways and end goals, using a funnel-style layout that highlights the flow from strategic inputs to measurable outcomes. Perfect for aligning teams, reporting progress, or visualizing OKRs. Fully customizable in PowerPoint, Keynote, and Google Slides.


6 slides
Scope Planning Template for Project Teams Presentation
Turn teamwork into strategy with a clear, circular layout that maps every phase of your project plan. This modern presentation helps teams define objectives, assign roles, and visualize scope effortlessly. Easy to edit and fully compatible with PowerPoint, Keynote, and Google Slides for seamless collaboration and customization.


5 slides
Business Issue Root Cause Identification
Pinpoint the real reasons behind business challenges with this clear and visual layout. This root cause identification template breaks down effects and traces them back to their sources, making it easier to align your team and propose actionable solutions. Fully customizable in PowerPoint, Keynote, and Google Slides.


10 slides
Business Growth and Market Statistics Presentation
Showcase key business growth trends and market insights with the "Business Growth and Market Statistics" presentation templates. These visuals are crafted to enhance clarity in communicating growth drivers, market dynamics, and performance metrics effectively. Ideal for corporate presentations, they're compatible with PowerPoint, Keynote, and Google Slides, ensuring a professional look across all platforms.


8 slides
Team OKRs Planning and Monitoring Presentation
Foster alignment across teams with the Team OKRs Planning and Monitoring Presentation. This creative hand-shaped visual helps illustrate collaboration between objectives, key results, and responsibilities. Ideal for performance check-ins, OKR workshops, and team planning meetings. Fully customizable in PowerPoint, Canva, Keynote, and Google Slides for seamless integration.


6 slides
Customer Feedback Insights Chart Presentation
Visualize feedback data effectively with this sleek, horizontal bar chart layout. Highlight percentages per category with bold labels and color accents to emphasize results. Ideal for surveys, product reviews, or satisfaction ratings. Fully customizable in Canva, PowerPoint, or Google Slides for a professional, easy-to-read presentation experience.


5 slides
Employee Feedback Survey Report Presentation
Deliver clear insights into team sentiment with this employee rating slide. Designed with star rating visuals and thumbs-up iconography, it's perfect for showcasing staff satisfaction, engagement, and performance reviews. Easy to customize in PowerPoint, Keynote, and Google Slides.


26 slides
Blockchain for Businesses Presentation
Navigate the world of decentralized technology with our Blockchain for Businesses presentation template, compatible with PowerPoint, Keynote, and Google Slides. Tailored for business leaders, tech entrepreneurs, and financial experts, this template is a gateway to understanding blockchain's impact on the corporate landscape. Our template demystifies blockchain, presenting its core concepts and applications in business, from enhancing security to streamlining transactions. It provides a visual narrative to explain how blockchain can be a game-changer in various industries by fostering transparency, efficiency, and trust. With customizable diagrams, charts, and case studies, you can illustrate the practical benefits of blockchain integration in business operations. This template is SEO-optimized to reach audiences interested in leveraging blockchain technology for competitive advantage. Use our template to educate your audience about the strategic implementation of blockchain and position your business at the forefront of technological innovation.


4 slides
3-Step Action Plan Next Steps Presentation
Turn your next big idea into a clear, achievable plan with this structured, goal-focused layout. Designed to visualize progress through three defined stages, it’s perfect for strategic planning, project timelines, or team roadmaps. Fully compatible with PowerPoint, Keynote, and Google Slides for smooth editing and professional presentation delivery.


6 slides
Team Leadership and Management
Foster stronger collaboration with this team-focused circular diagram. Designed to showcase six key areas of team leadership, this template is perfect for outlining communication, goal-setting, delegation, performance, feedback, and development strategies. Ideal for managers, trainers, and HR professionals. Fully customizable in PowerPoint, Keynote, and Google Slides.


21 slides
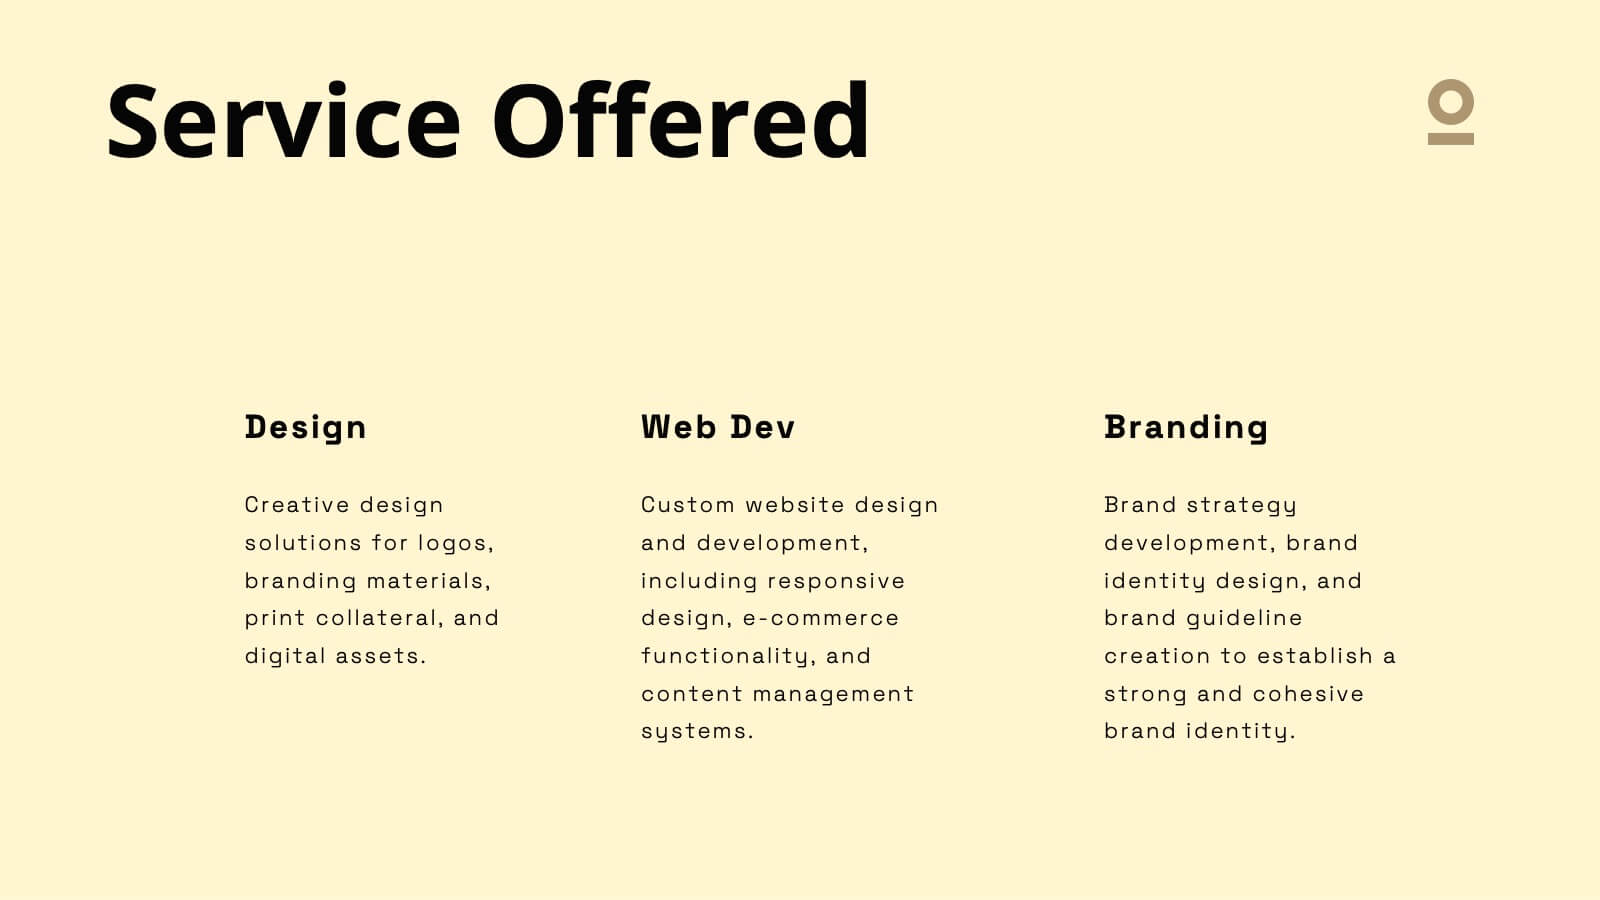
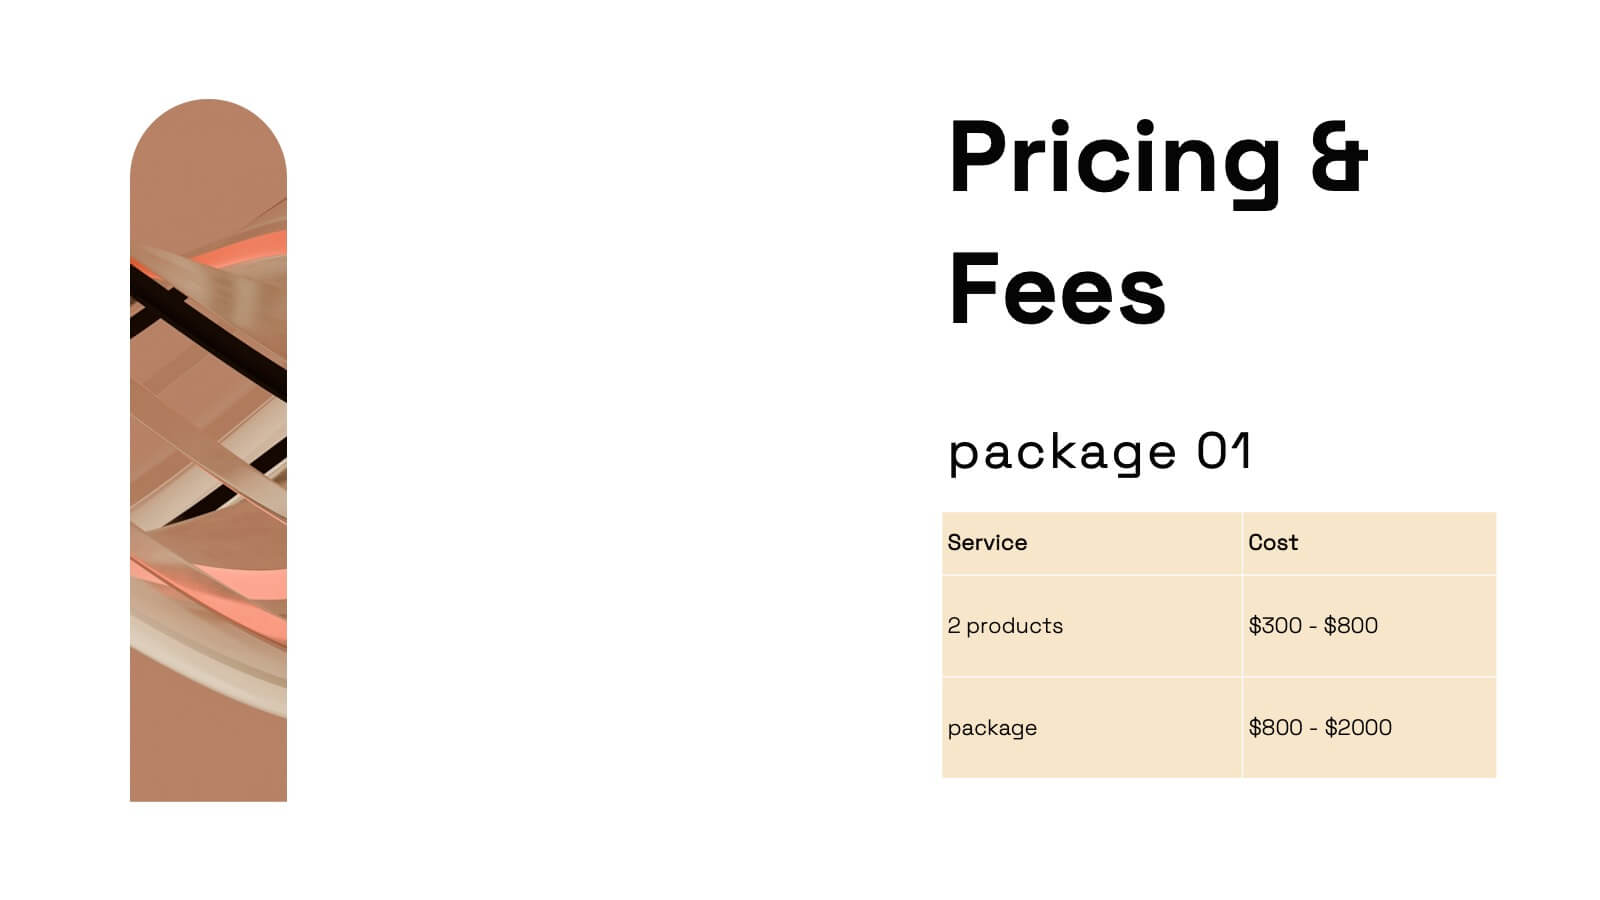
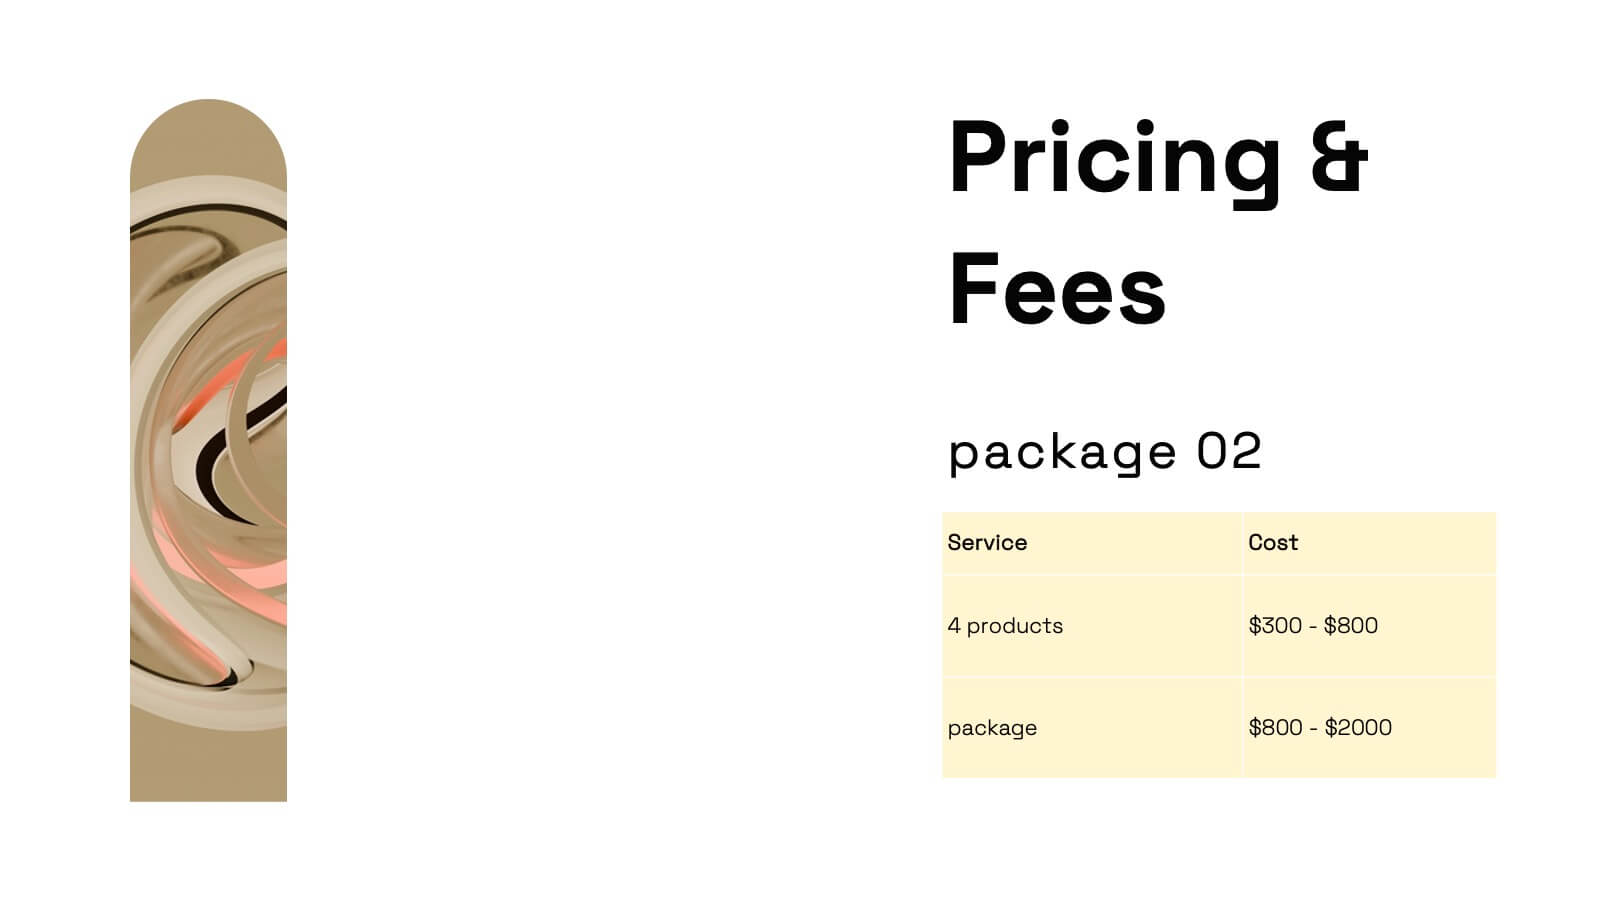
Haze Professional Portfolio Showcase Presentation
Elevate your professional presence with this stunning haze-inspired presentation template! Ideal for showcasing your portfolio, it beautifully highlights your skills, projects, and achievements with a clean and sophisticated design. This template ensures your work stands out, captivating potential clients and employers. Compatible with PowerPoint, Keynote, and Google Slides.


5 slides
Real Estate Business Process Workflow Presentation
Streamline property operations with this real estate workflow template, designed to visualize each stage from acquisition to closing. Featuring a modern cityscape graphic and five-step layout, it’s perfect for showcasing processes, timelines, or strategies. Fully editable in Canva, PowerPoint, or Google Slides for professional, industry-specific presentations.


5 slides
Cybersecurity Threat Analysis Presentation
Stay one step ahead with this bold, eye-catching slide design that makes complex cyber risk insights clear and easy to present. This layout helps you break down key threats, vulnerabilities, and security actions in a clean visual structure. Fully compatible with PowerPoint, Keynote, and Google Slides.


6 slides
Europe Region Overview Presentation
Bring your regional insights to life with a modern, minimal map layout that highlights key countries and data across Europe. Ideal for showcasing economic trends, business performance, or demographic overviews, this clean design ensures clarity and engagement. Fully compatible with PowerPoint, Keynote, and Google Slides for seamless editing.


6 slides
Innovative Idea Pitching Guide Presentation
Present your ideas with clarity using the Innovative Idea Pitching Guide Presentation. This dynamic five-step circular flow design is perfect for showcasing pitch stages, idea development, or startup concepts. Each section includes icons and text blocks to clearly explain key points, keeping your message organized and impactful. Fully editable in Canva, PowerPoint, Keynote, and Google Slides.

20 slides
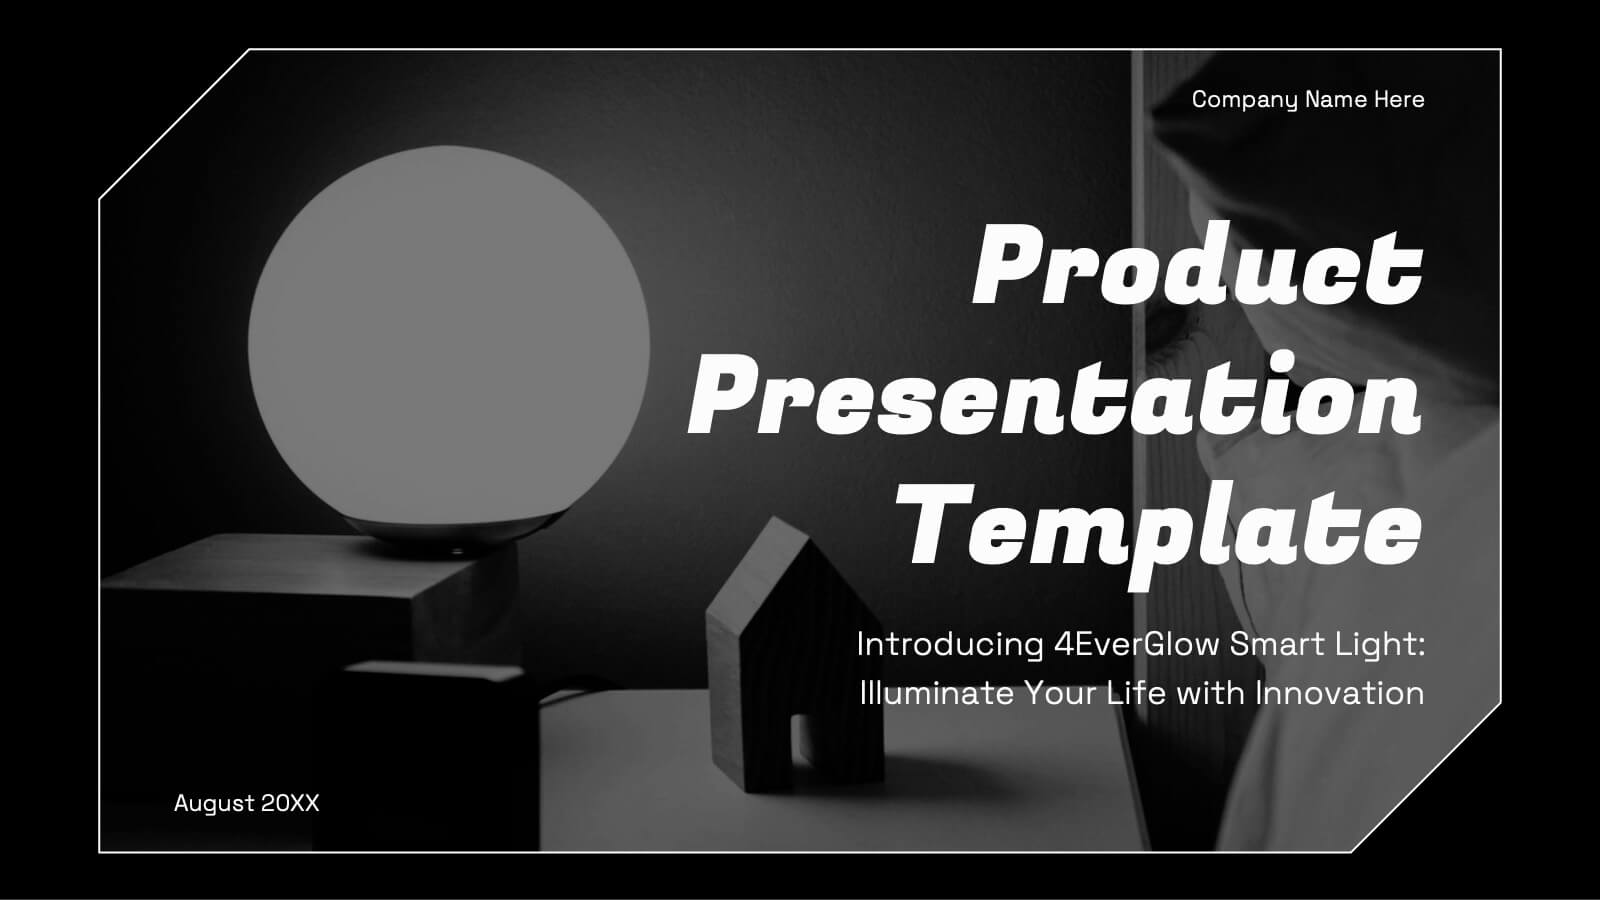
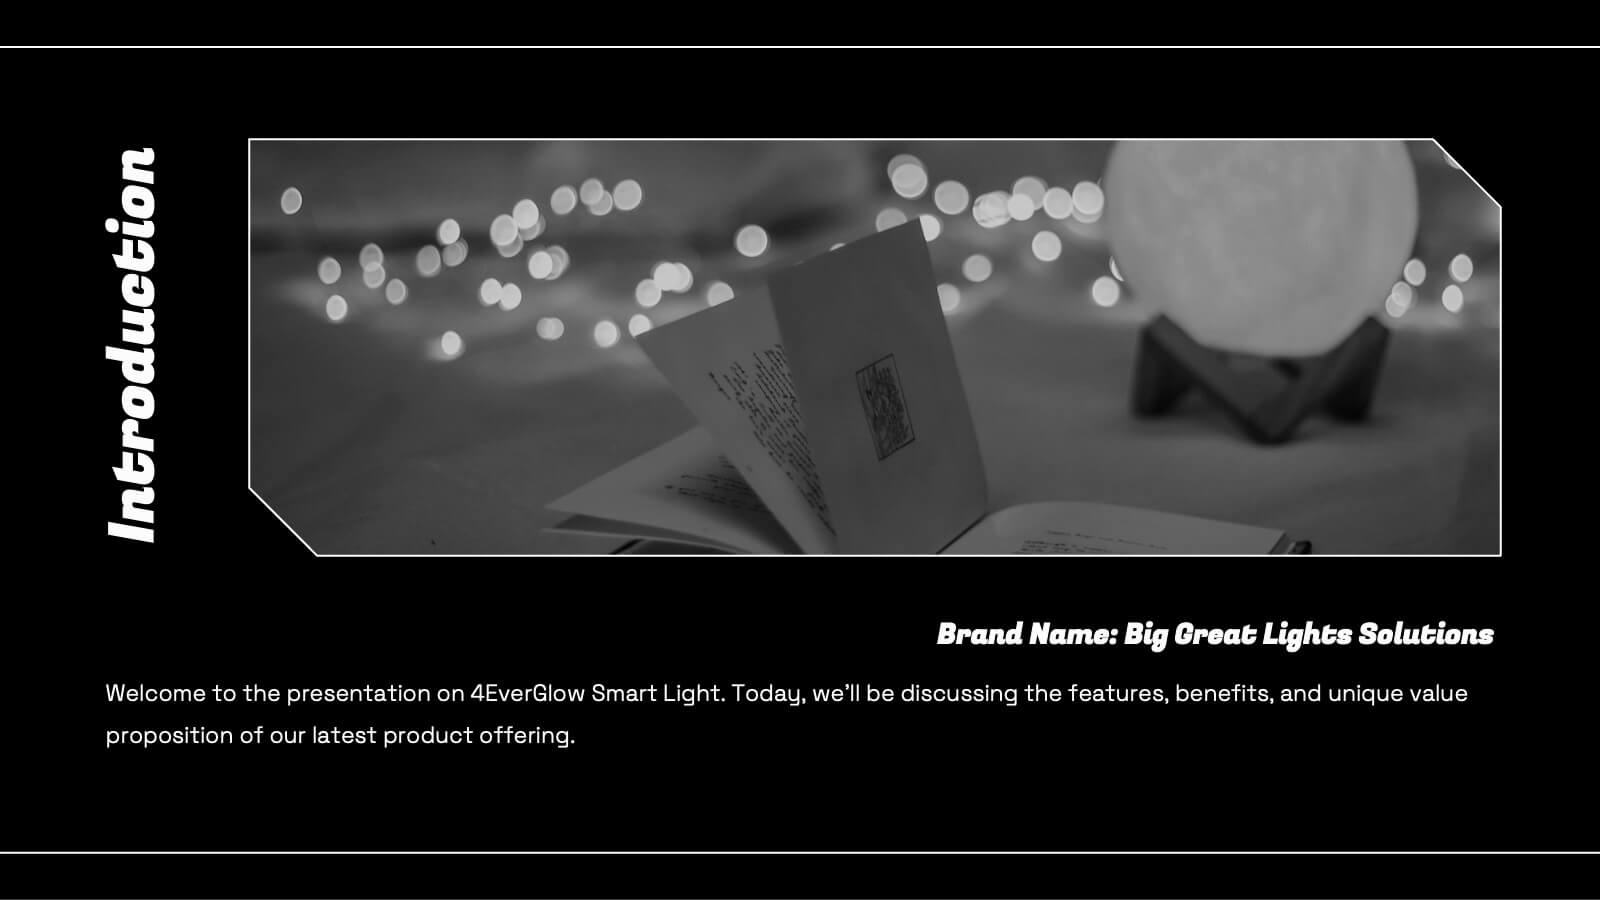
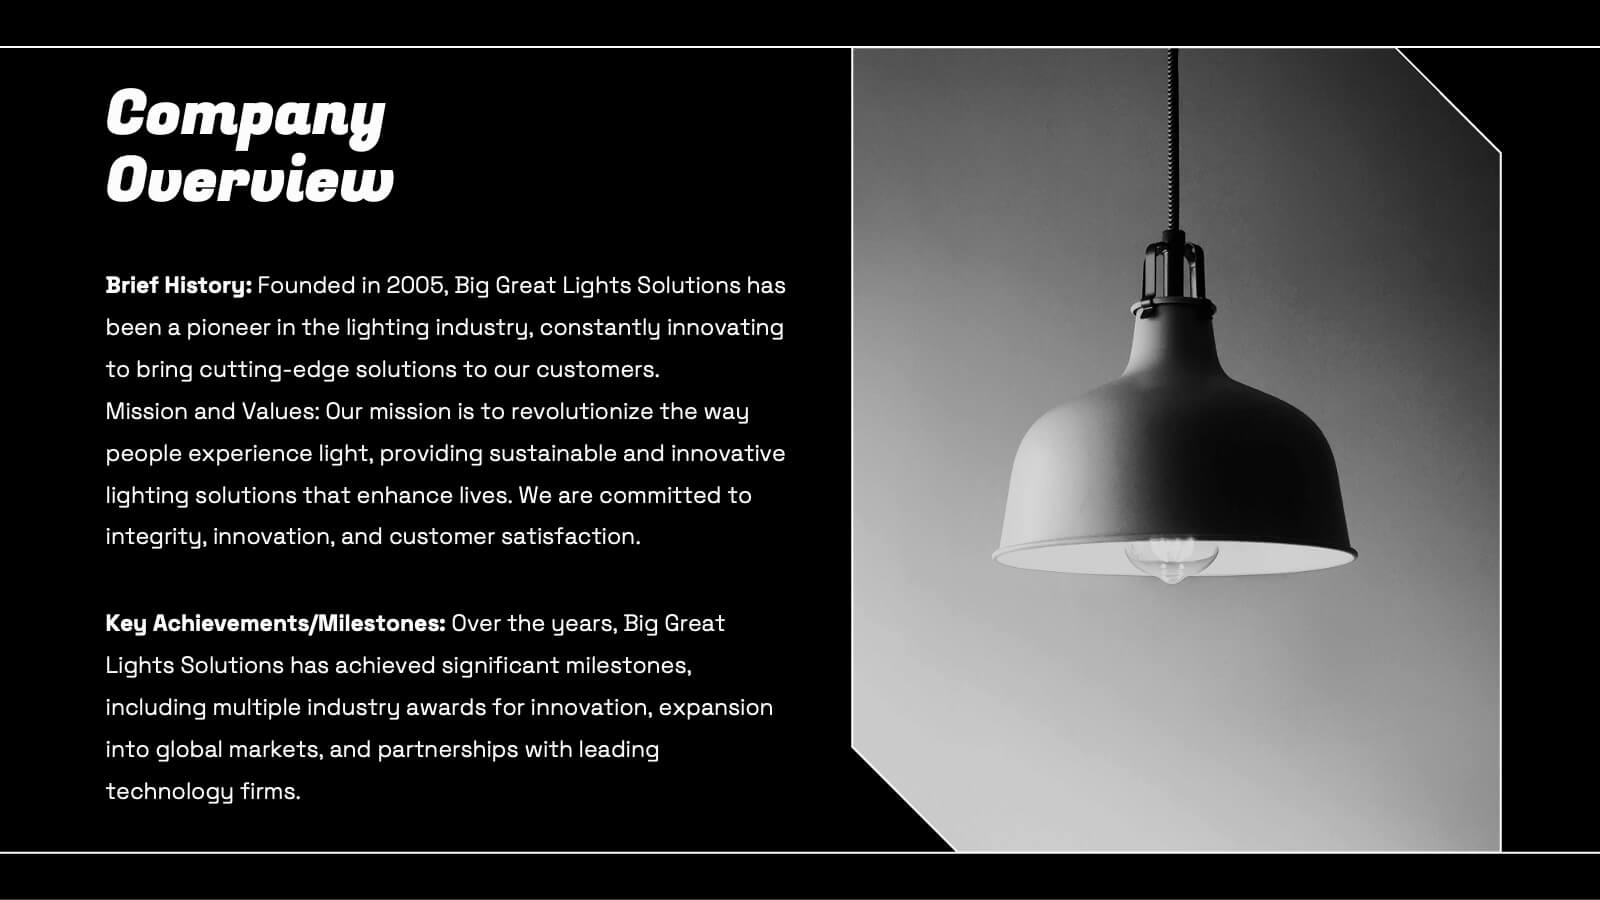
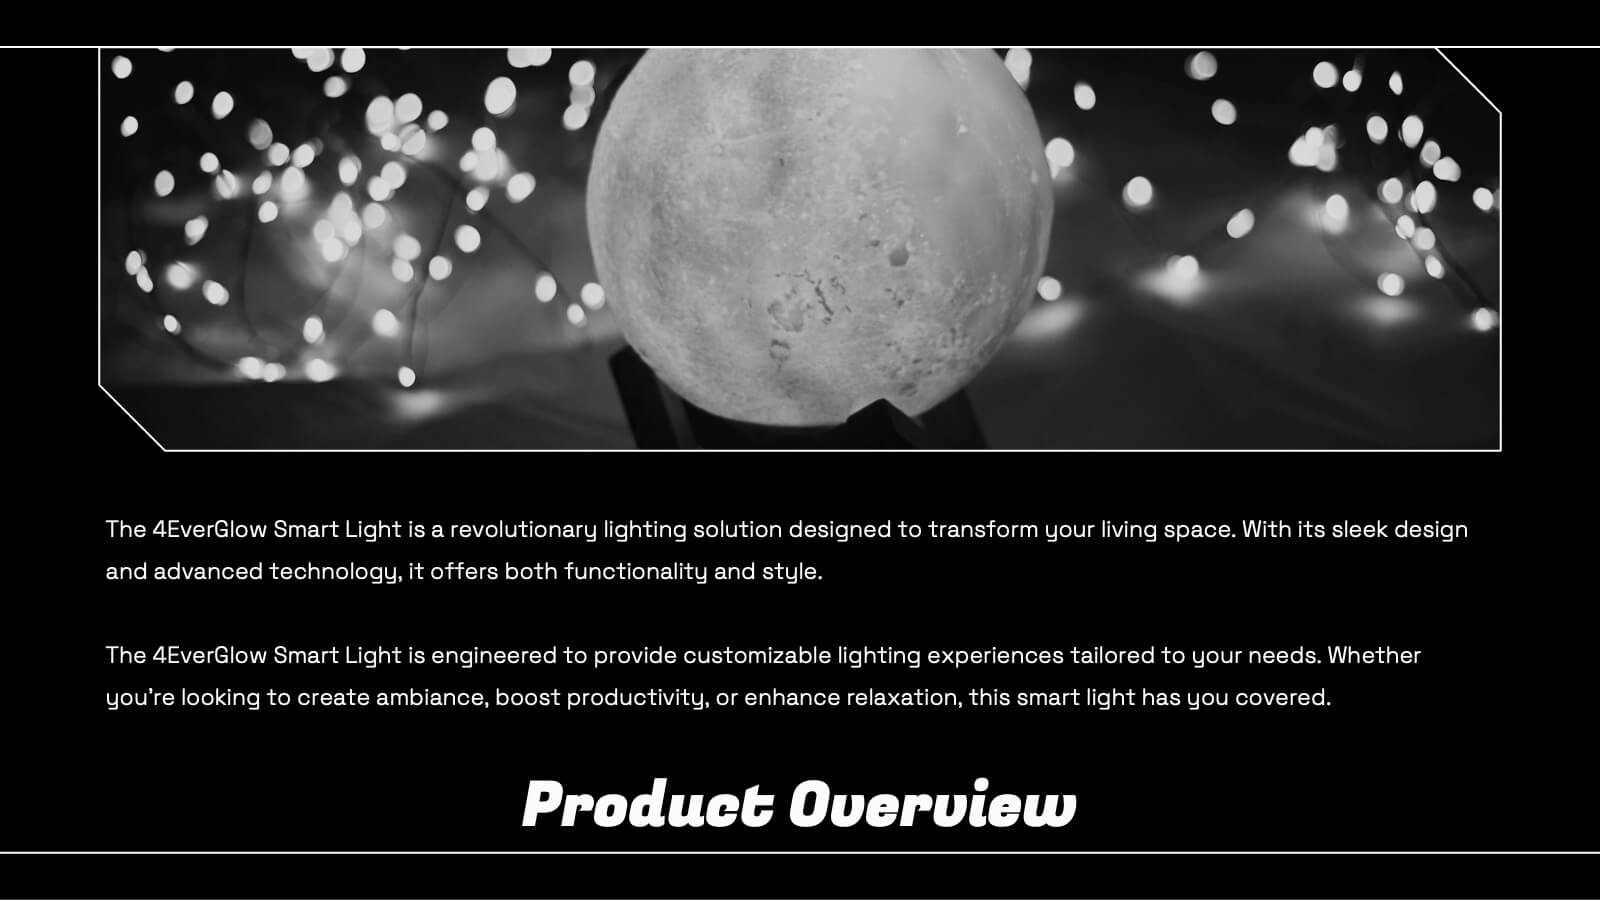
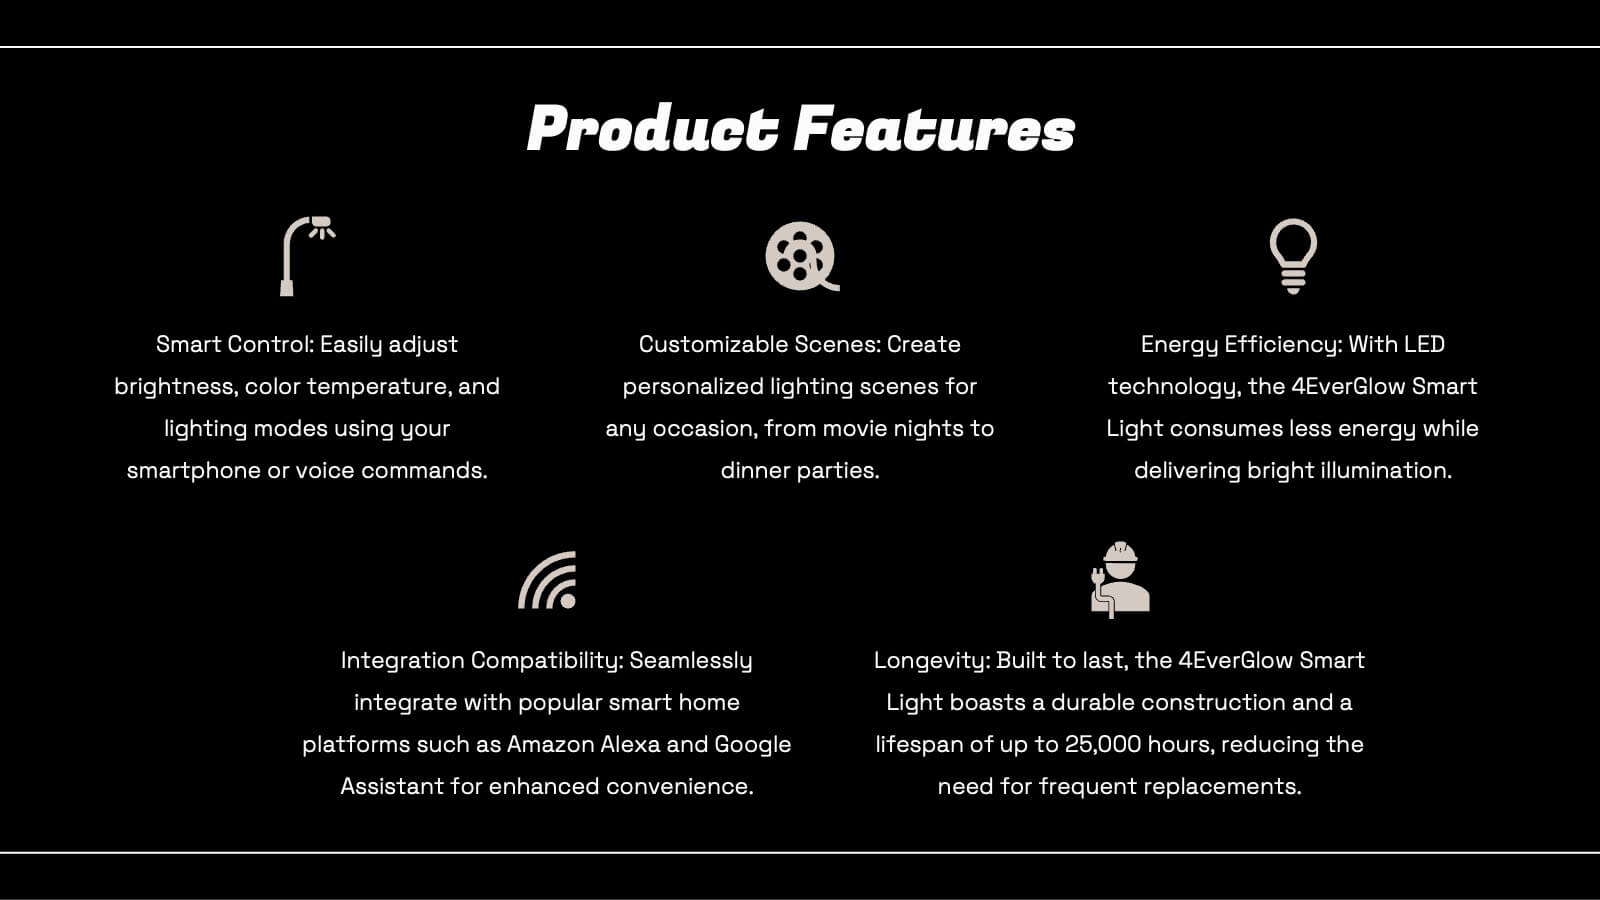
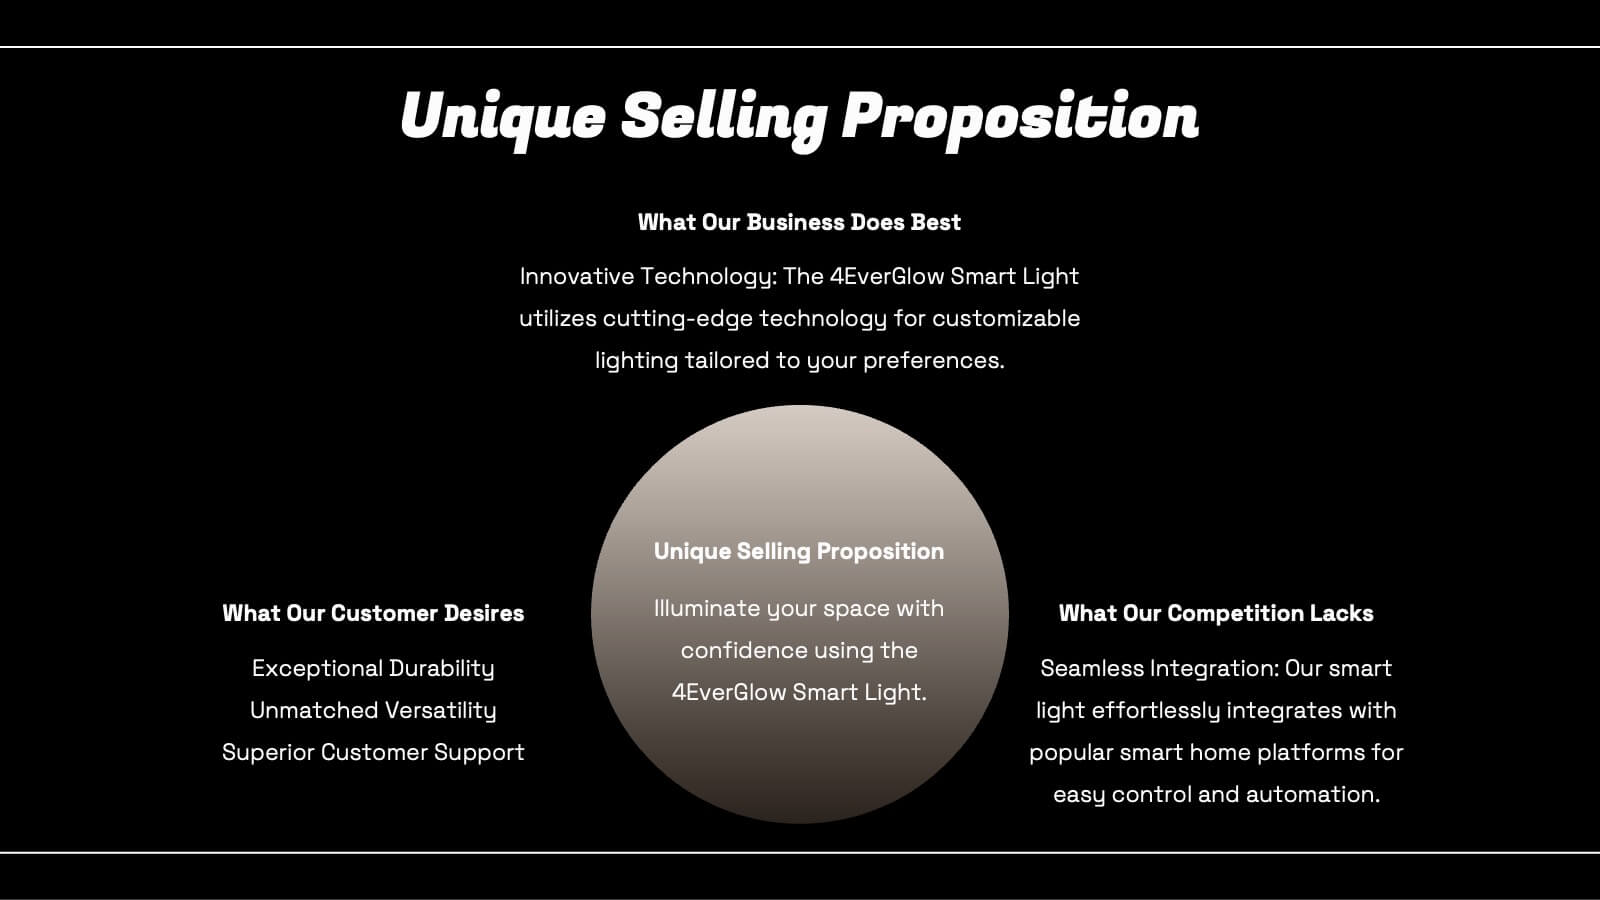
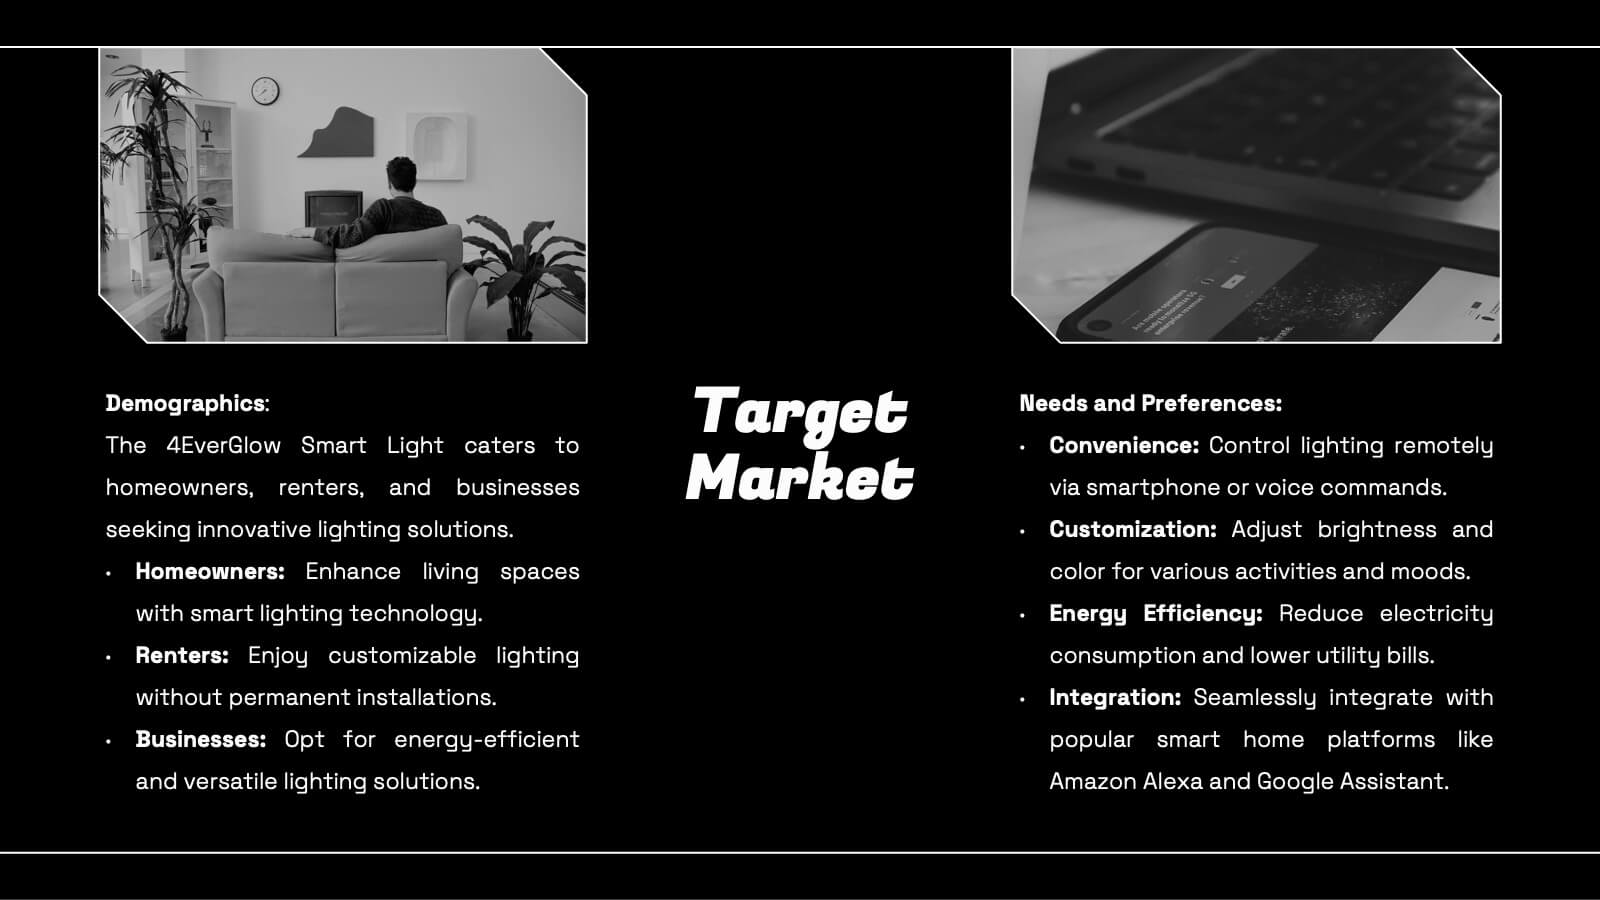
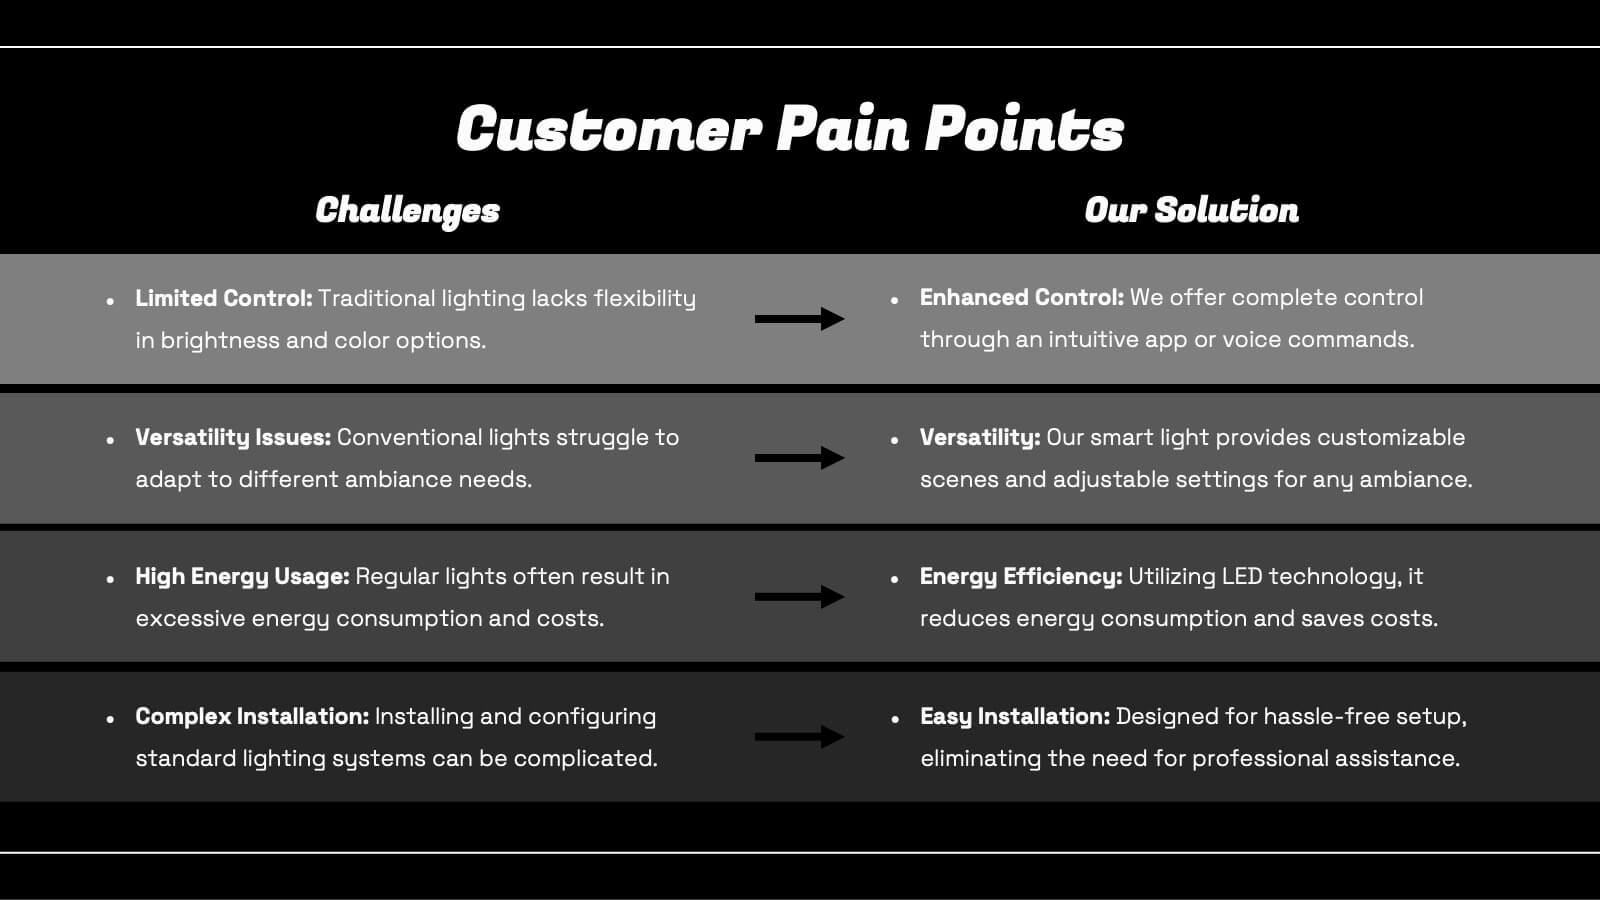
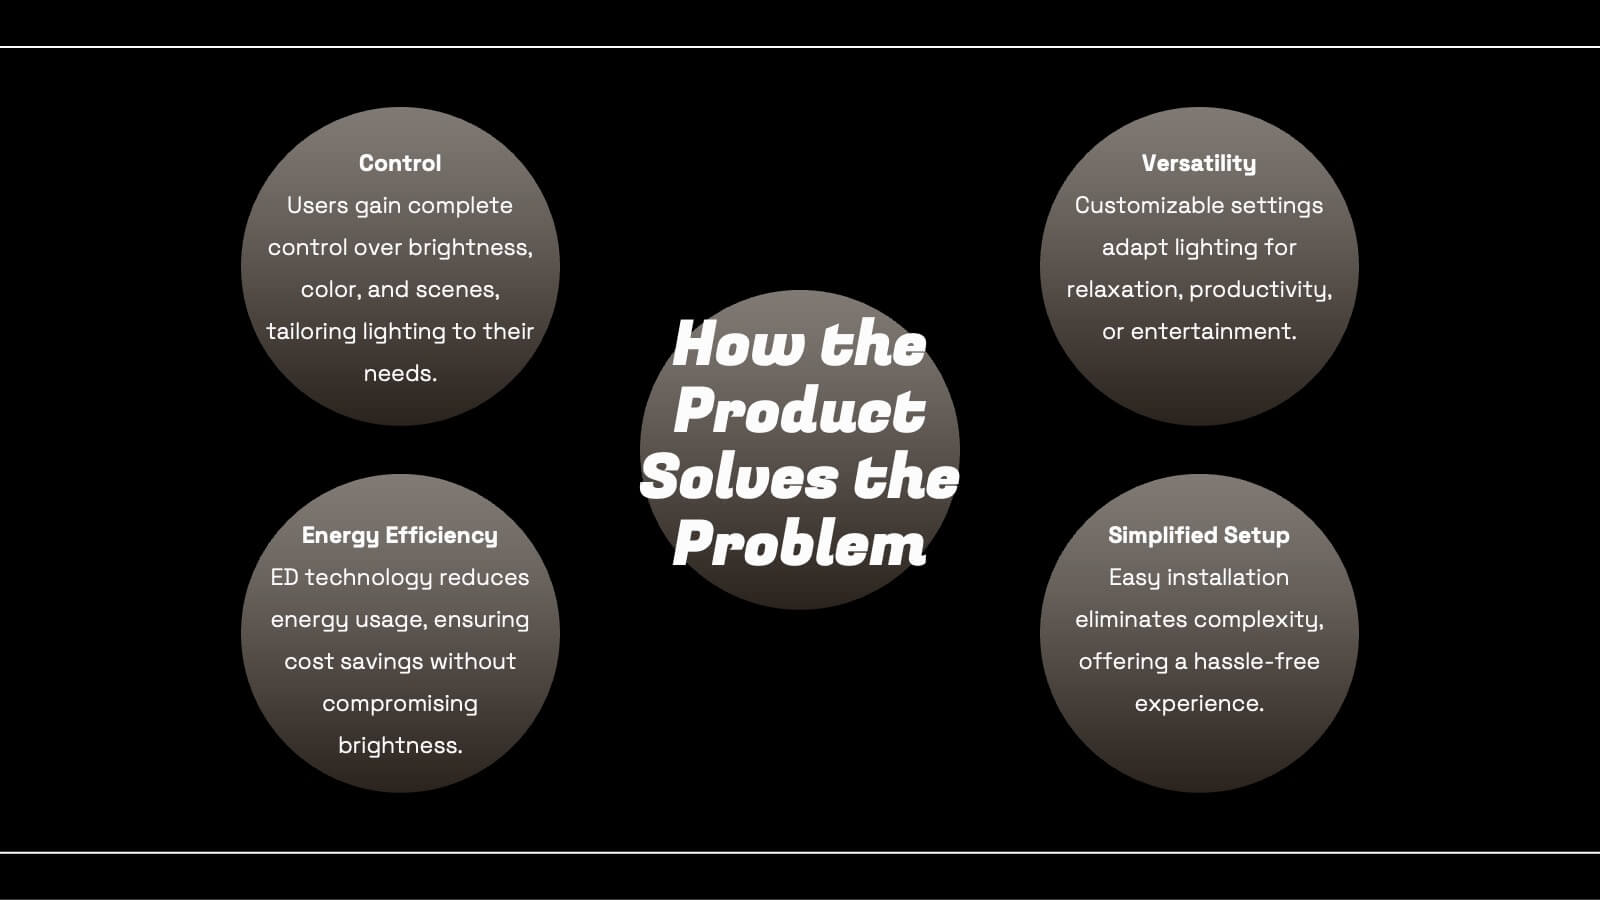
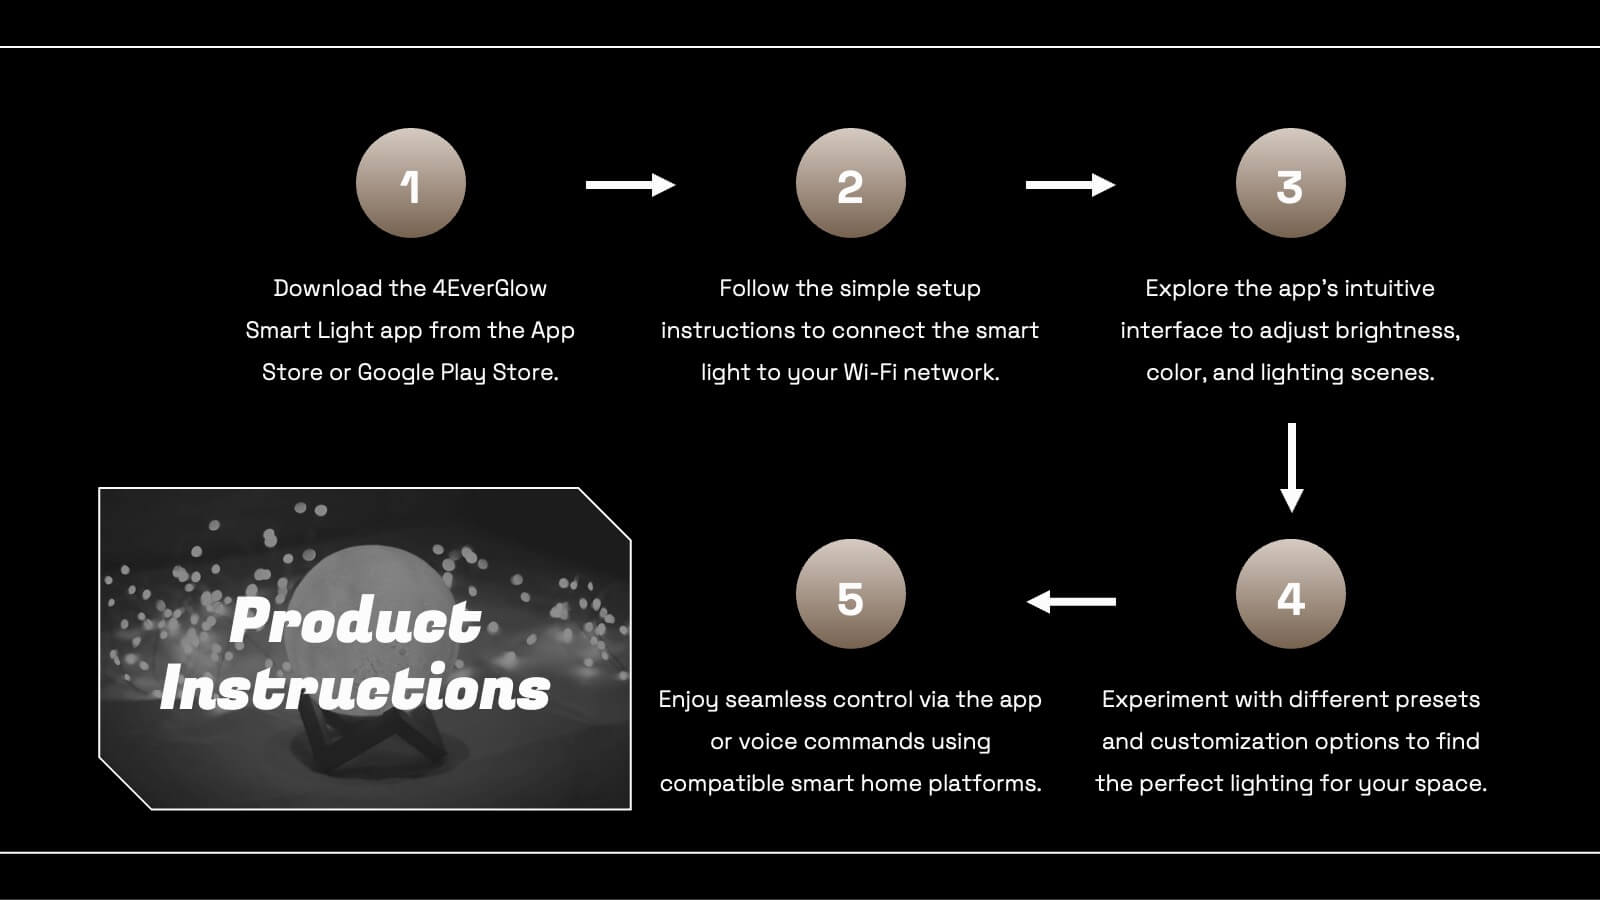
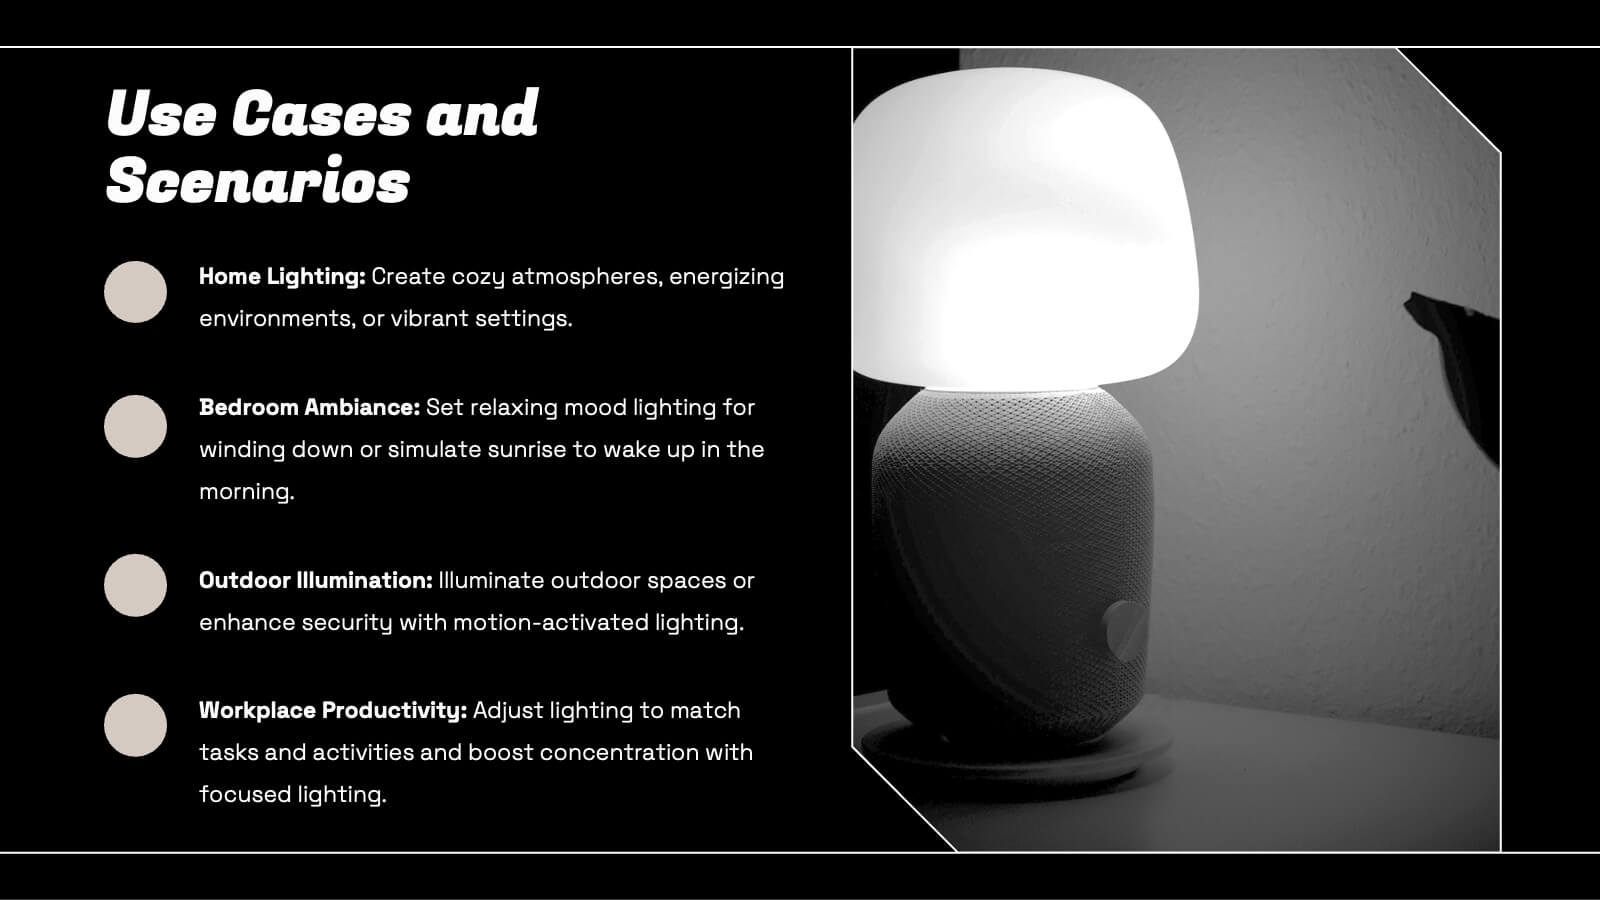
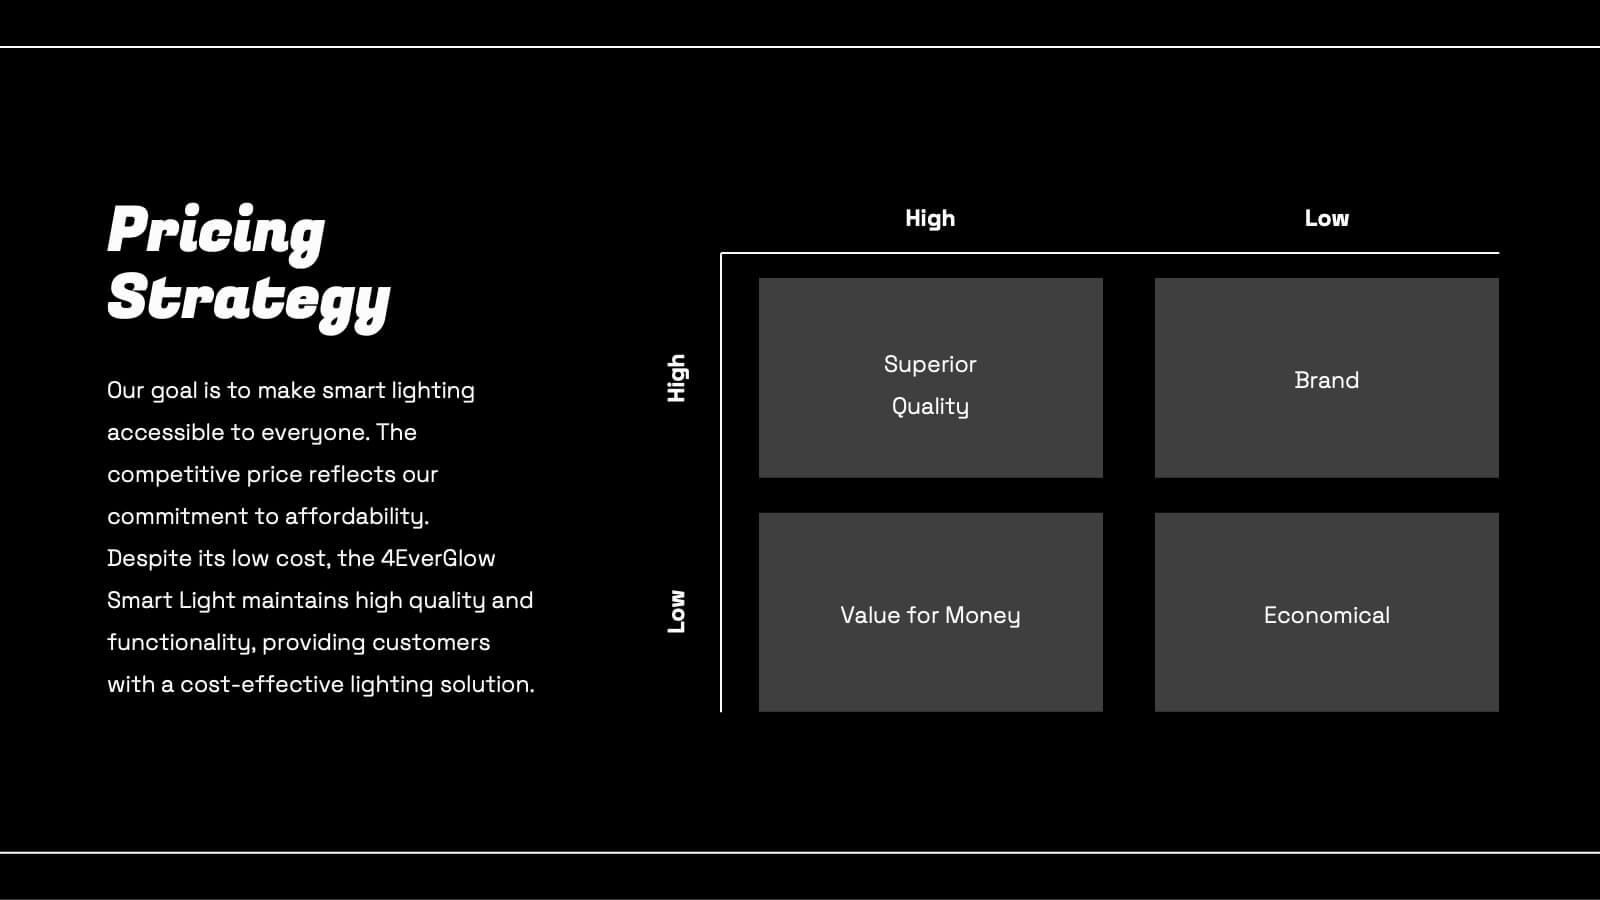
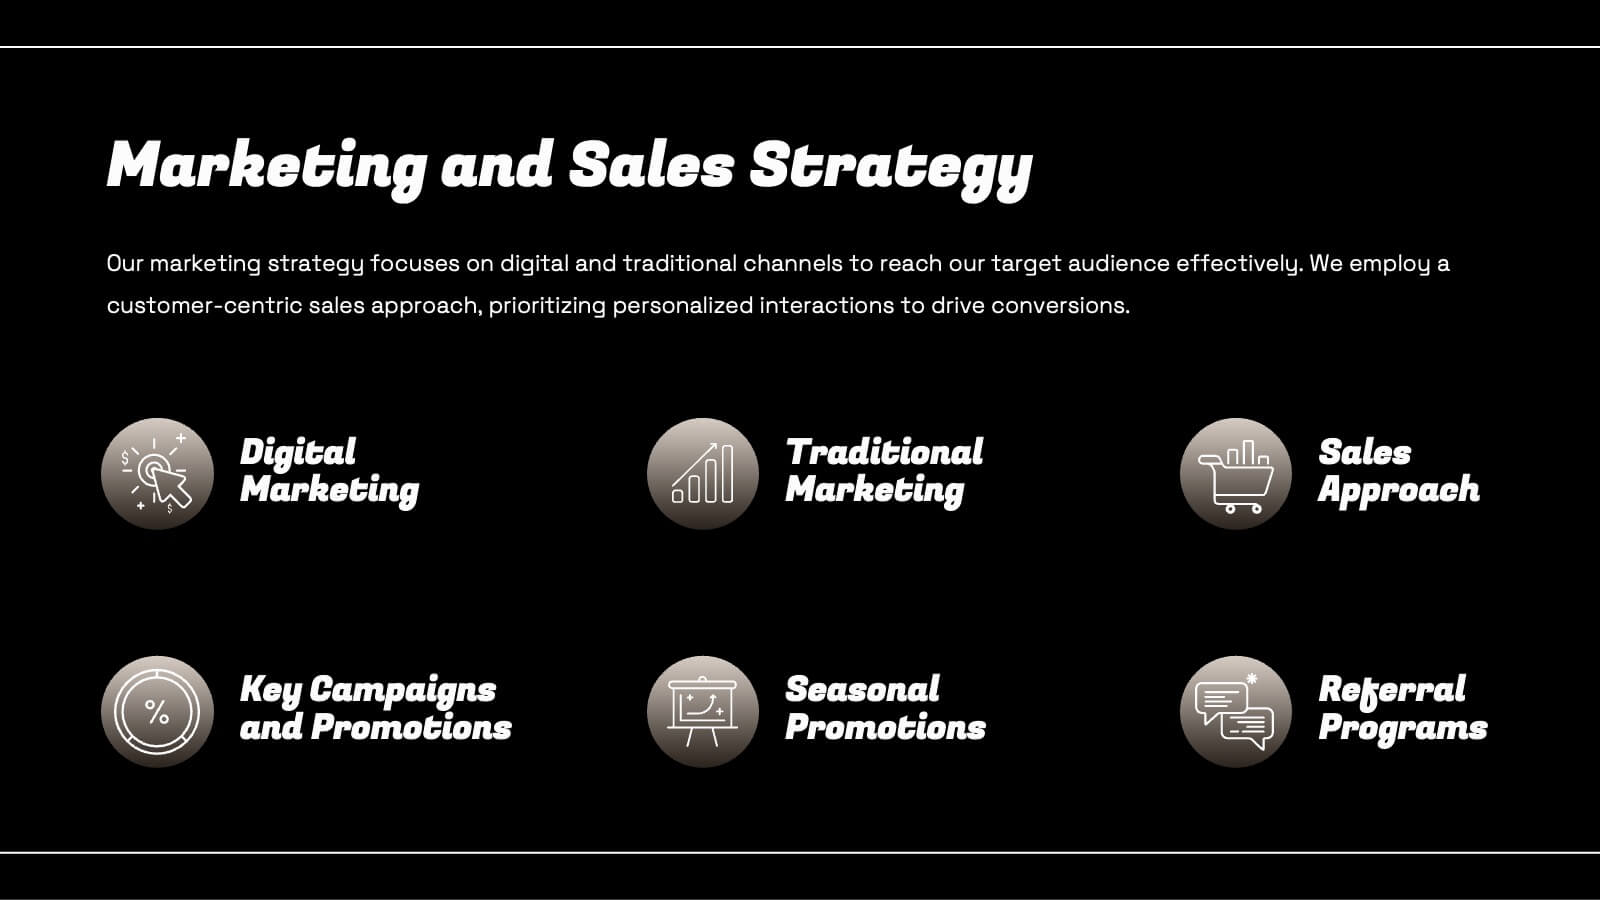
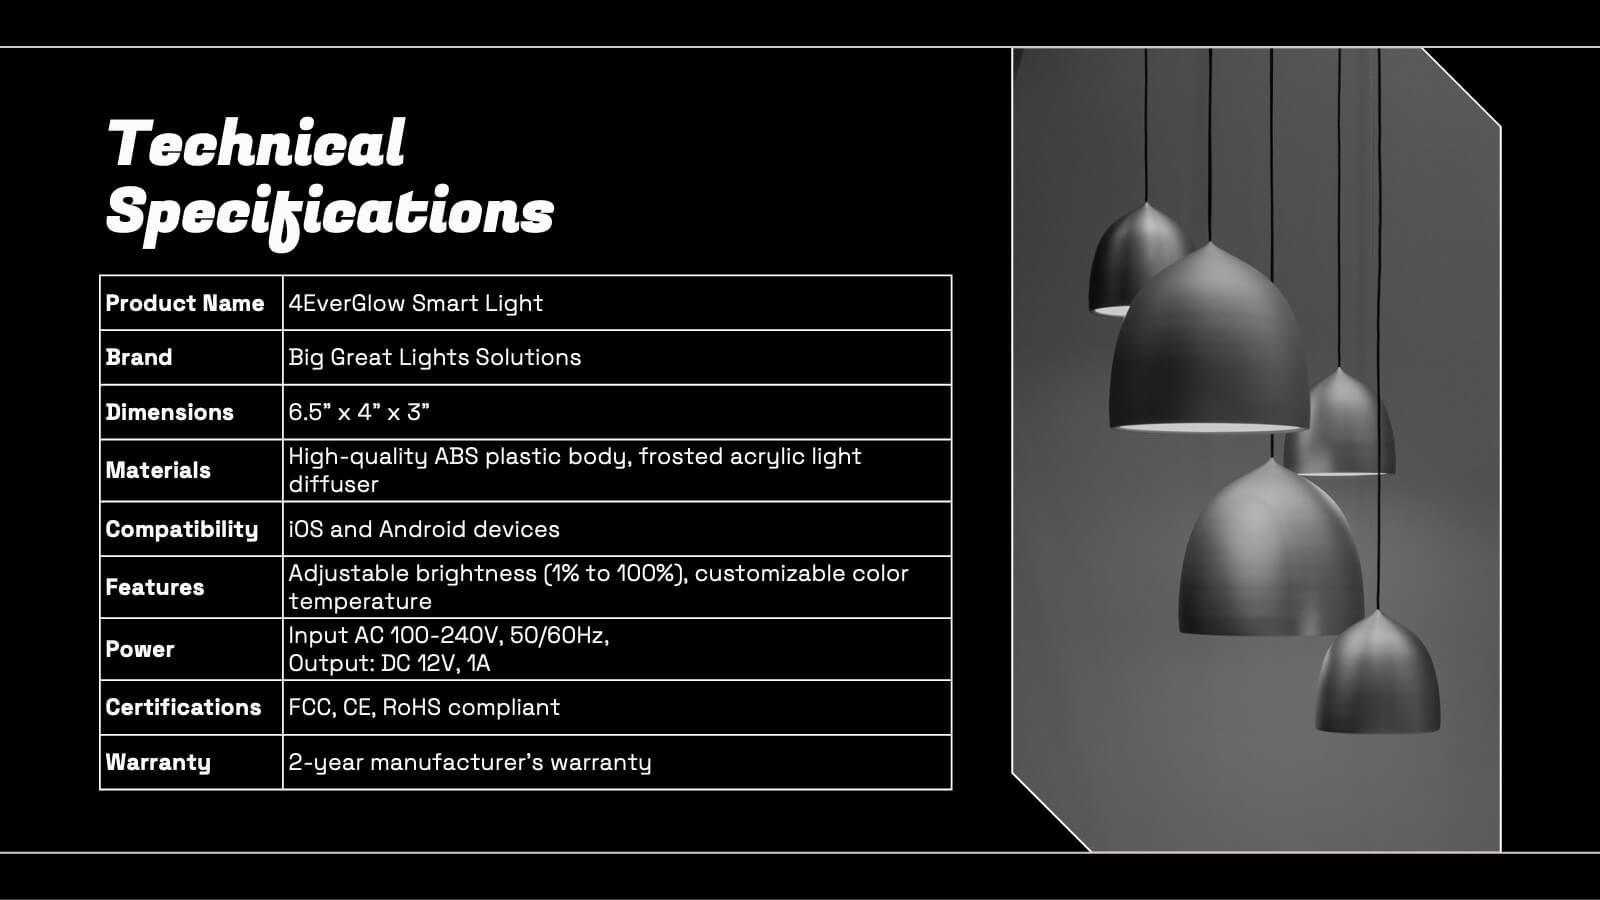
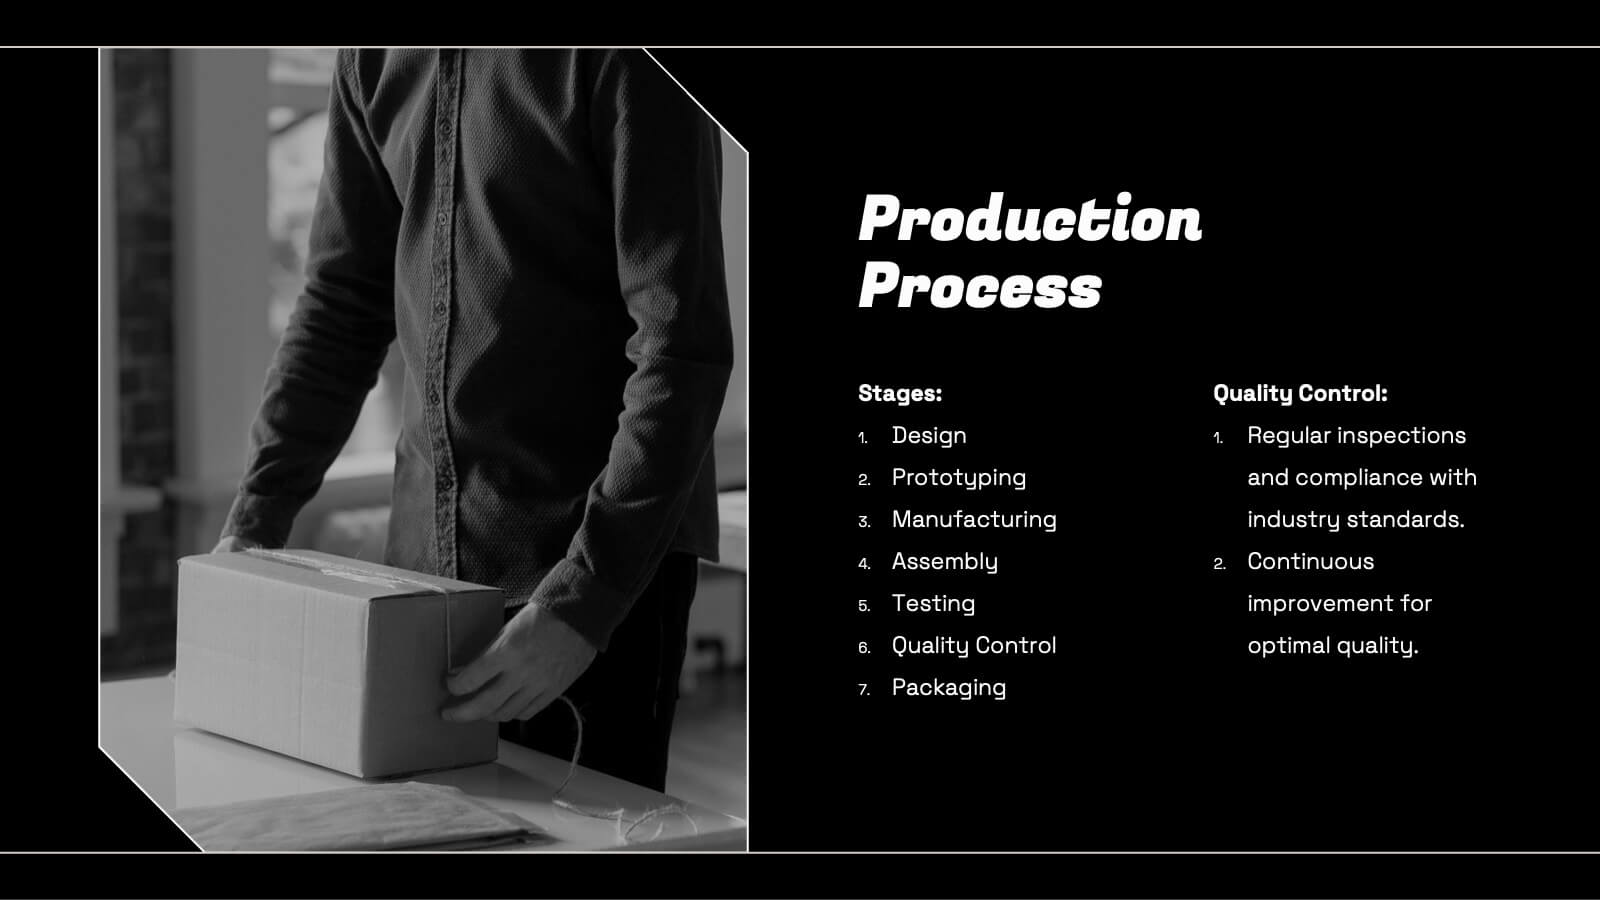
Smart Light Product Presentation
Enhance your product presentations with this Smart Lighting template. Designed for clarity and aesthetic appeal, it includes slides detailing product features, market analysis, technical specifications, and pricing strategies. Ideal for tech products, it's compatible with PowerPoint, Keynote, and Google Slides, ensuring broad accessibility and ease of use.


8 slides
Agriculture Business Model Presentation
Turn your ideas into growth with this vibrant and modern presentation design. Perfect for explaining market strategies, production cycles, or investment models in agriculture, it helps visualize key stages from concept to harvest. Fully customizable and compatible with PowerPoint, Keynote, and Google Slides for a seamless presentation experience.