


Features
- 22 Unique slides
- Fully editable and easy to edit in Microsoft Powerpoint, Keynote and Google Slides
- 16:9 widescreen layout
- Clean and professional designs
- Export to JPG, PDF or send by email


Do you have any questions?
Recommend


5 slides
Cloud Computing for Business Presentation
Present your cloud strategy with clarity using this modern five-point diagram. Each cloud icon is linked to a central device, symbolizing data flow, security, storage, and infrastructure services. Ideal for IT presentations, cloud migration plans, or SaaS workflows. Fully editable in PowerPoint, Keynote, and Google Slides.


8 slides
Business Lifecycle Circle Format Presentation
Present your business stages with clarity using this lifecycle circle diagram. Ideal for showcasing four key phases—planning, execution, growth, and review—in a circular format that emphasizes continuity. Each section includes icons and editable text. Fully customizable in PowerPoint, Keynote, or Google Slides for strategy meetings, reports, or progress updates.


12 slides
Alphabet Learning and Education Presentation
Introduce concepts creatively with this bold "A"-shaped infographic designed for education topics. Each segment of the letter highlights a numbered point, making it ideal for step-by-step instructions, learning stages, or literacy development. Use it to simplify complex ideas visually. Fully editable in PowerPoint, Keynote, and Google Slides.

20 slides
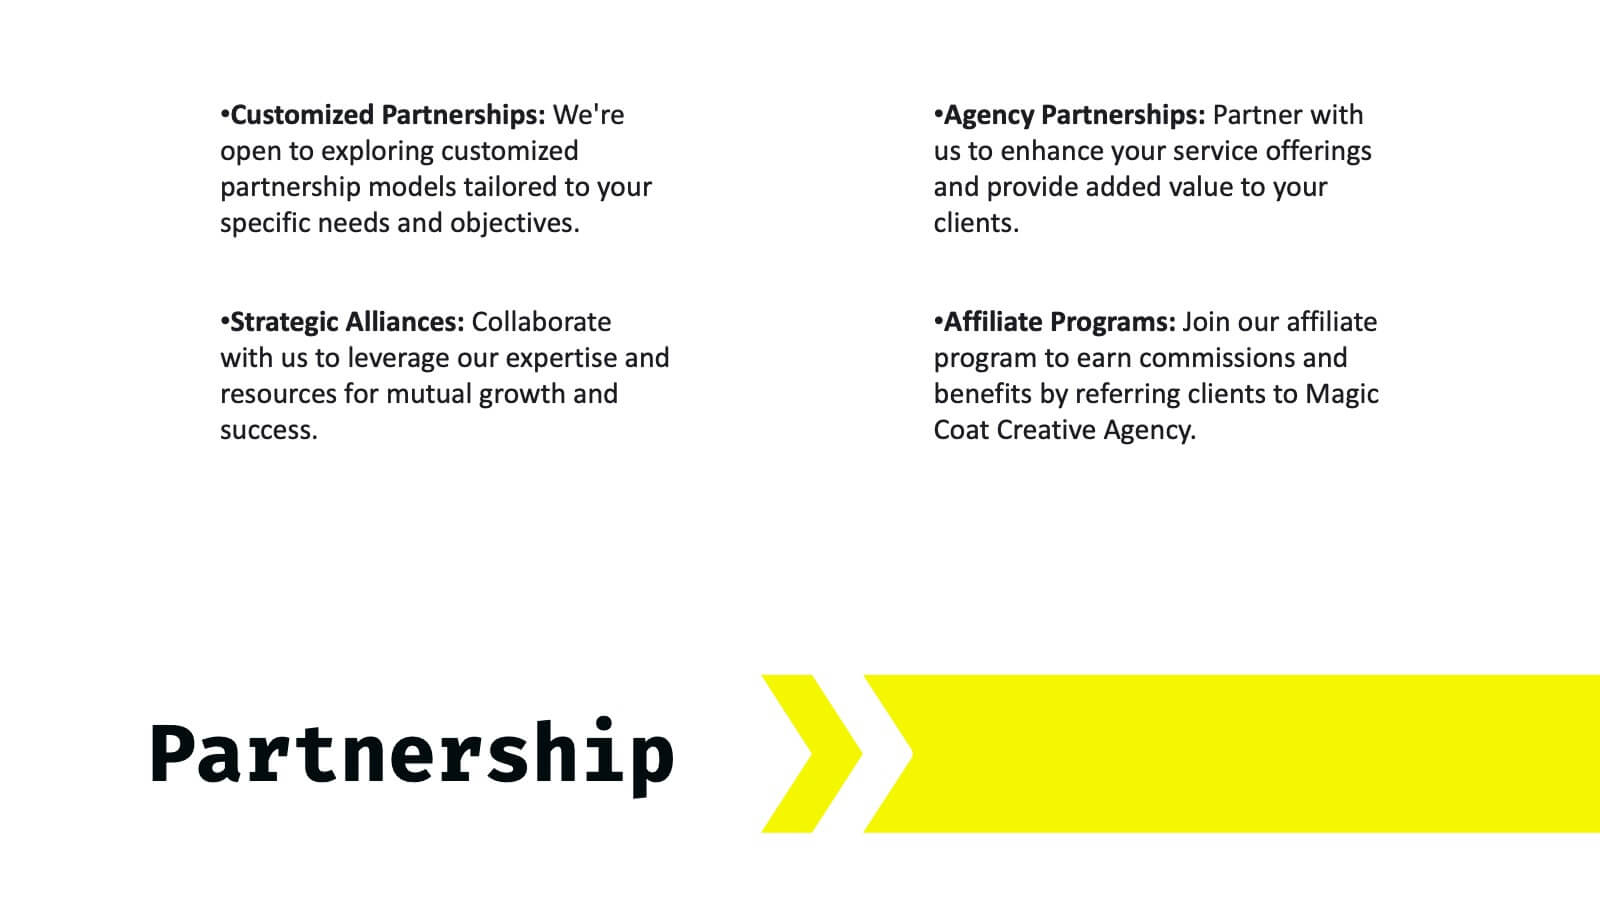
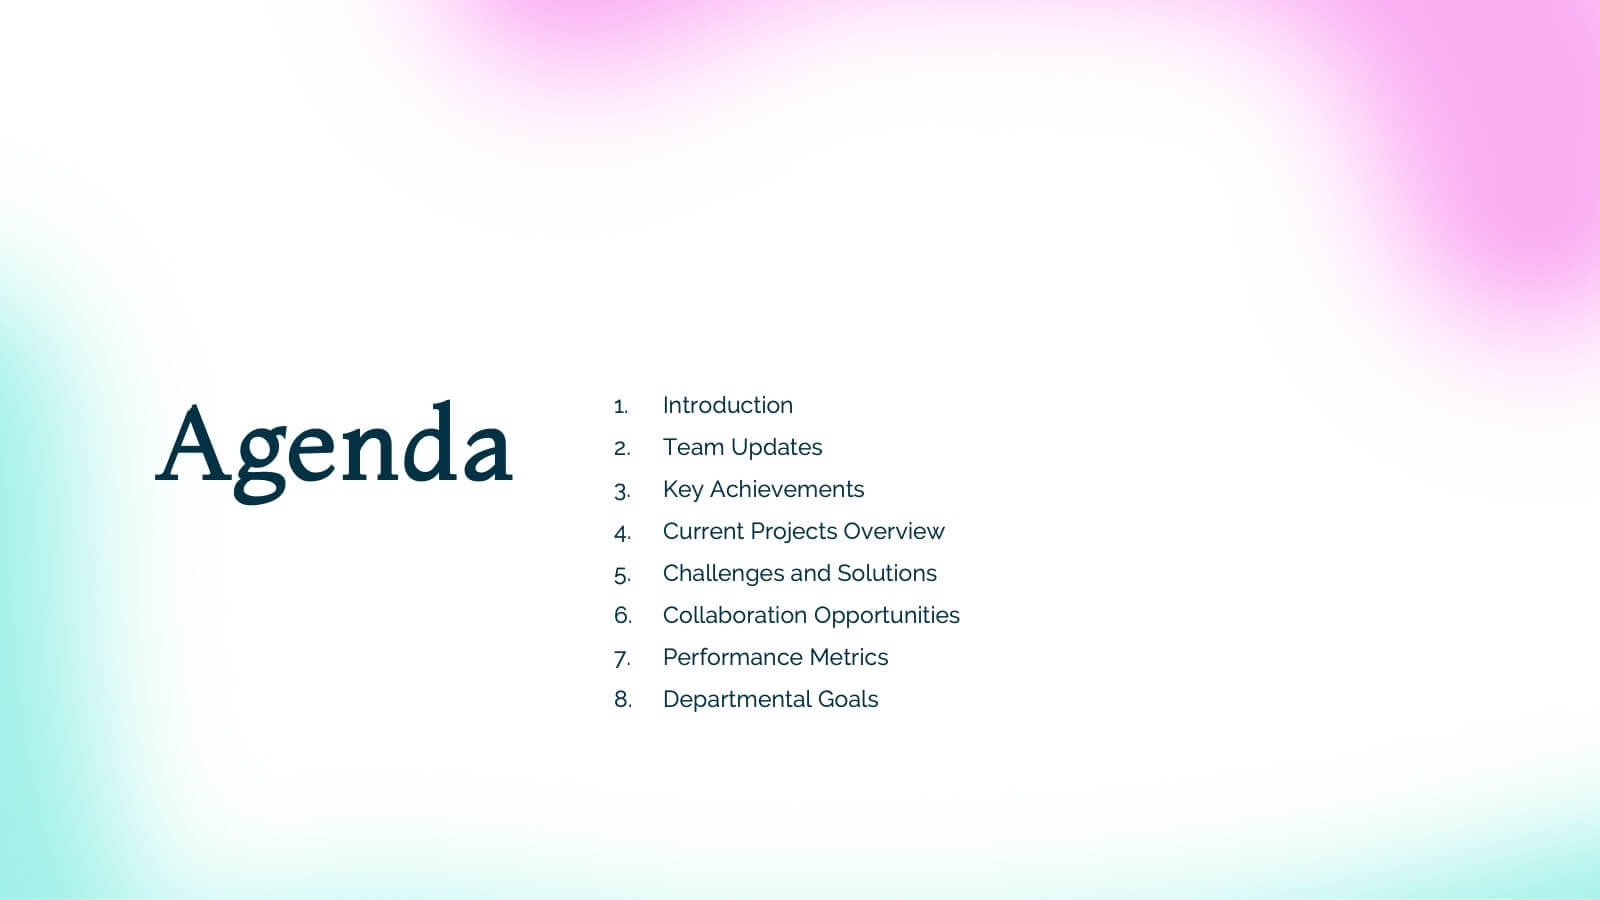
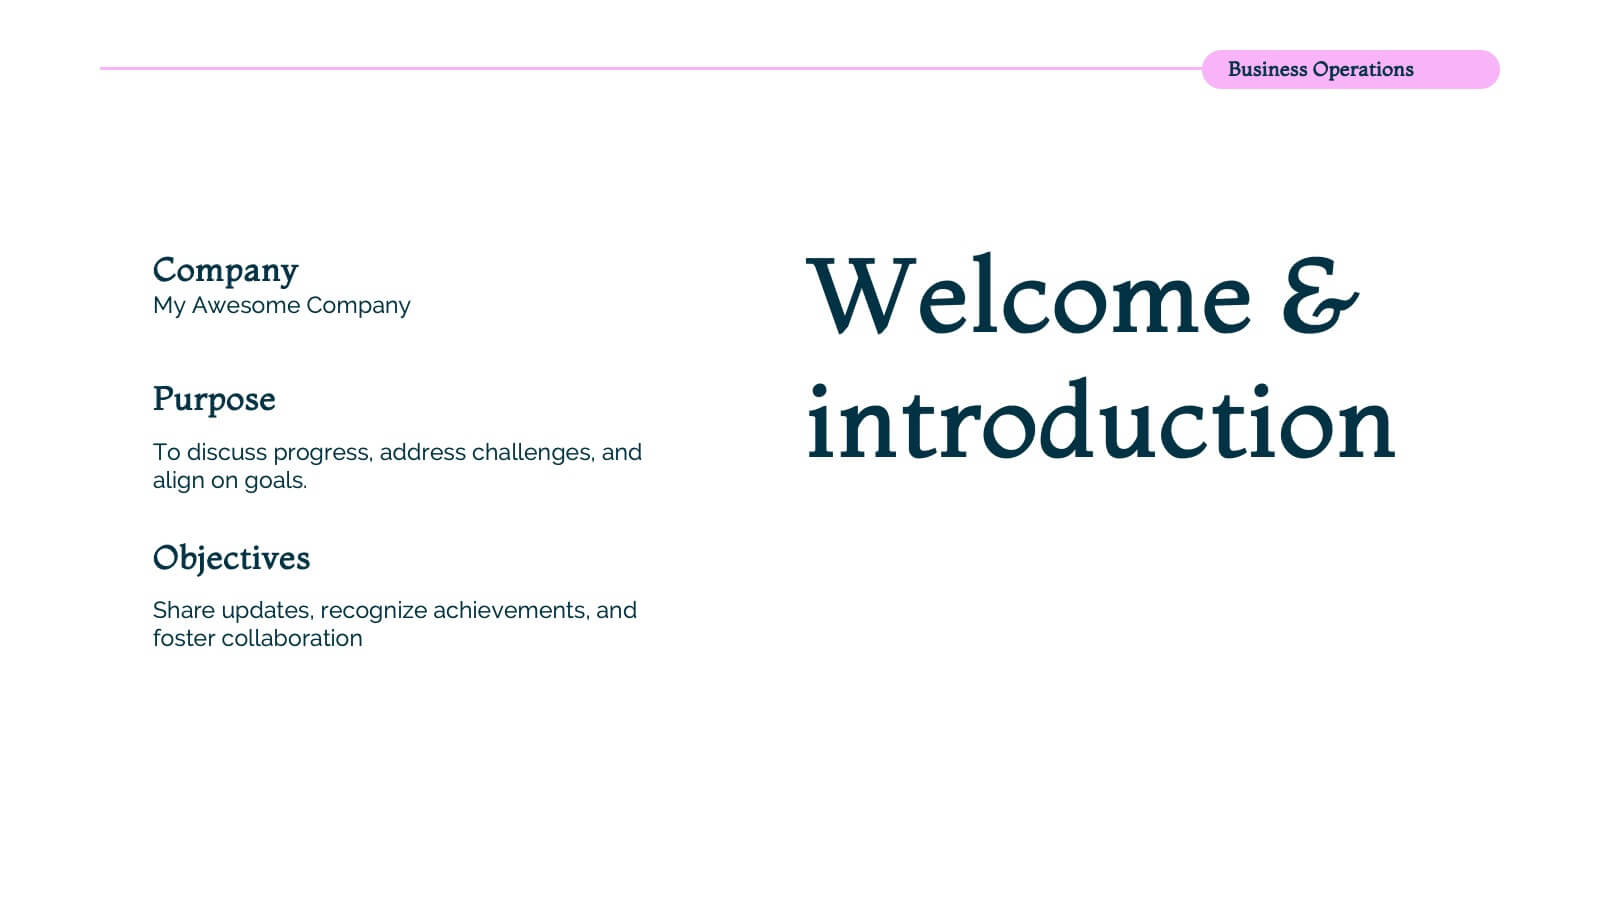
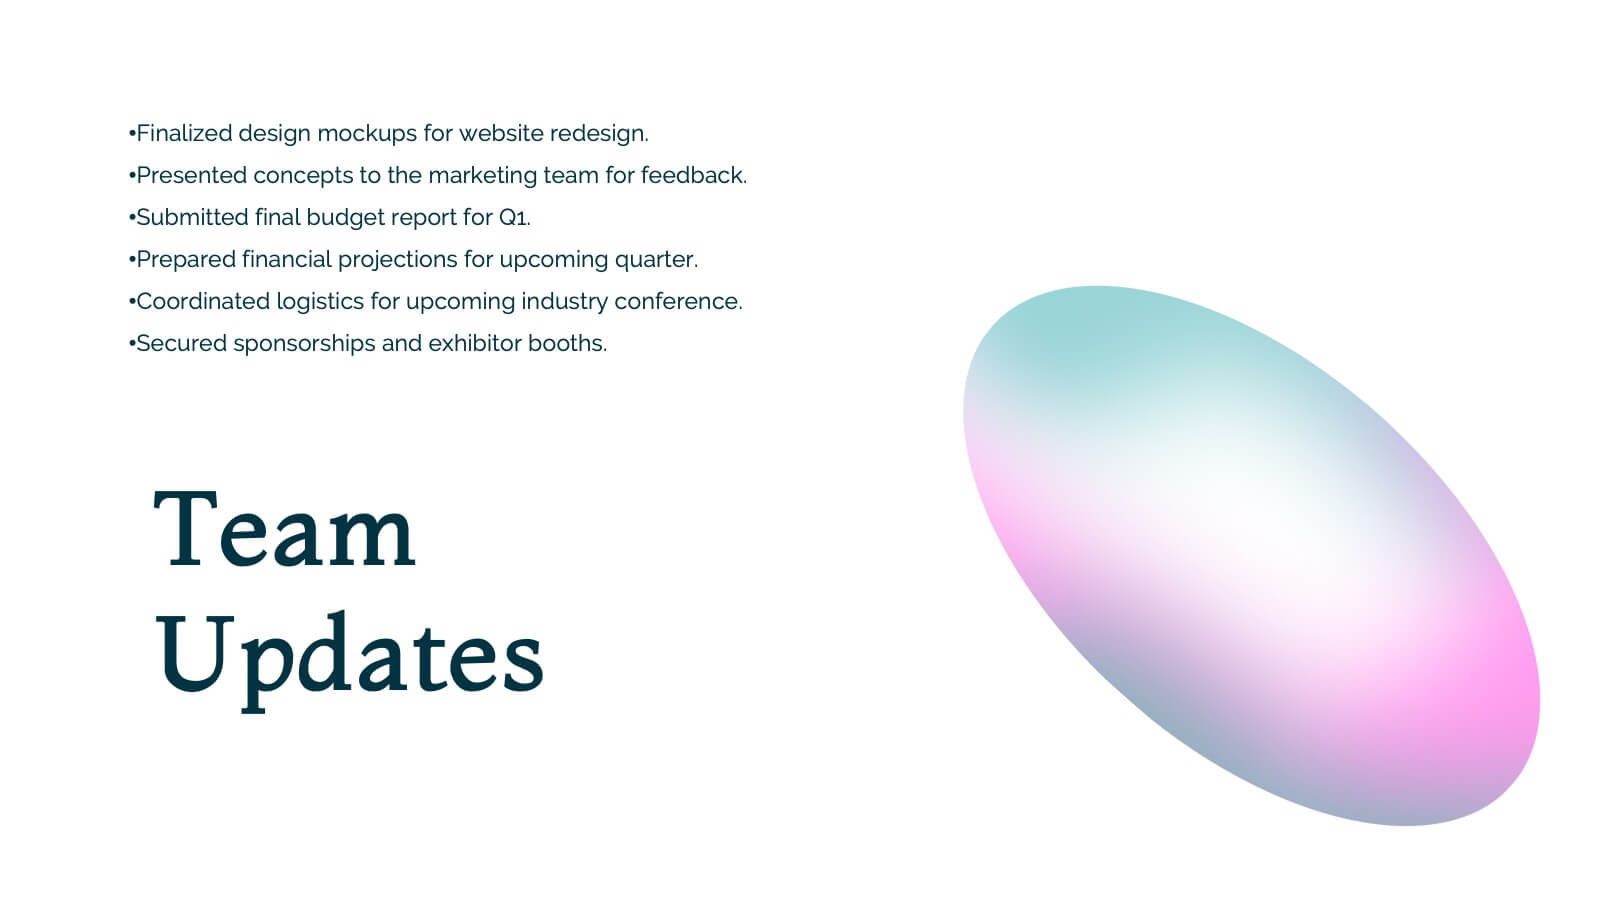
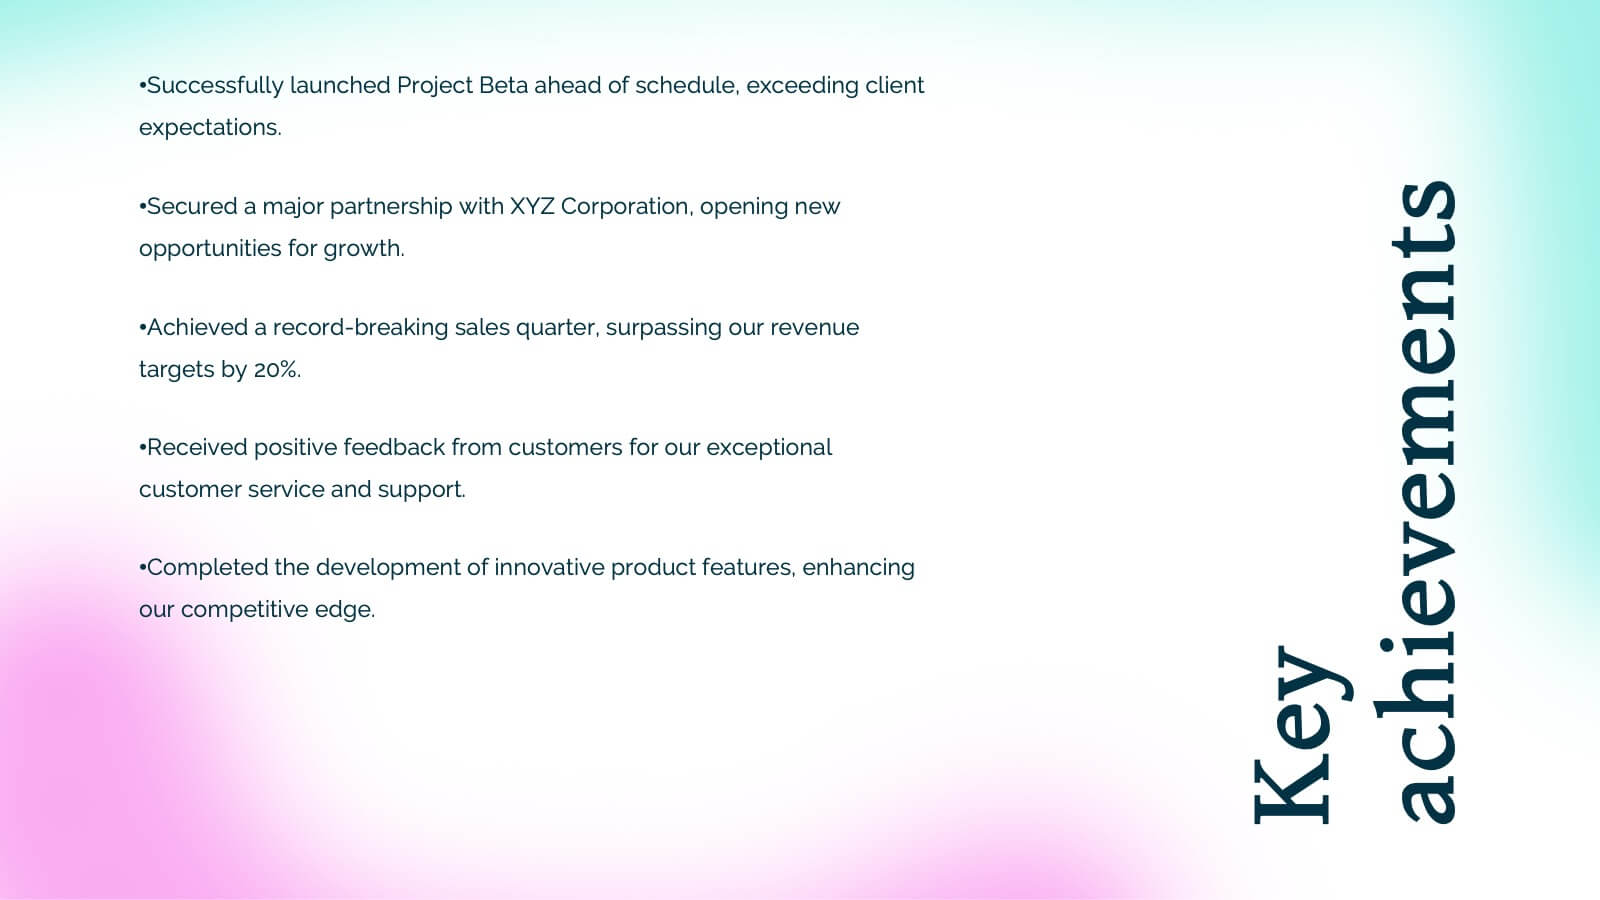
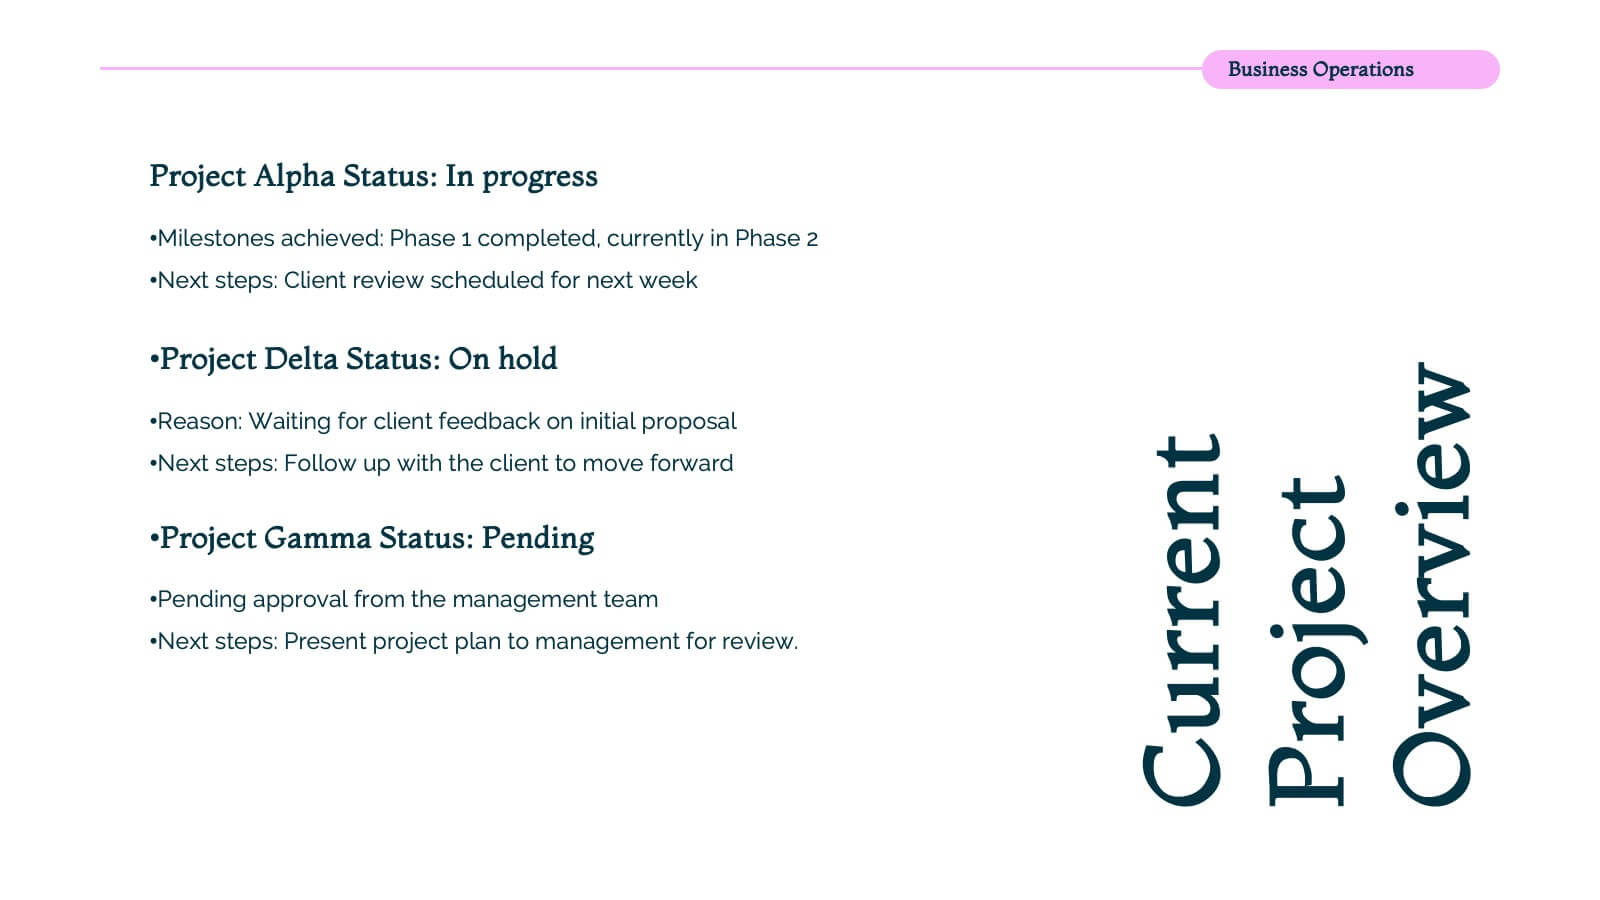
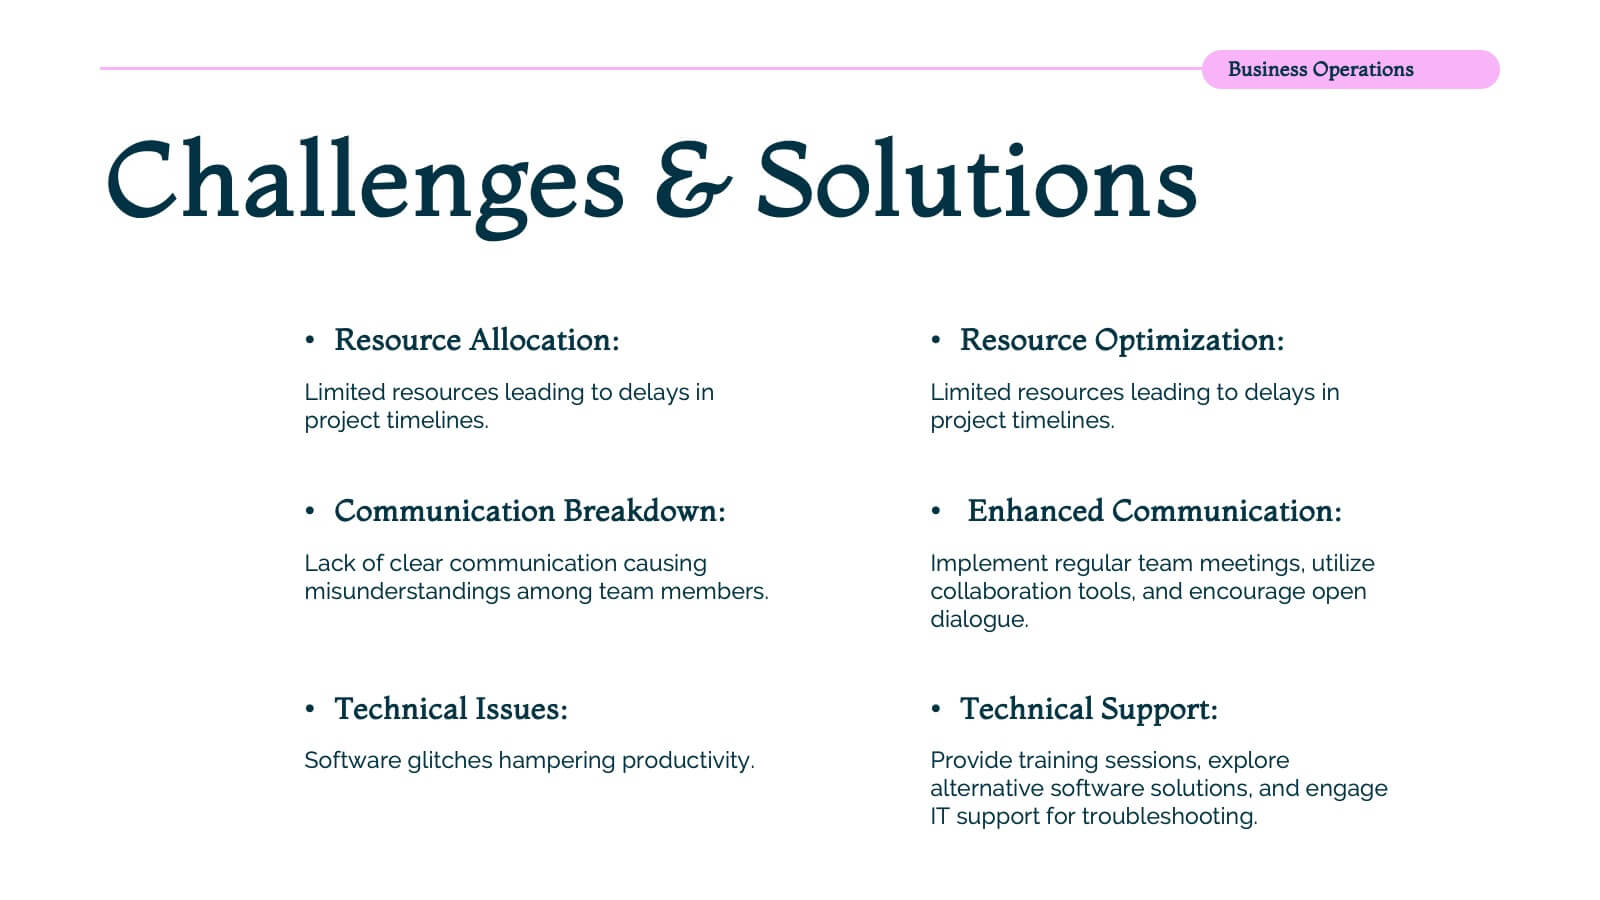
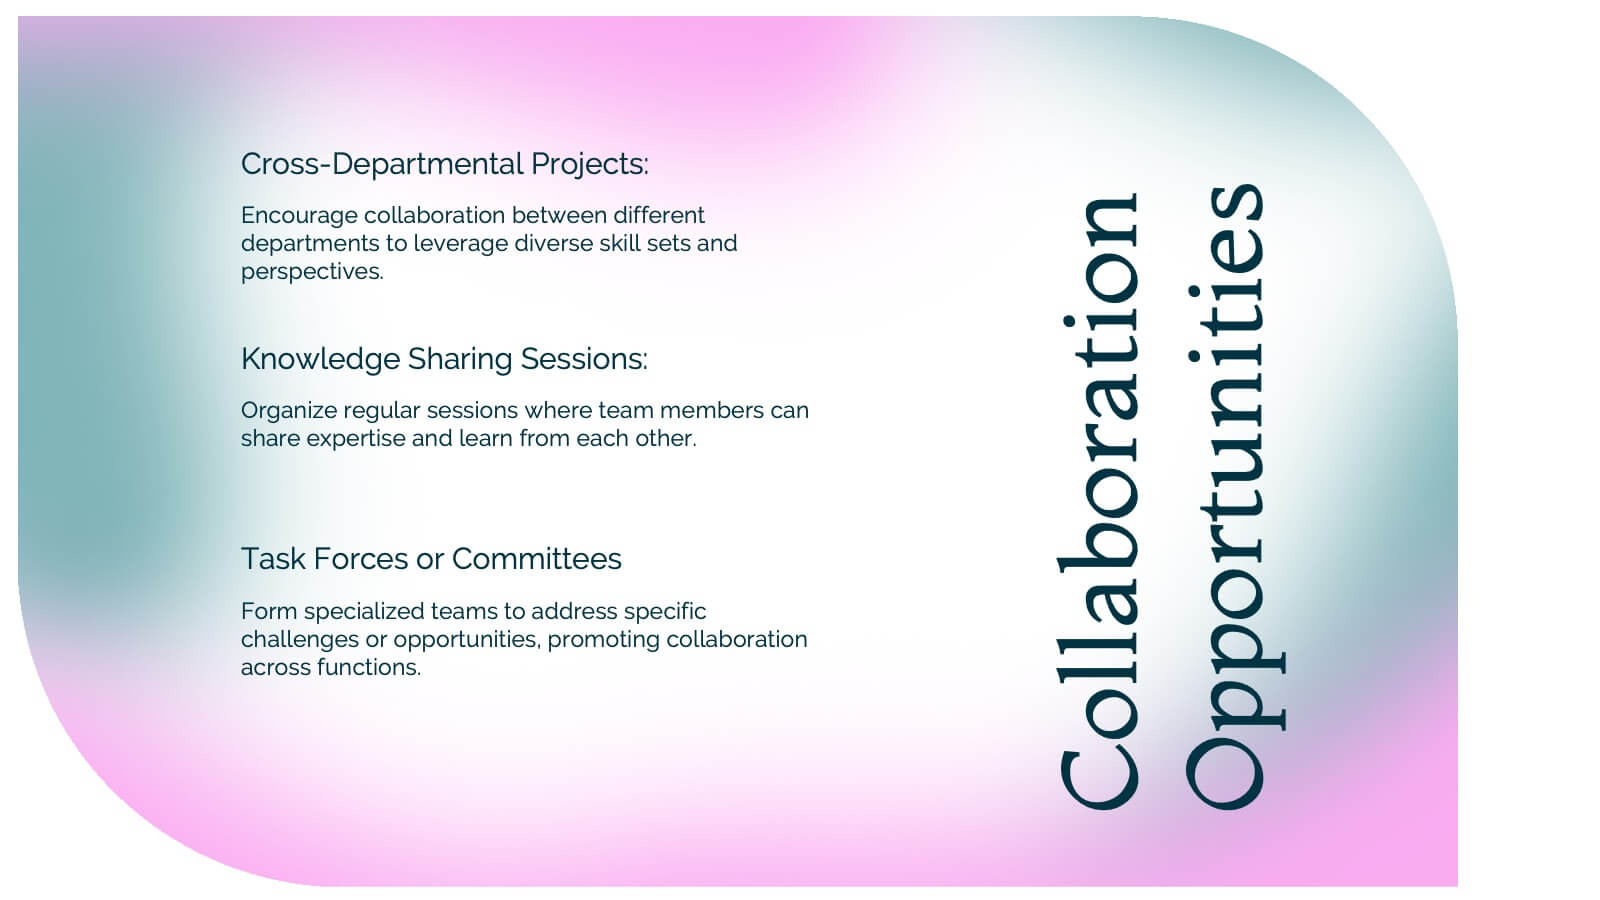
Nova Business Operations Plan Presentation
Create a polished business operations plan with this modern and organized template! It covers everything from team updates and project overviews to resource allocation and collaboration opportunities. Perfect for structuring departmental goals, process improvements, and employee recognition. Compatible with PowerPoint, Keynote, and Google Slides for a seamless, professional presentation.


5 slides
Product Marketing Slide Presentation
Spark interest instantly with a bold, circular layout that transforms product insights into a clean, memorable story. This presentation helps you explain features, audience needs, and value propositions in an organized, visual flow that keeps attention on what matters most. Fully customizable for PowerPoint, Keynote, and Google Slides.


21 slides
Sapphire Graphic Design Project Plan Presentation
Make your next project plan sparkle with this sleek, sapphire-inspired presentation design! This template is perfect for showcasing your graphic design project, helping you organize key milestones, timelines, and objectives. With its modern layout and clean aesthetics, your ideas will stand out beautifully. Compatible with PowerPoint, Keynote, and Google Slides.


26 slides
Creative Cryptocurrency Investment Presentation
The growth of Cryptocurrency has been significant over the past few years. It is very important to do your own research, understand the risks involved, and only invest what you can afford to lose. This template is designed with a focus on cryptocurrencies and includes customizable photo layouts, charts, a gold coin pattern and unique cryptocurrency-themed icons and illustrations. You can use this template for any topic related to Cryptocurrency or Blockchain. Create your own presentation within minutes using Powerpoint, Keynote, or Google slides, it is fully editable to suit your needs.


4 slides
Construction Project Planning
Streamline your workflow and improve clarity with this vibrant project planning wheel designed for construction professionals. This slide helps visualize key phases—such as planning, team coordination, and logistics—using color-coded segments and editable icons. Perfect for architects, contractors, and project managers. Fully customizable in PowerPoint, Keynote, and Google Slides.


4 slides
Product Life Cycle Stages Explained Presentation
Turn complex business growth phases into a clear visual journey with this clean, modern layout. Ideal for explaining product development, marketing strategies, or performance tracking, it helps you communicate each stage with precision and style. Fully editable and compatible with PowerPoint, Keynote, and Google Slides for seamless customization.


5 slides
Core to Outer Ring Concentric Planning Presentation
Present your strategy from the inside out with the Core to Outer Ring Concentric Planning Presentation. This layered, radial design guides viewers through a central concept outward into supporting elements—ideal for planning, process modeling, or decision frameworks. Fully customizable in PowerPoint, Keynote, and Google Slides.


22 slides
Prism Project Status Report Presentation
Deliver impactful updates with this comprehensive project status report template! Perfect for presenting key highlights, performance metrics, and strategic initiatives. Ideal for project managers aiming to keep stakeholders informed and aligned. Compatible with PowerPoint, Keynote, and Google Slides, this template ensures your reports are clear, professional, and engaging. Keep projects on track!


7 slides
PESTEL Framework for External Analysis Presentation
Evaluate external factors with ease using the PESTEL Framework for External Analysis Presentation. This structured layout helps you assess Political, Economic, Social, Technological, Environmental, and Legal influences on your business. Perfect for market research, risk assessment, and strategic planning. Fully customizable in PowerPoint, Canva, and Google Slides.
7 slides
Arrow Process Flow Presentation
Illustrate step-by-step processes with the Arrow Process Flow Presentation. This dynamic template visually maps out sequential steps, making it ideal for workflow diagrams, business strategies, and project planning. Customize colors, text, and icons to align with your brand. Compatible with PowerPoint, Keynote, and Google Slides for effortless editing.


6 slides
Corporate Sustainability Management Presentation
Step into the future of business with our Corporate Sustainability Management Presentation template. Perfect for strategists seeking to integrate eco-friendly practices, this template facilitates effective communication of sustainability goals and initiatives. It’s a powerful tool for illustrating how environmental strategies can be interwoven with business objectives to foster long-term growth. Tailored for presentations on PowerPoint, Keynote, and Google Slides, it helps leaders inspire action and commitment to sustainability across their organizations.


21 slides
Kinetic Startup Funding Proposal Presentation
Get ready to impress potential investors with the Kinetic Startup Funding Proposal template! This dynamic and modern template is designed to help you present your startup's vision, mission, and growth potential in the most compelling way possible. From introducing your team and services to highlighting your unique value proposition and business model, every slide is crafted to showcase your startup's strengths. The template includes sections for market analysis, customer needs, and pain points, ensuring your presentation is data-driven and focused on solving real problems. With slides dedicated to your marketing strategy, sales channels, and financial overview, you can provide a comprehensive plan for success. The sleek design, combined with easy-to-edit slides, allows you to customize the presentation to reflect your startup's brand identity. Whether you're pitching to angel investors or venture capitalists, the Kinetic Startup Funding Proposal template will help you stand out and secure the funding you need. Compatible with PowerPoint, Keynote, and Google Slides, this template is your key to delivering a winning pitch.


22 slides
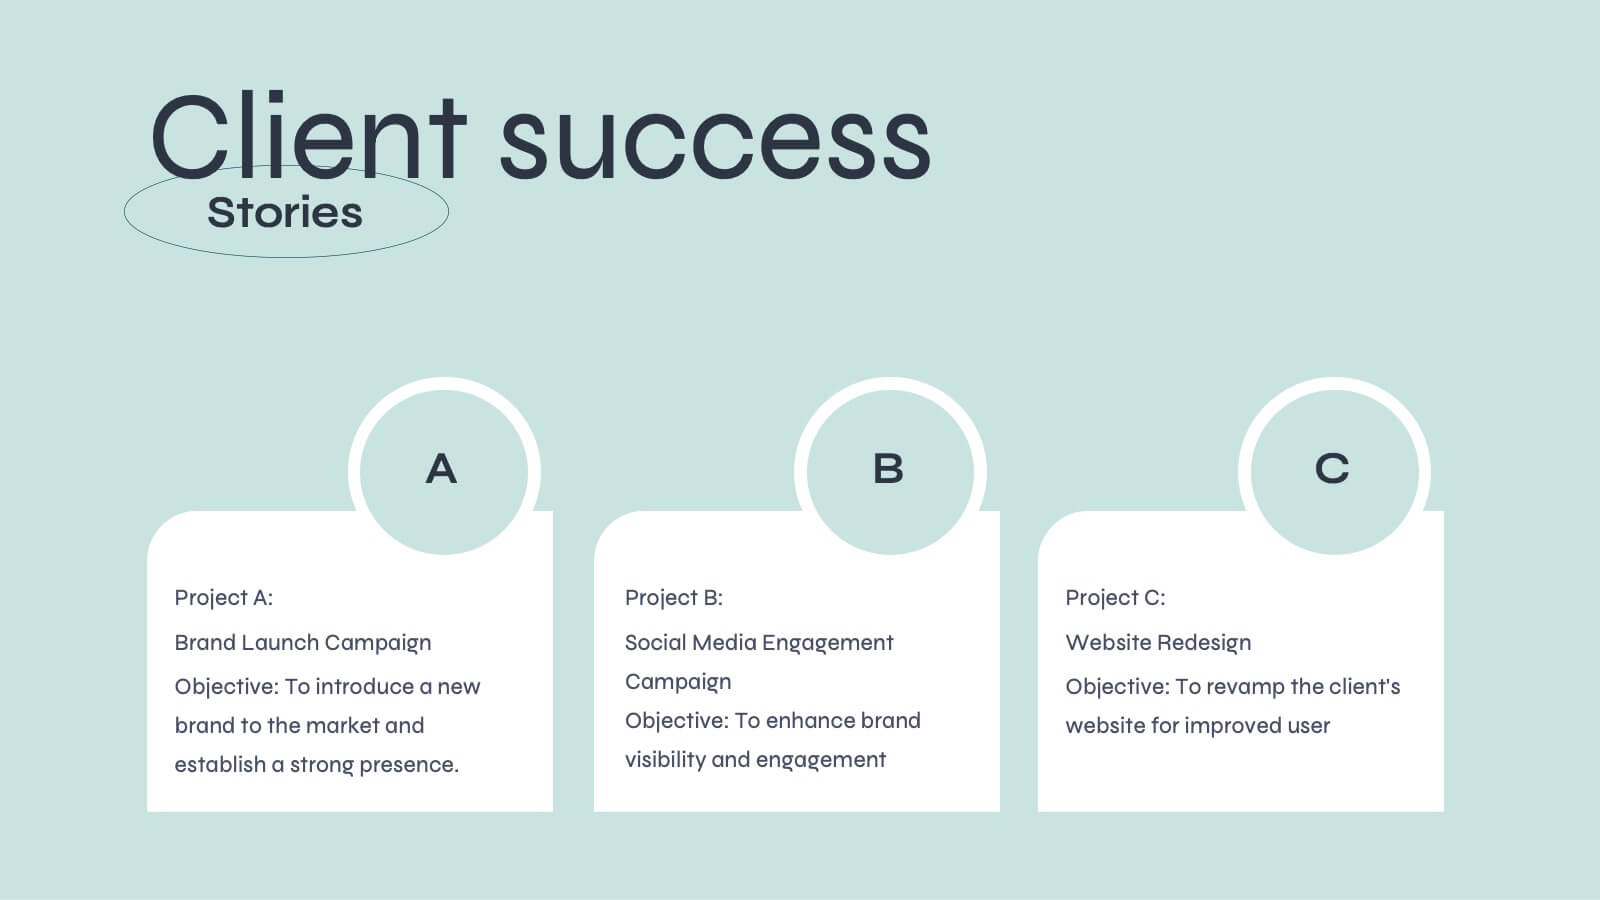
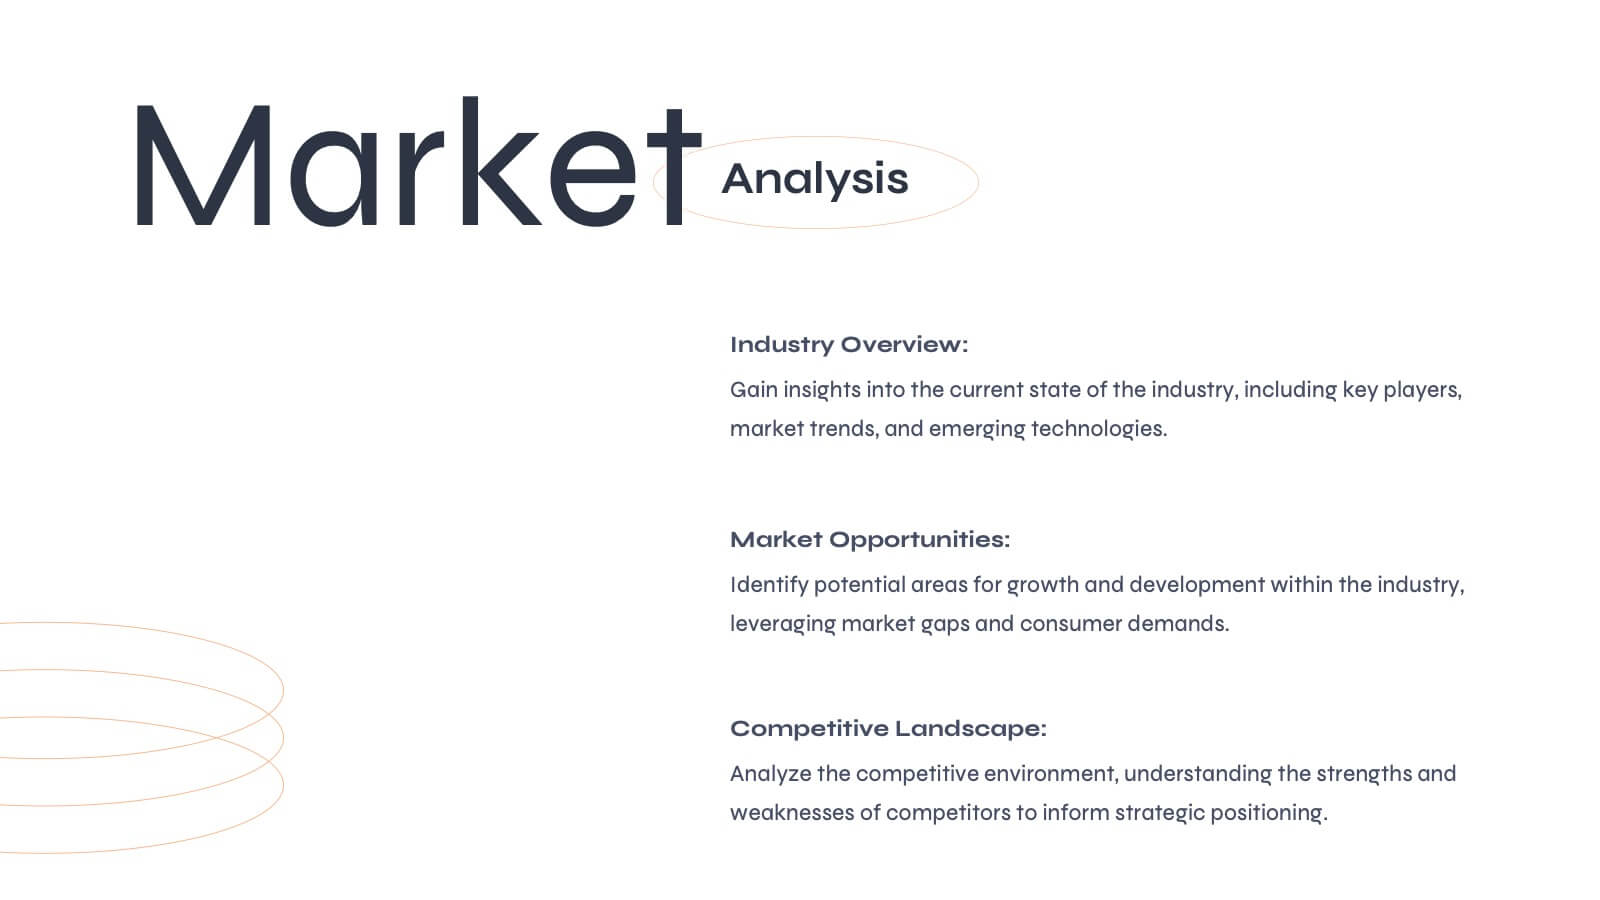
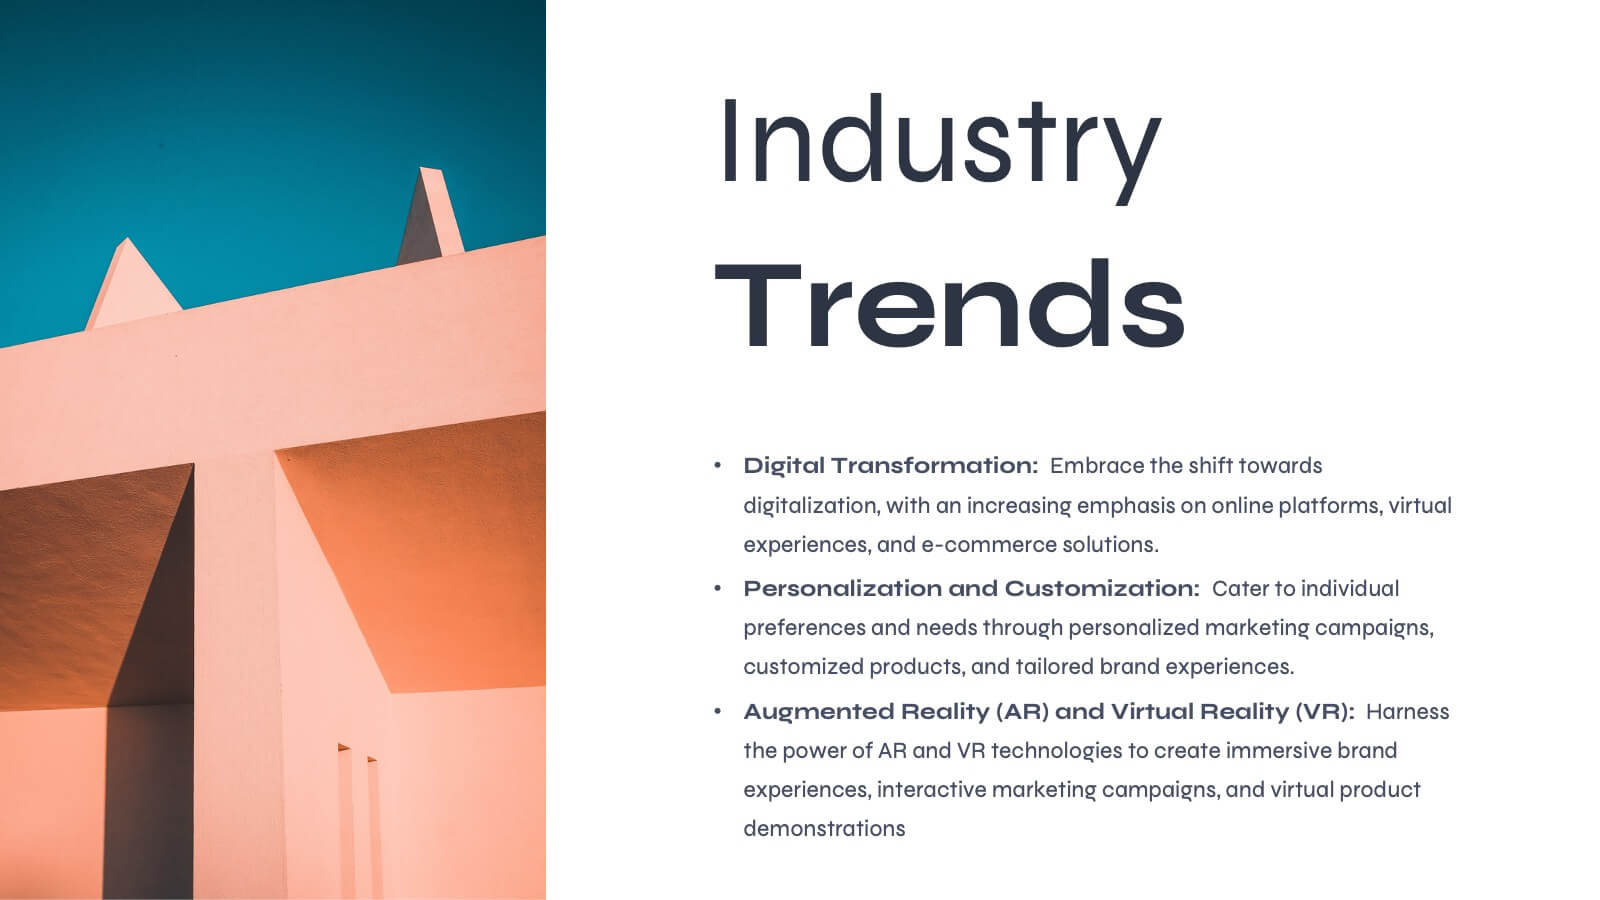
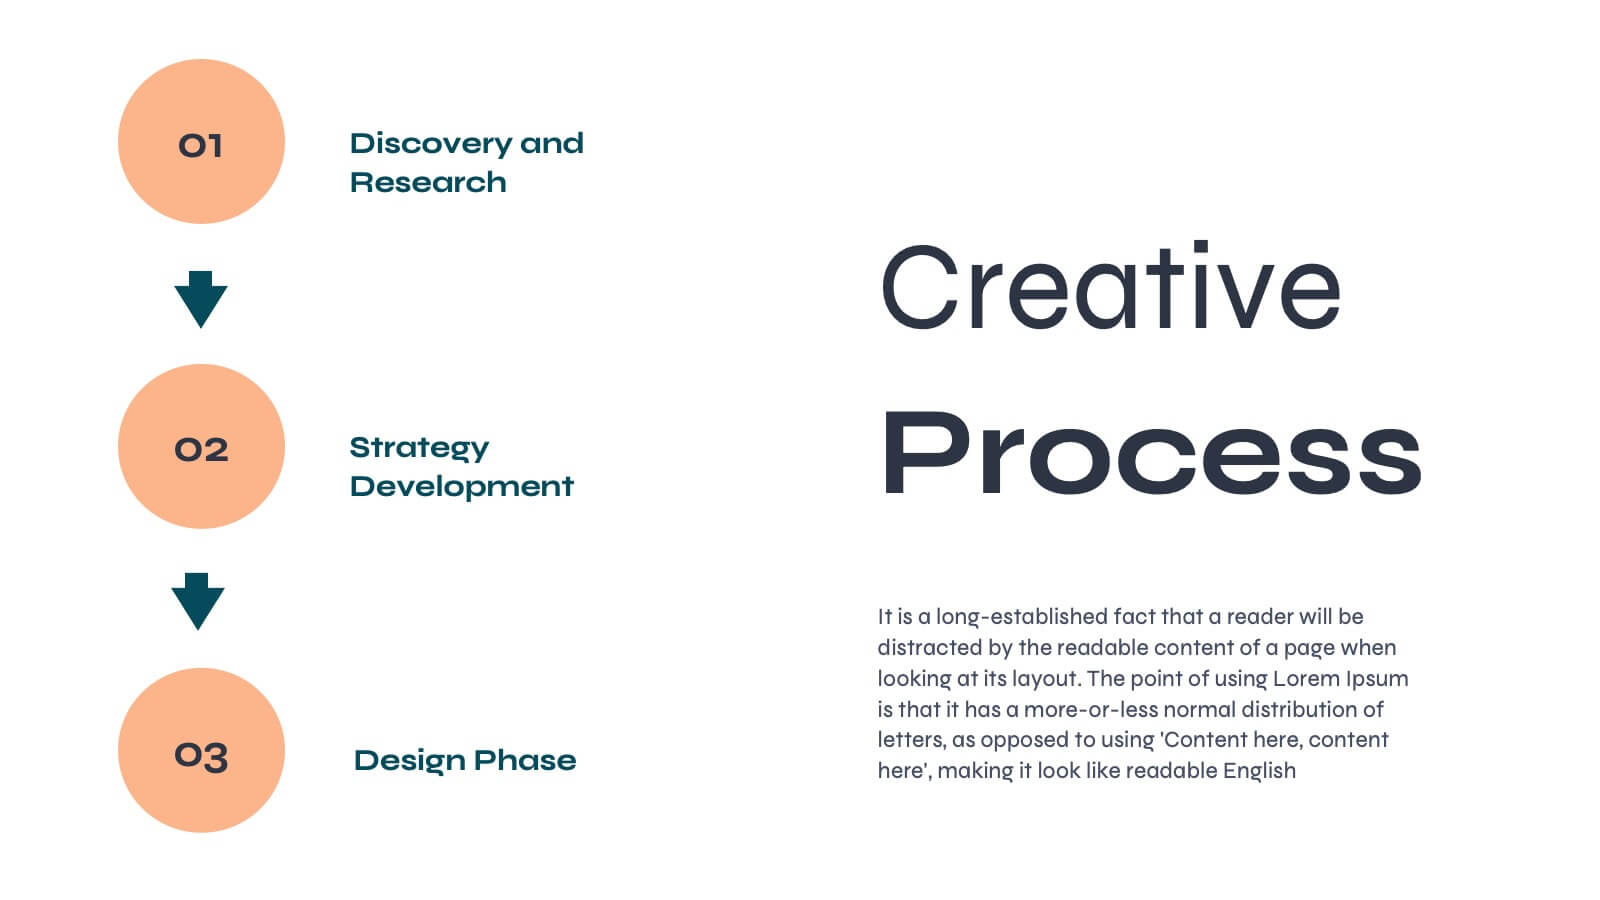
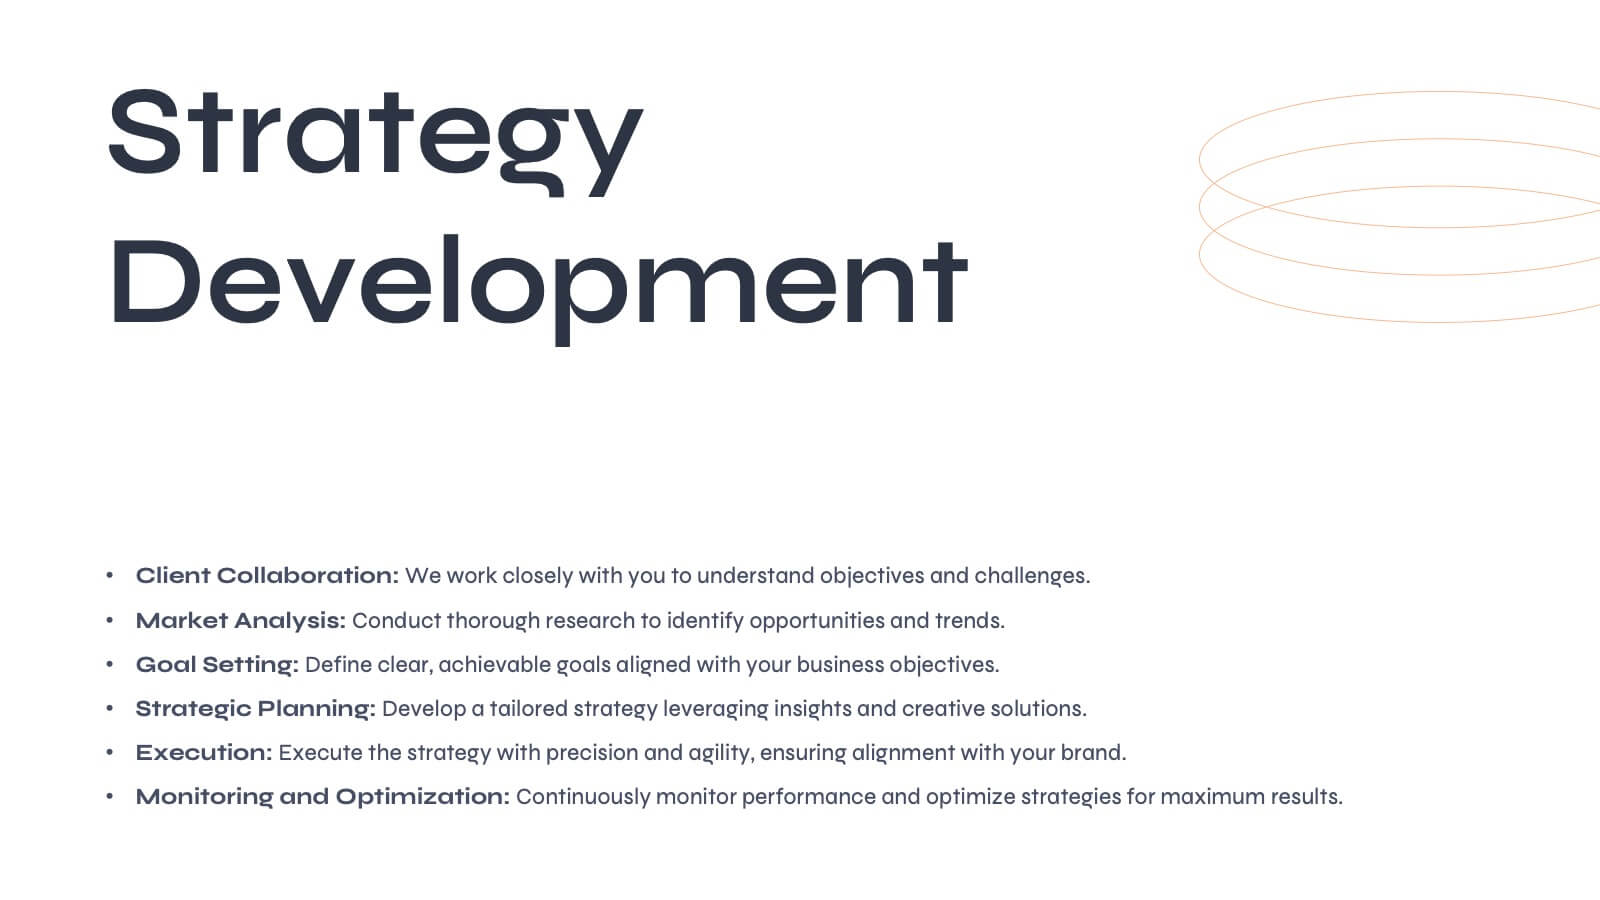
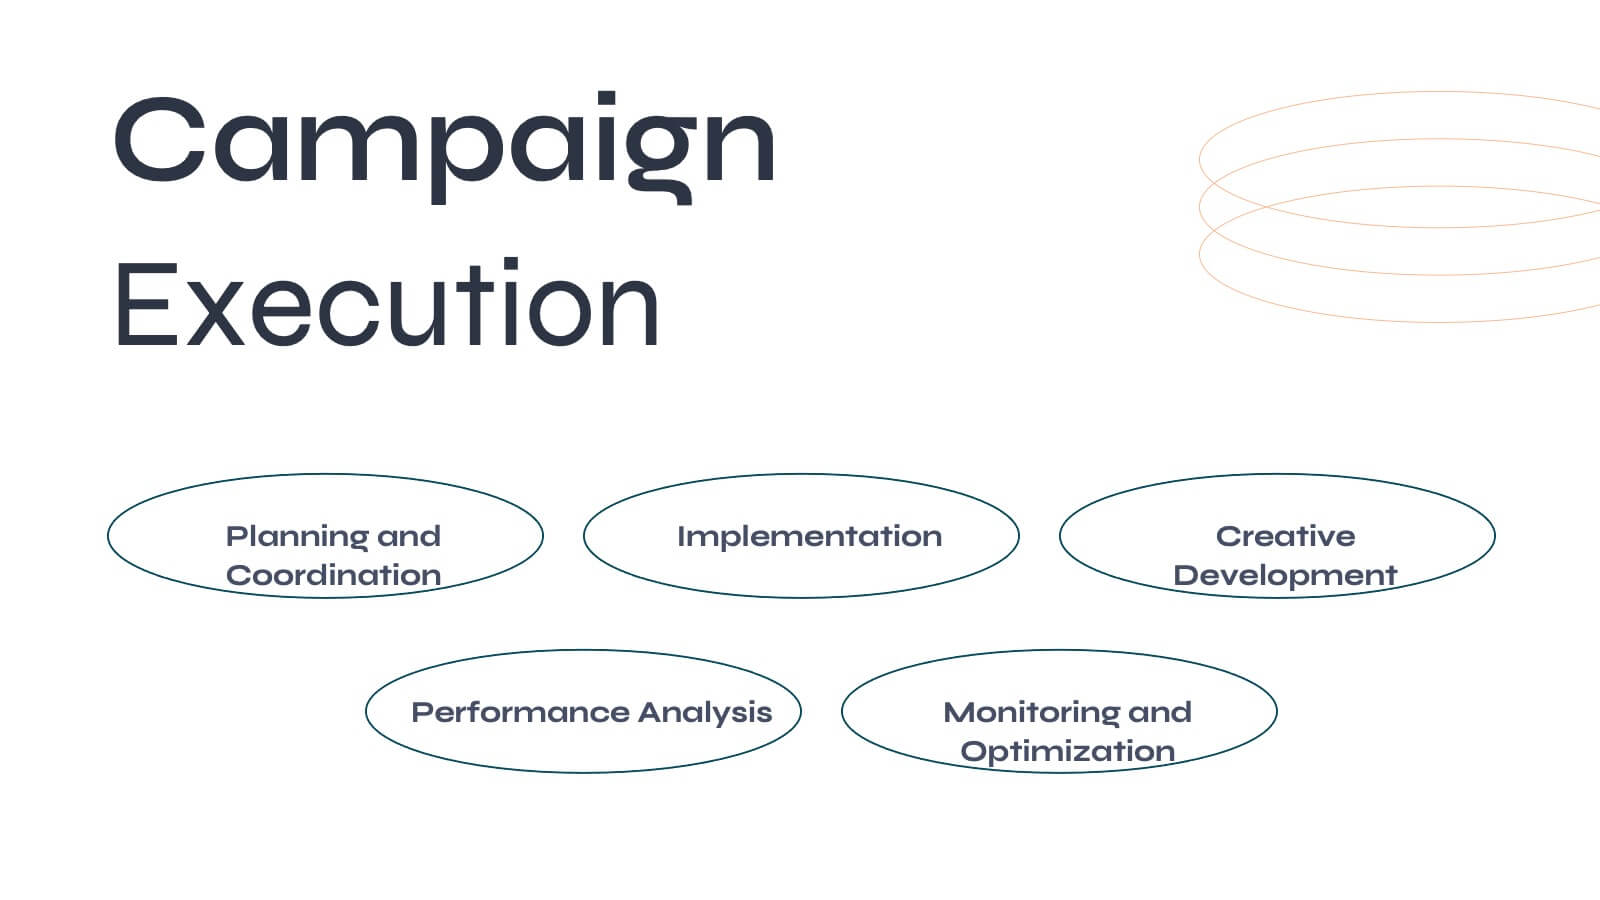
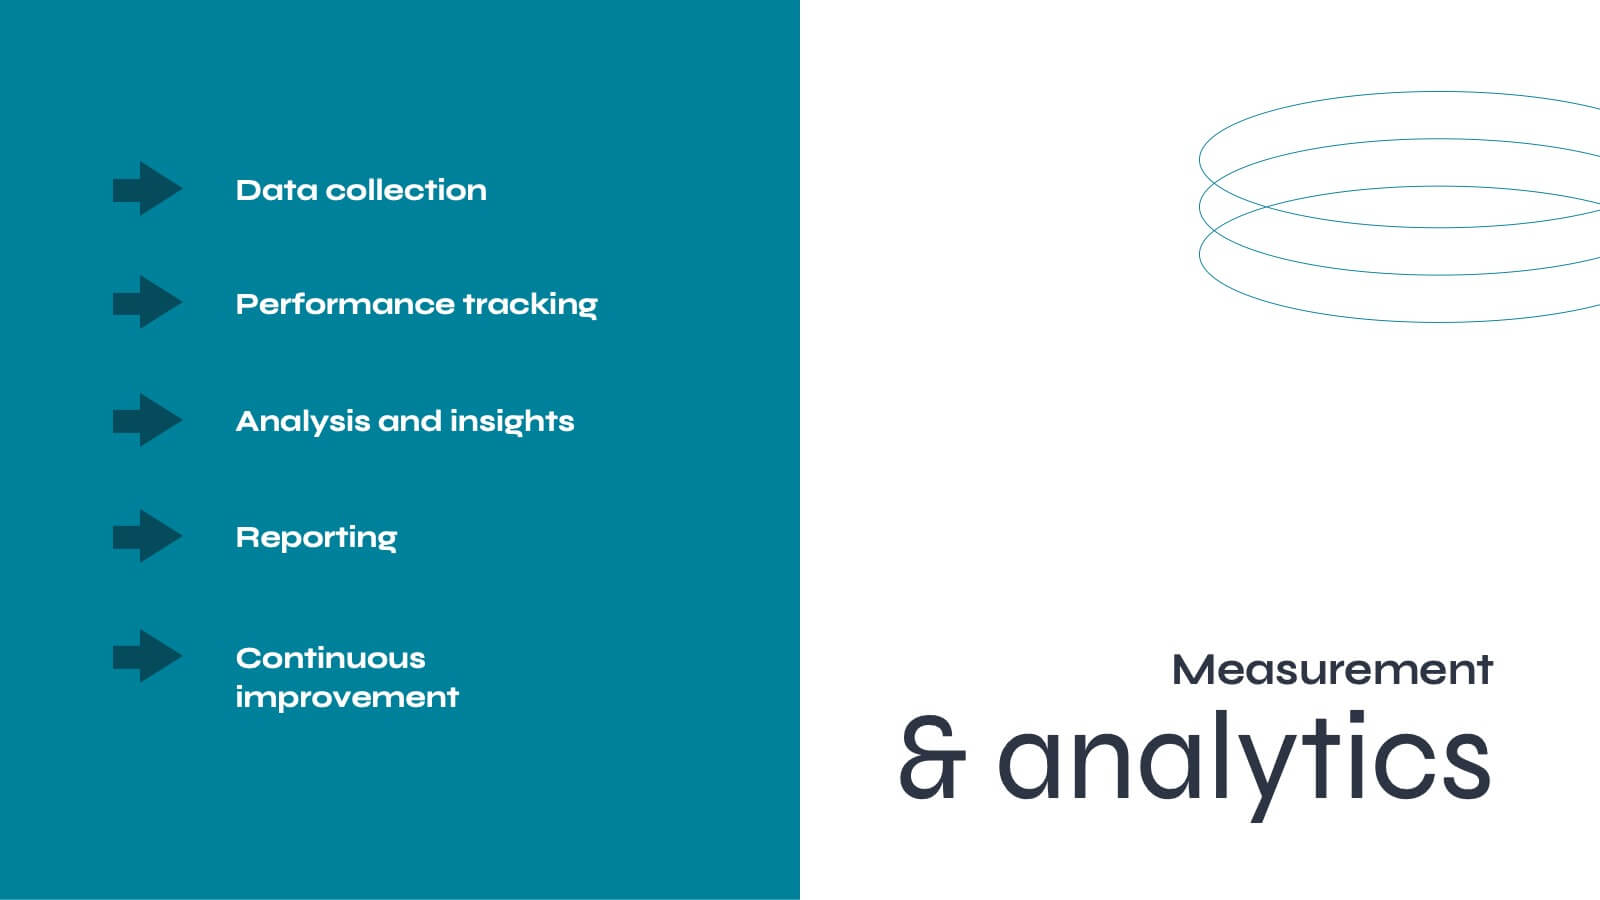
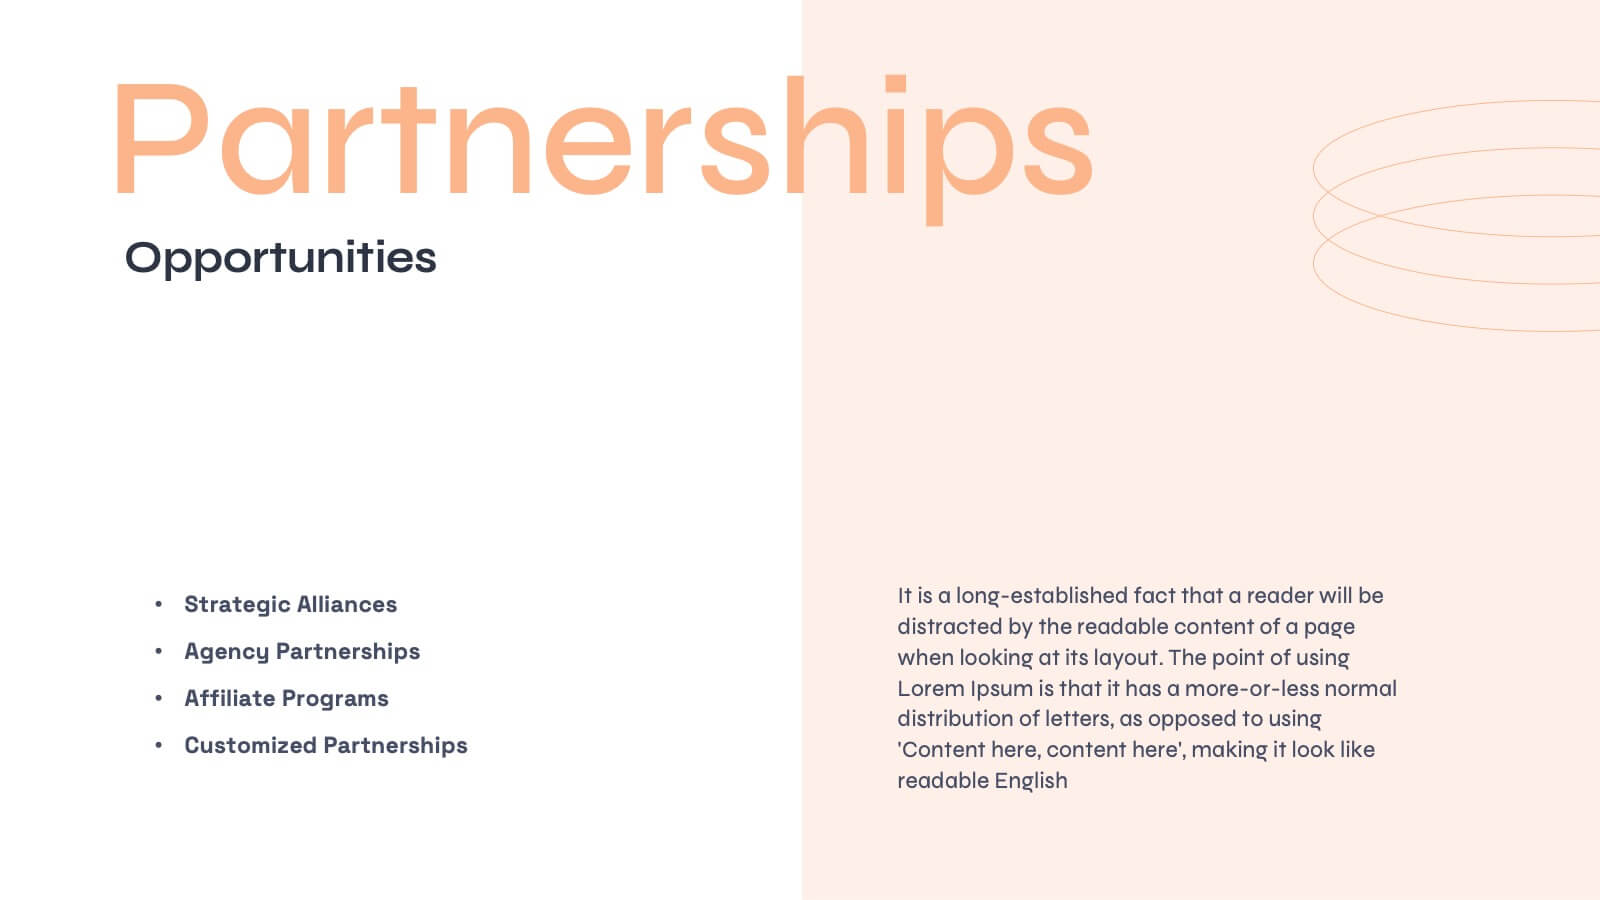
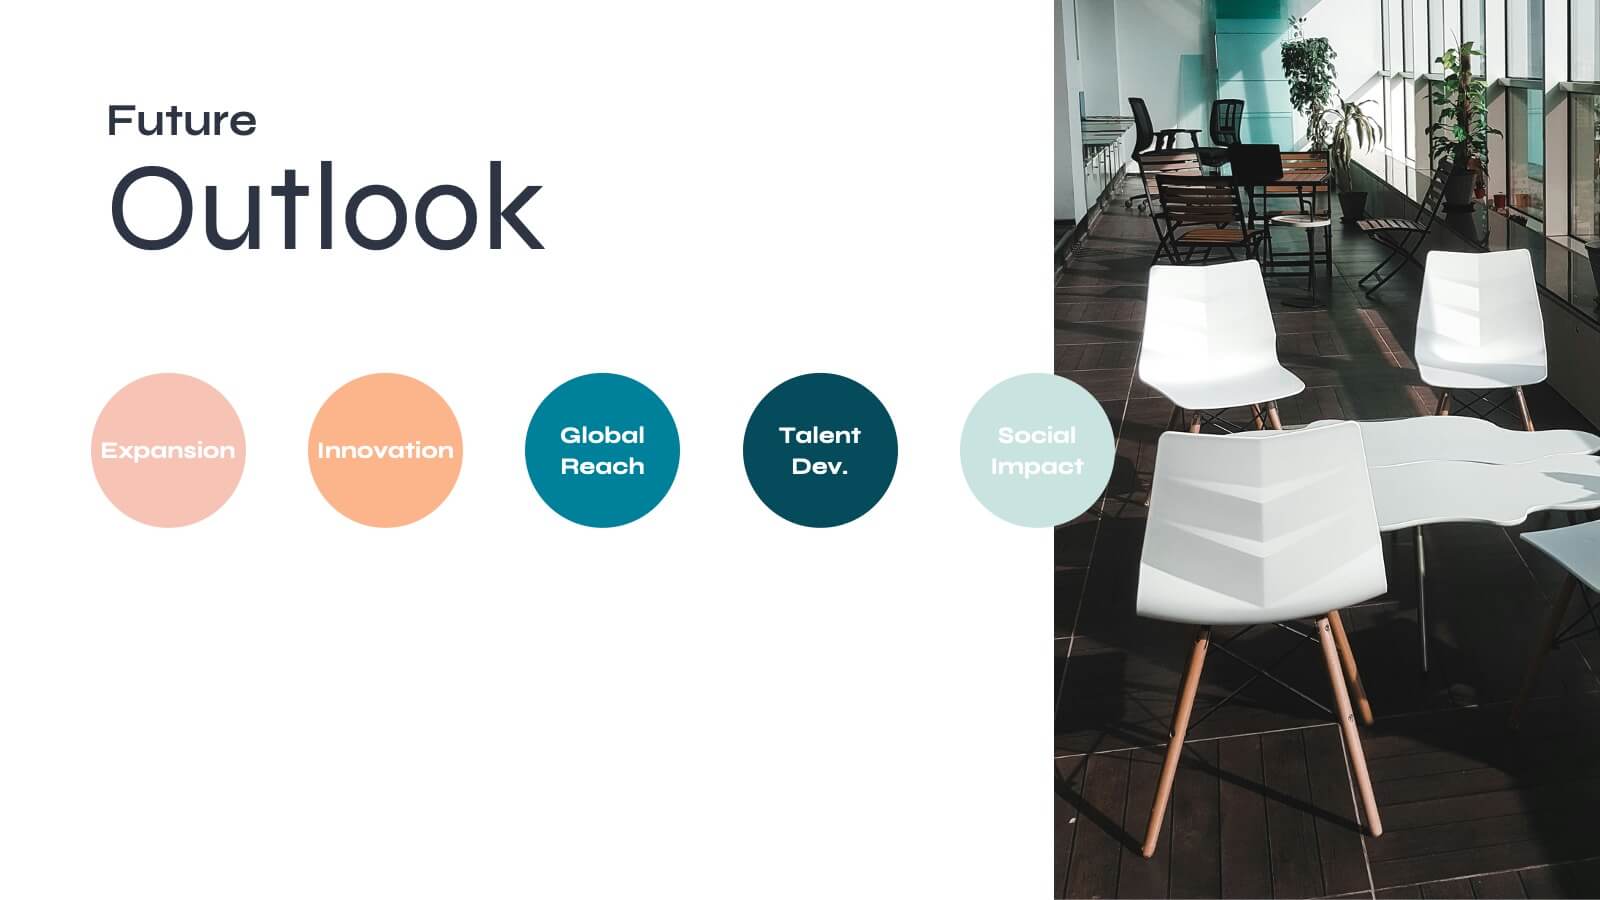
Aurora Agency Portfolio Presentation
Showcase your agency's strengths with this polished, modern presentation template. Perfect for presenting market analysis, client success stories, and creative processes, it features a clean and professional design. Highlight your team's expertise and strategic approach to impress potential clients. Compatible with PowerPoint, Keynote, and Google Slides, it ensures seamless presentations on any platform.


6 slides
Business Model Hexagon Infographic Presentation
Break down complex strategies with the Business Model Hexagon Infographic Presentation. This sleek, six-part hexagonal layout is perfect for illustrating interconnected components like operations, value propositions, and customer segments. Fully editable and easy to customize in PowerPoint, Keynote, or Google Slides—ideal for startups, consultants, and corporate teams.