


Features
- 20 Unique Slides
- Fully editable and easy to edit in Microsoft Powerpoint, Keynote and Google Slides
- 16:9 widescreen layout
- Clean and professional designs
- Export to JPG, PDF or send by email


Do you have any questions?
Recommend


6 slides
Project Scope and Expansion Scale Presentation
Display growth areas and operational coverage with this segmented radial chart. Ideal for showcasing project reach, departmental impact, or phase distributions, each section includes editable icons and labels. Perfect for strategy updates, expansion pitches, or status reporting. Fully customizable in PowerPoint, Keynote, and Google Slides for professional presentations.


6 slides
2-Option Comparison Chart Presentation
Make your decision-making story pop with a clean, energetic layout that clearly contrasts two paths side by side. This presentation helps you compare options, outline pros and cons, and guide audiences toward confident choices with sharp visual structure. Fully compatible with PowerPoint, Keynote, and Google Slides.


21 slides
Slumbera Product Roadmap Presentation
Plan and showcase your product strategy with this clean and professional template. Cover key aspects such as product overview, target market, competitive analysis, and marketing strategy to align stakeholders and drive success. Fully customizable and compatible with PowerPoint, Keynote, and Google Slides.


4 slides
To-Do Lists and Task Management Presentation
Stay organized and boost productivity with the To-Do Lists and Task Management Presentation. This sleek layout features vertical note-style columns that are perfect for displaying tasks, priorities, or checklists in a structured format. Ideal for project timelines, personal goals, or team deliverables. Each list area includes customizable titles, checkmarks, and space for key points. Fully editable in PowerPoint, Keynote, and Google Slides—perfect for visual task tracking across presentations.


5 slides
Actionable Steps for Team Execution Presentation
Highlight progress and key insights with the Actionable Steps for Team Execution Presentation. This vertically stacked arrow slide uses five colorful blocks ascending upward to represent steps, milestones, or growth metrics. Each step includes space for a title and description to clearly outline tasks or performance trends. Ideal for showcasing team roadmaps, strategic plans, or KPIs. Compatible with PowerPoint, Keynote, and Google Slides.


4 slides
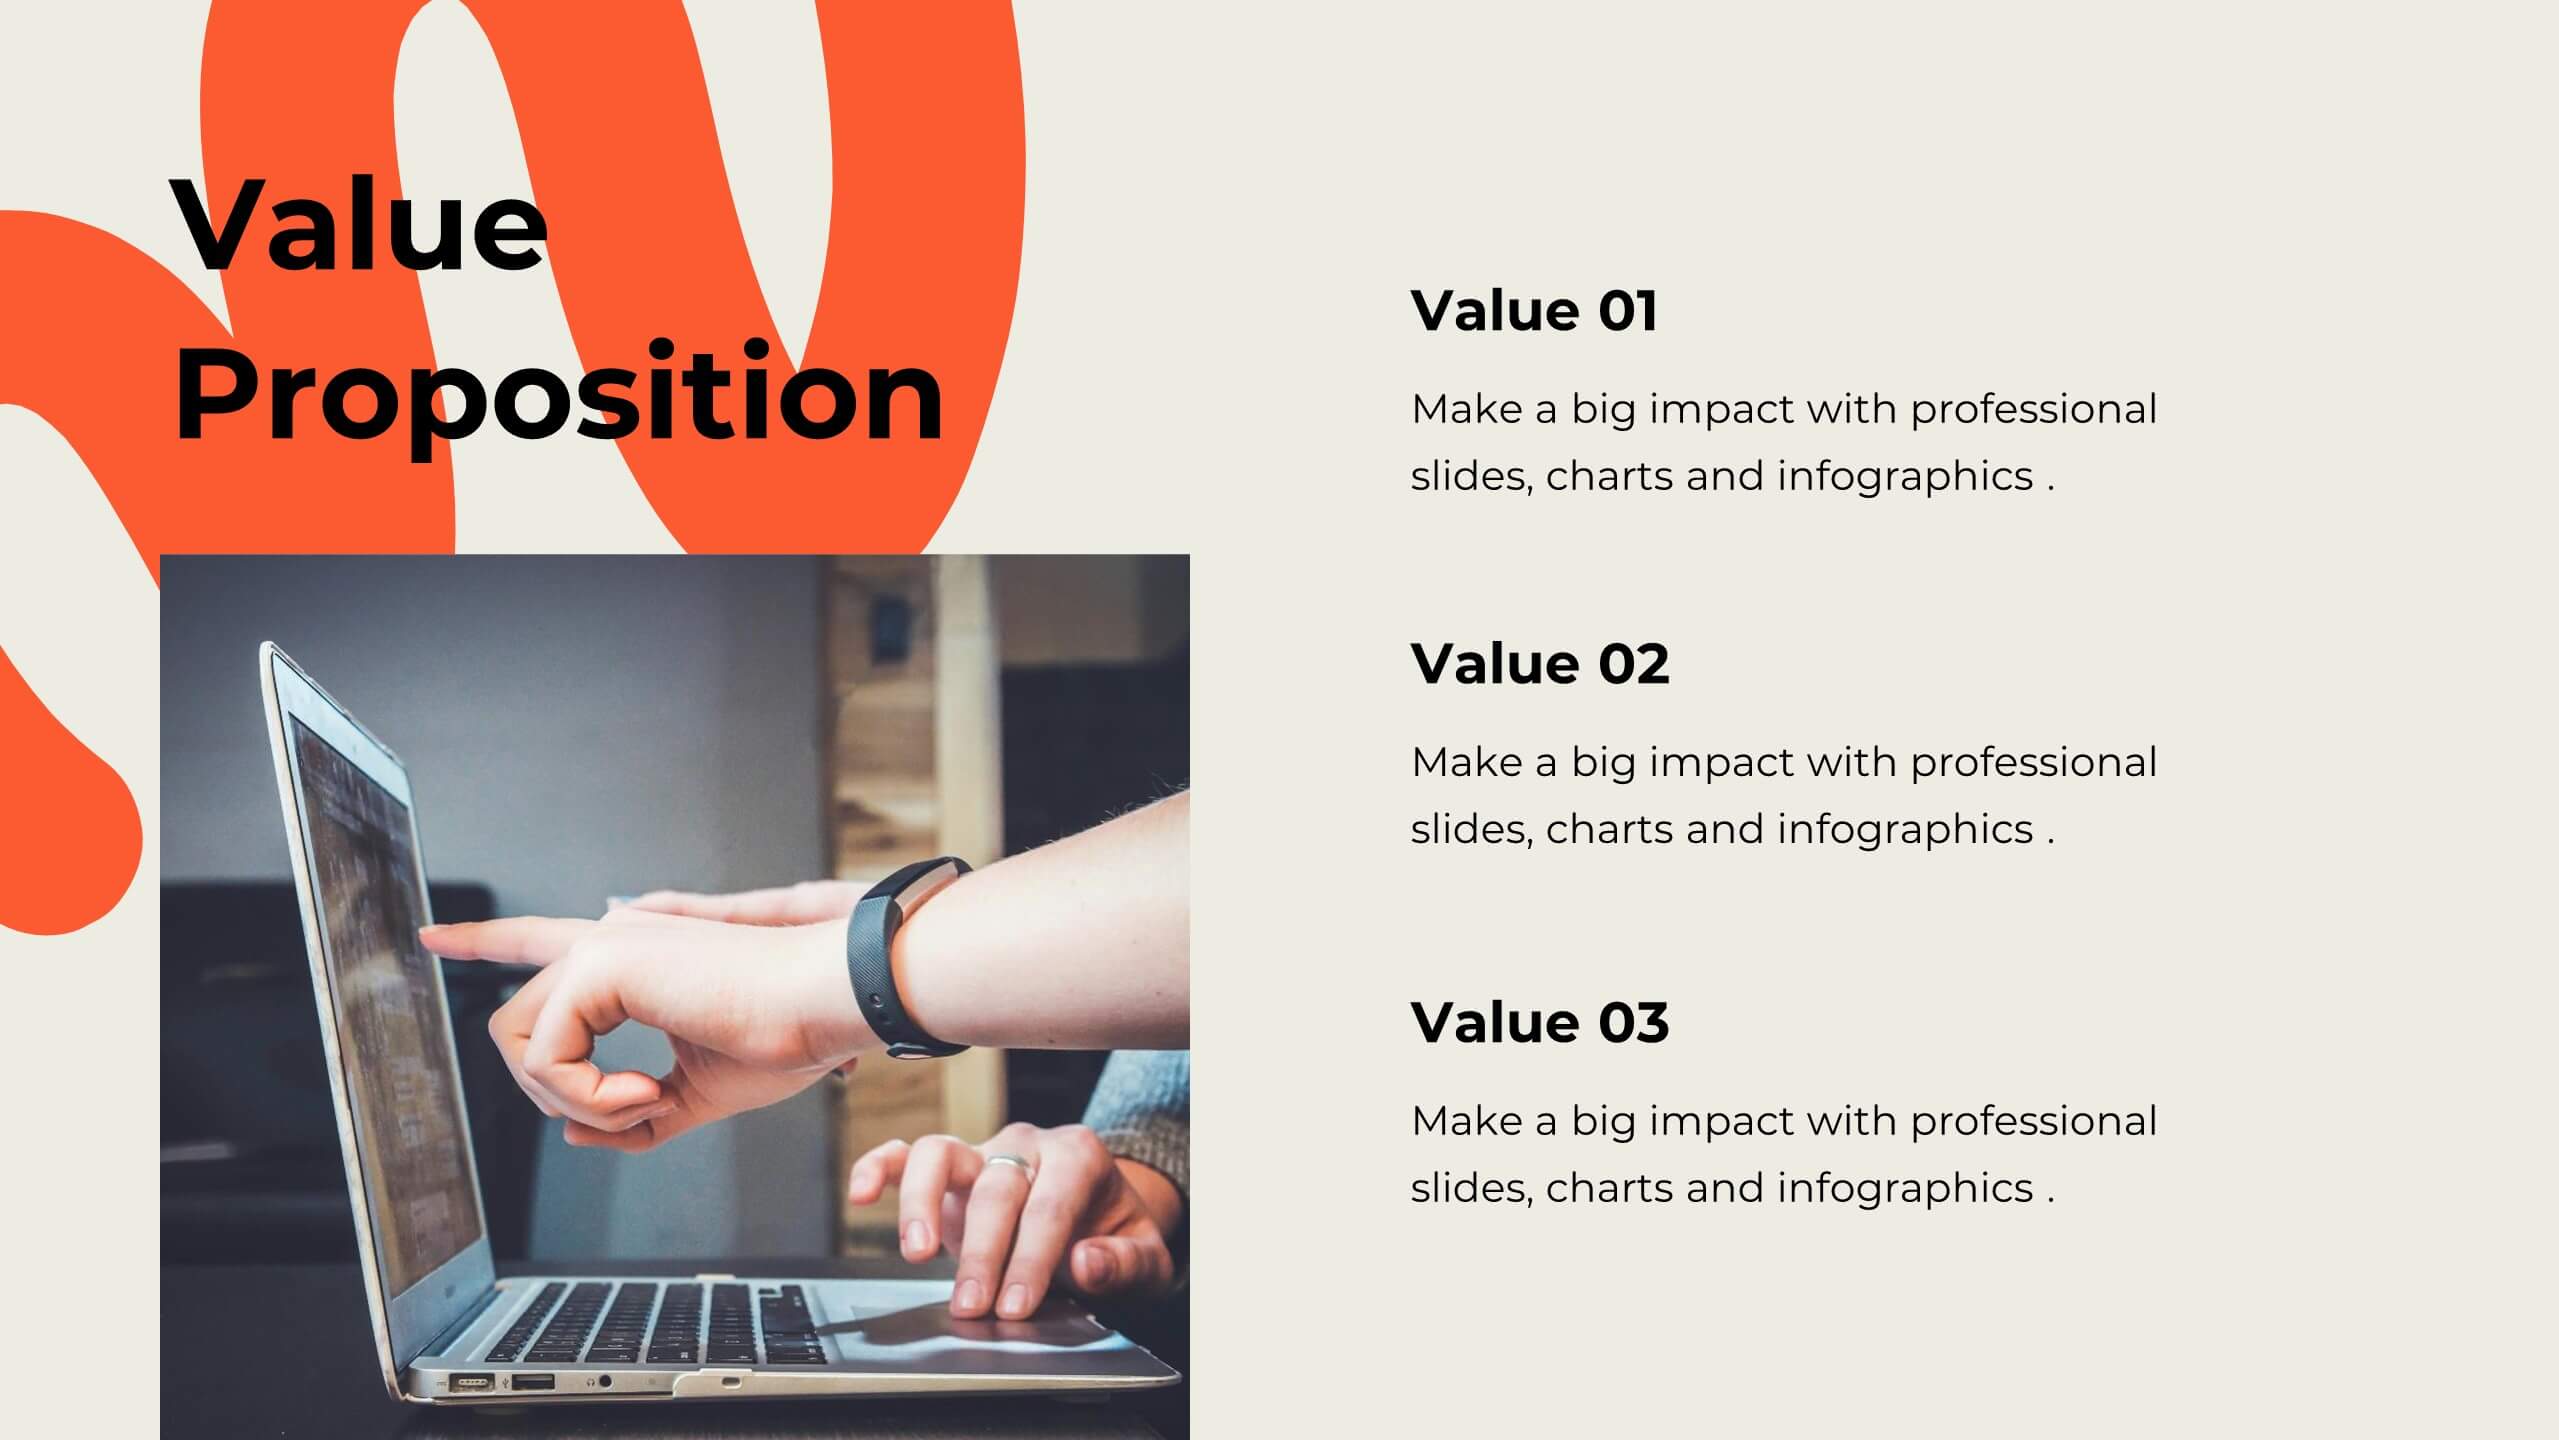
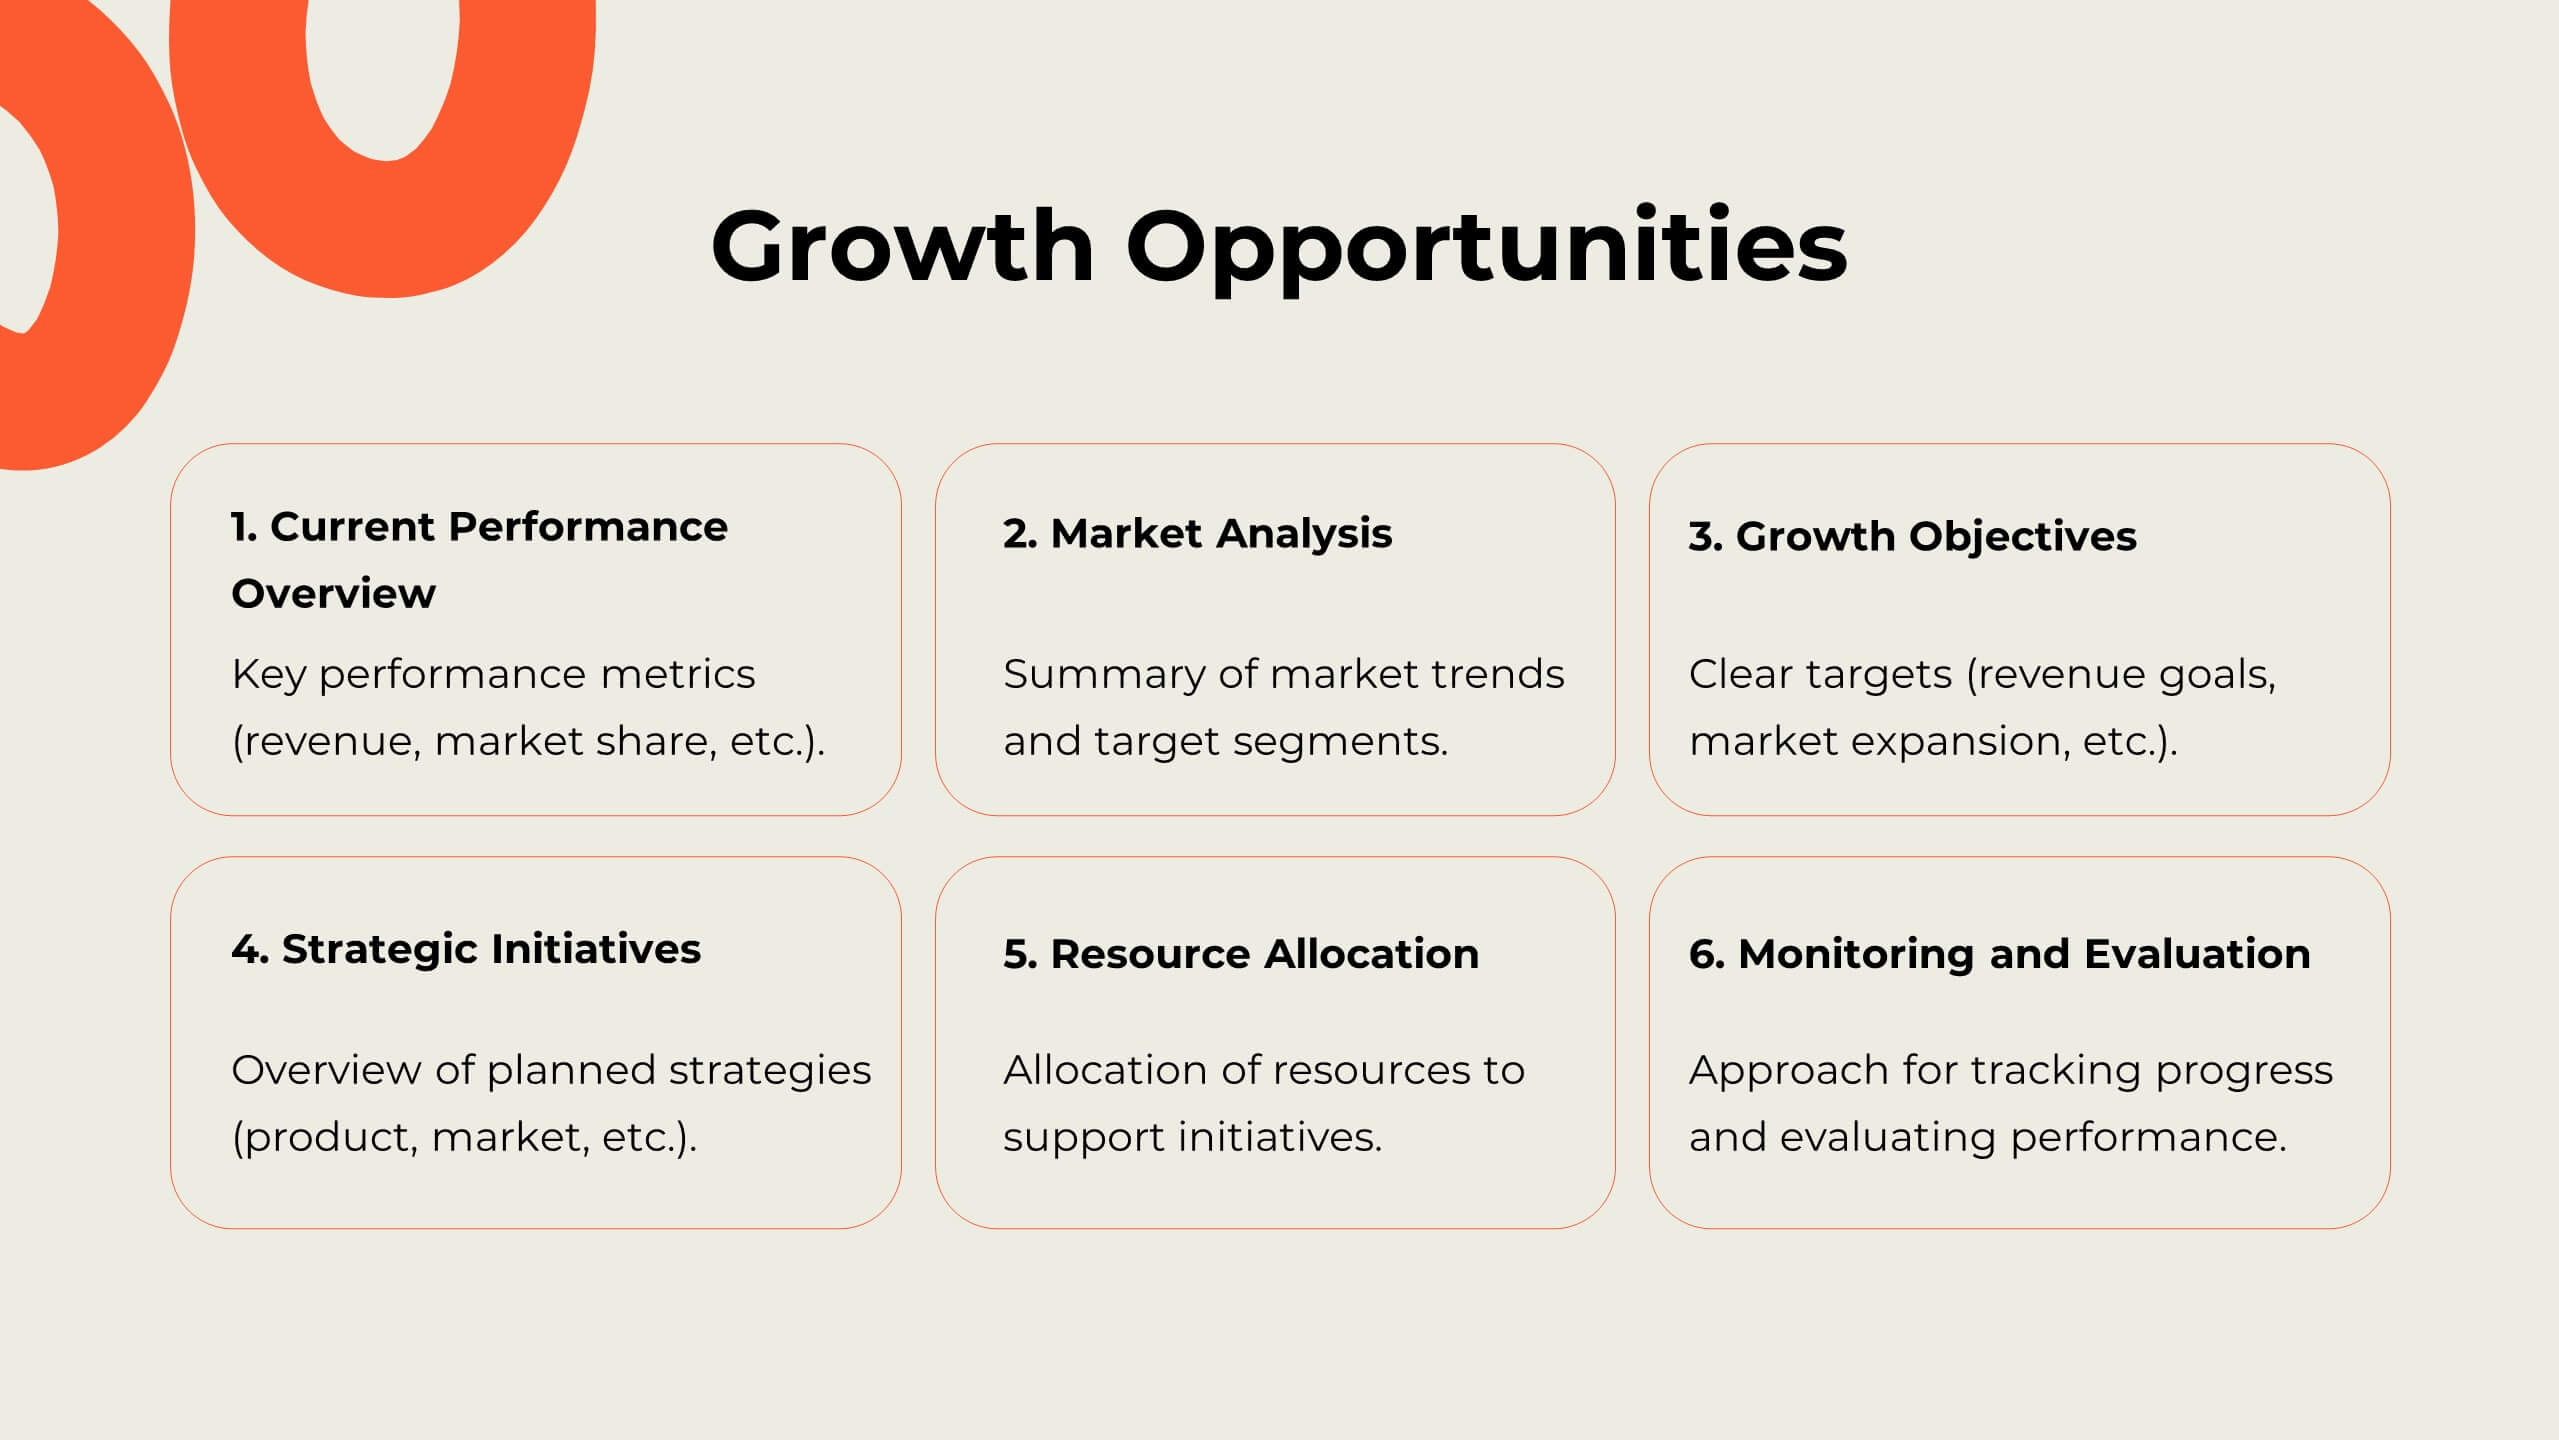
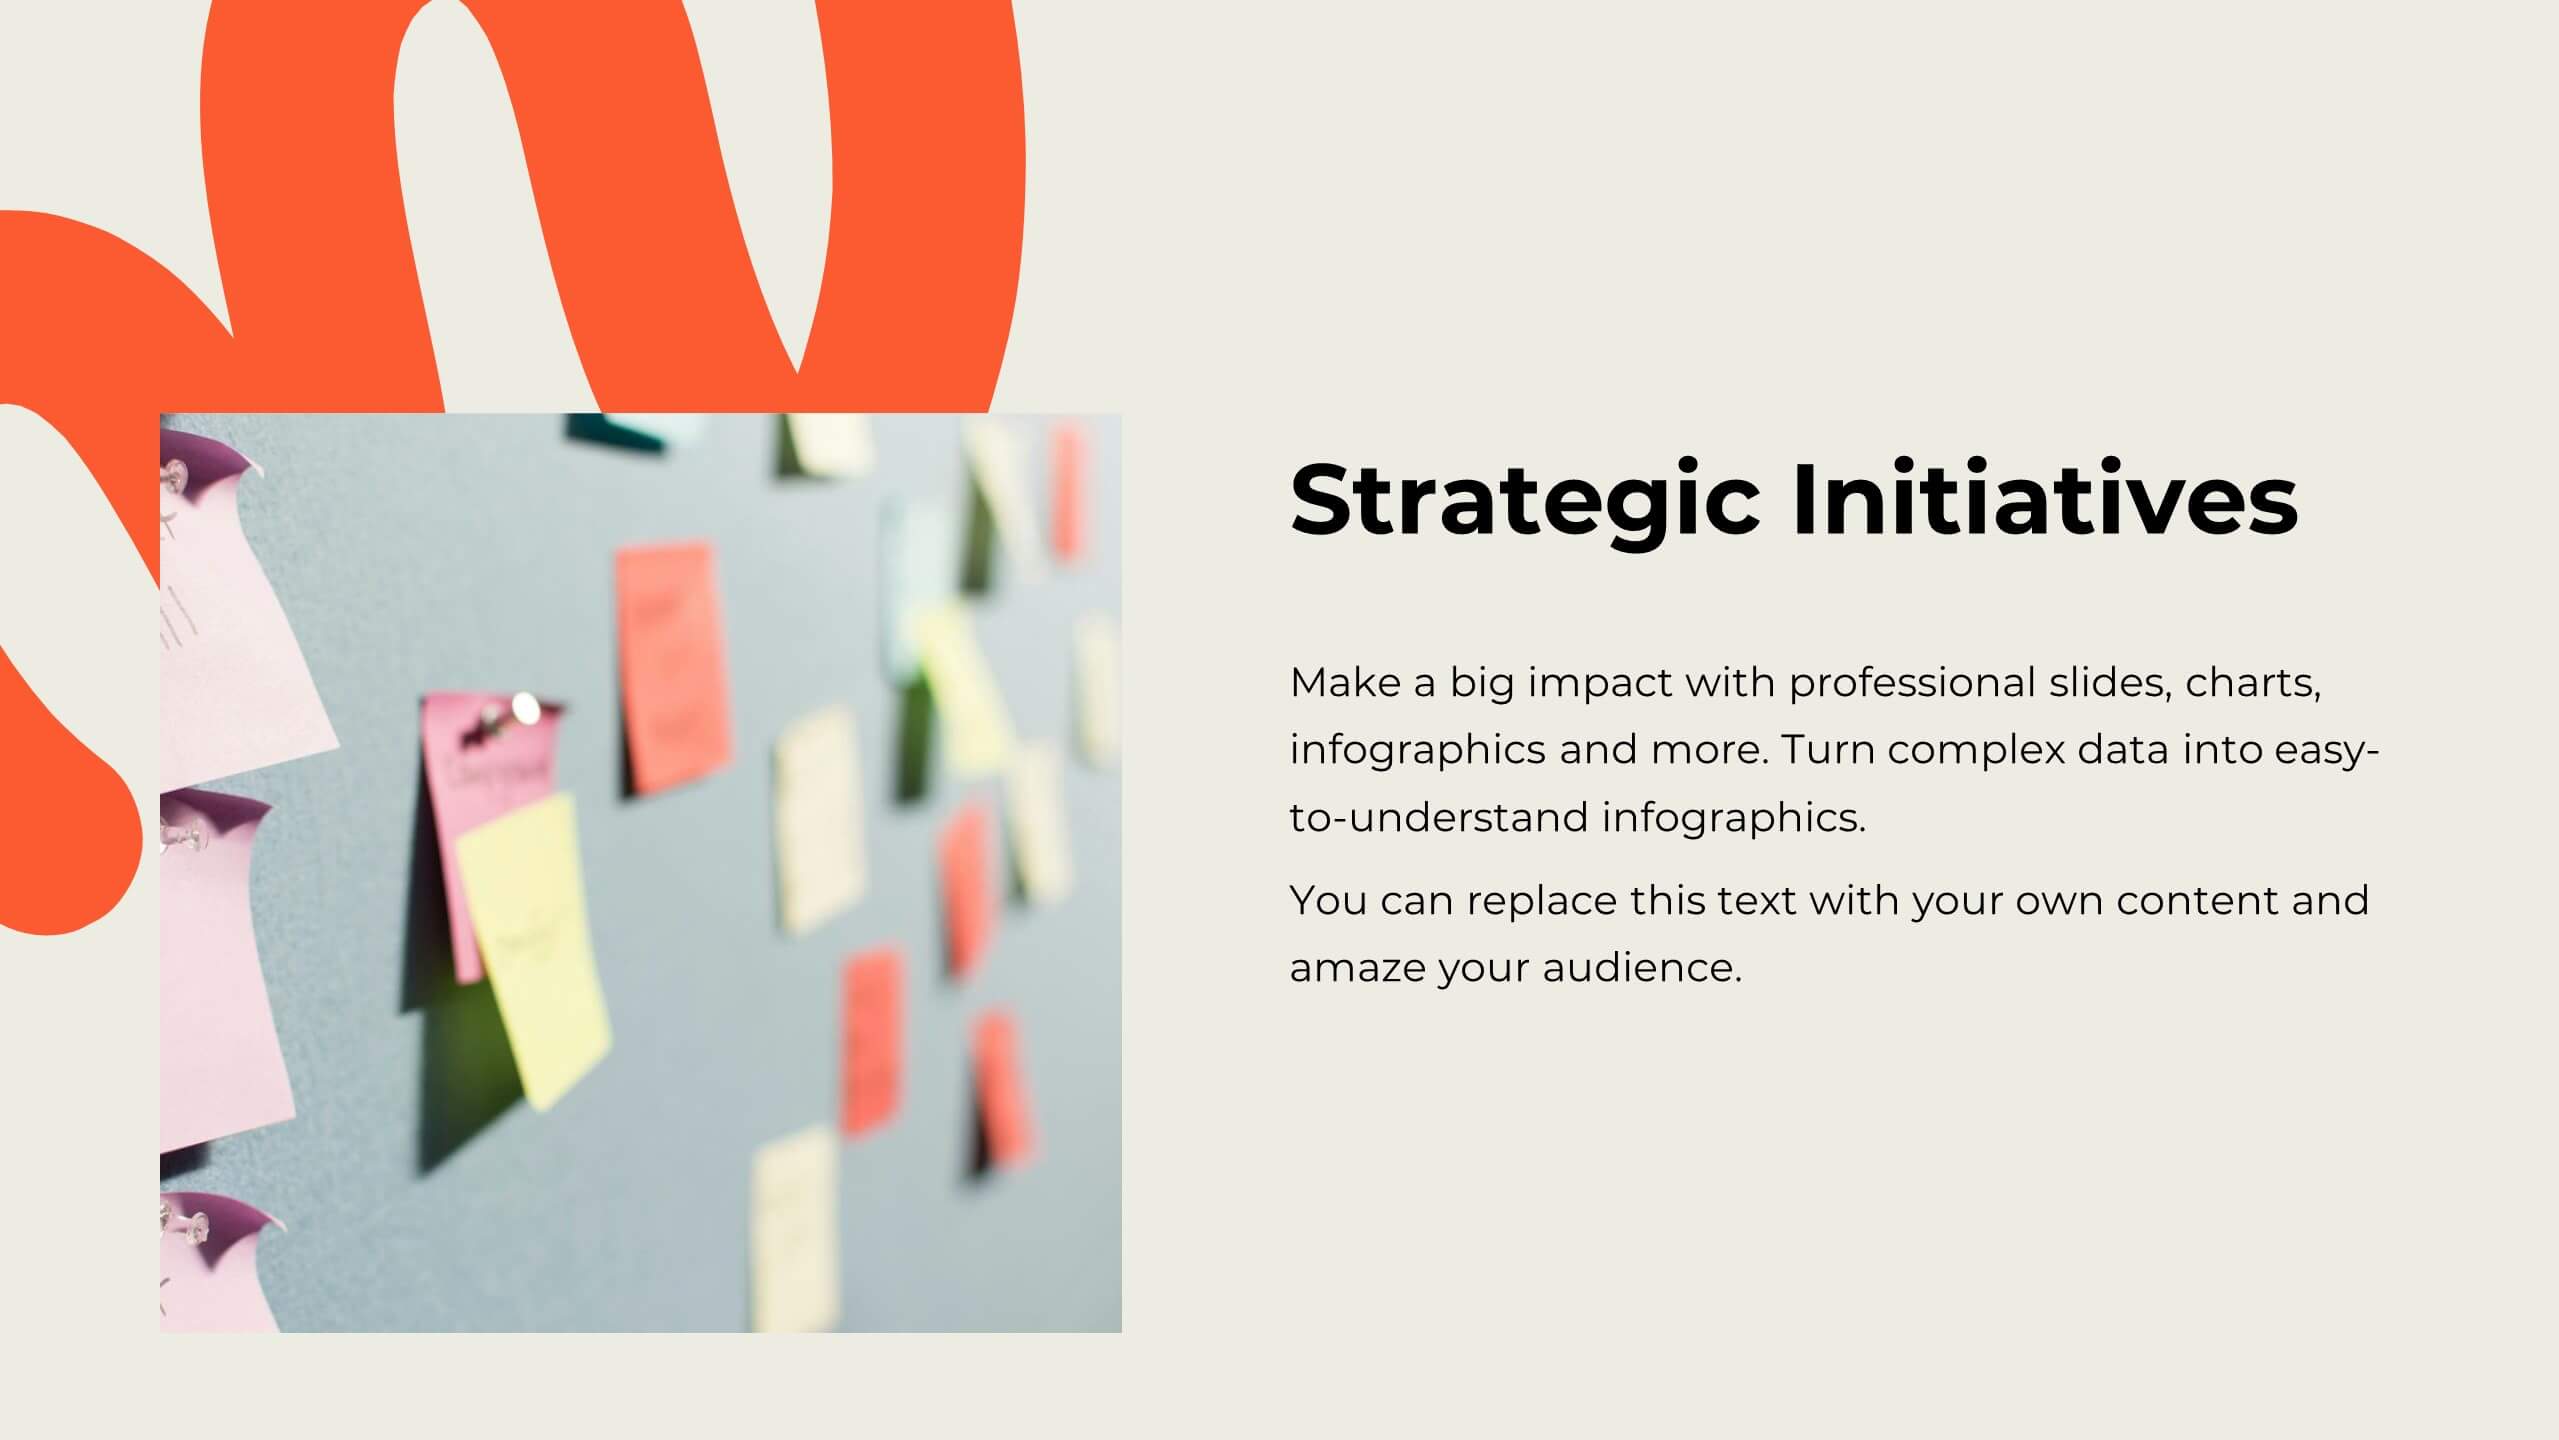
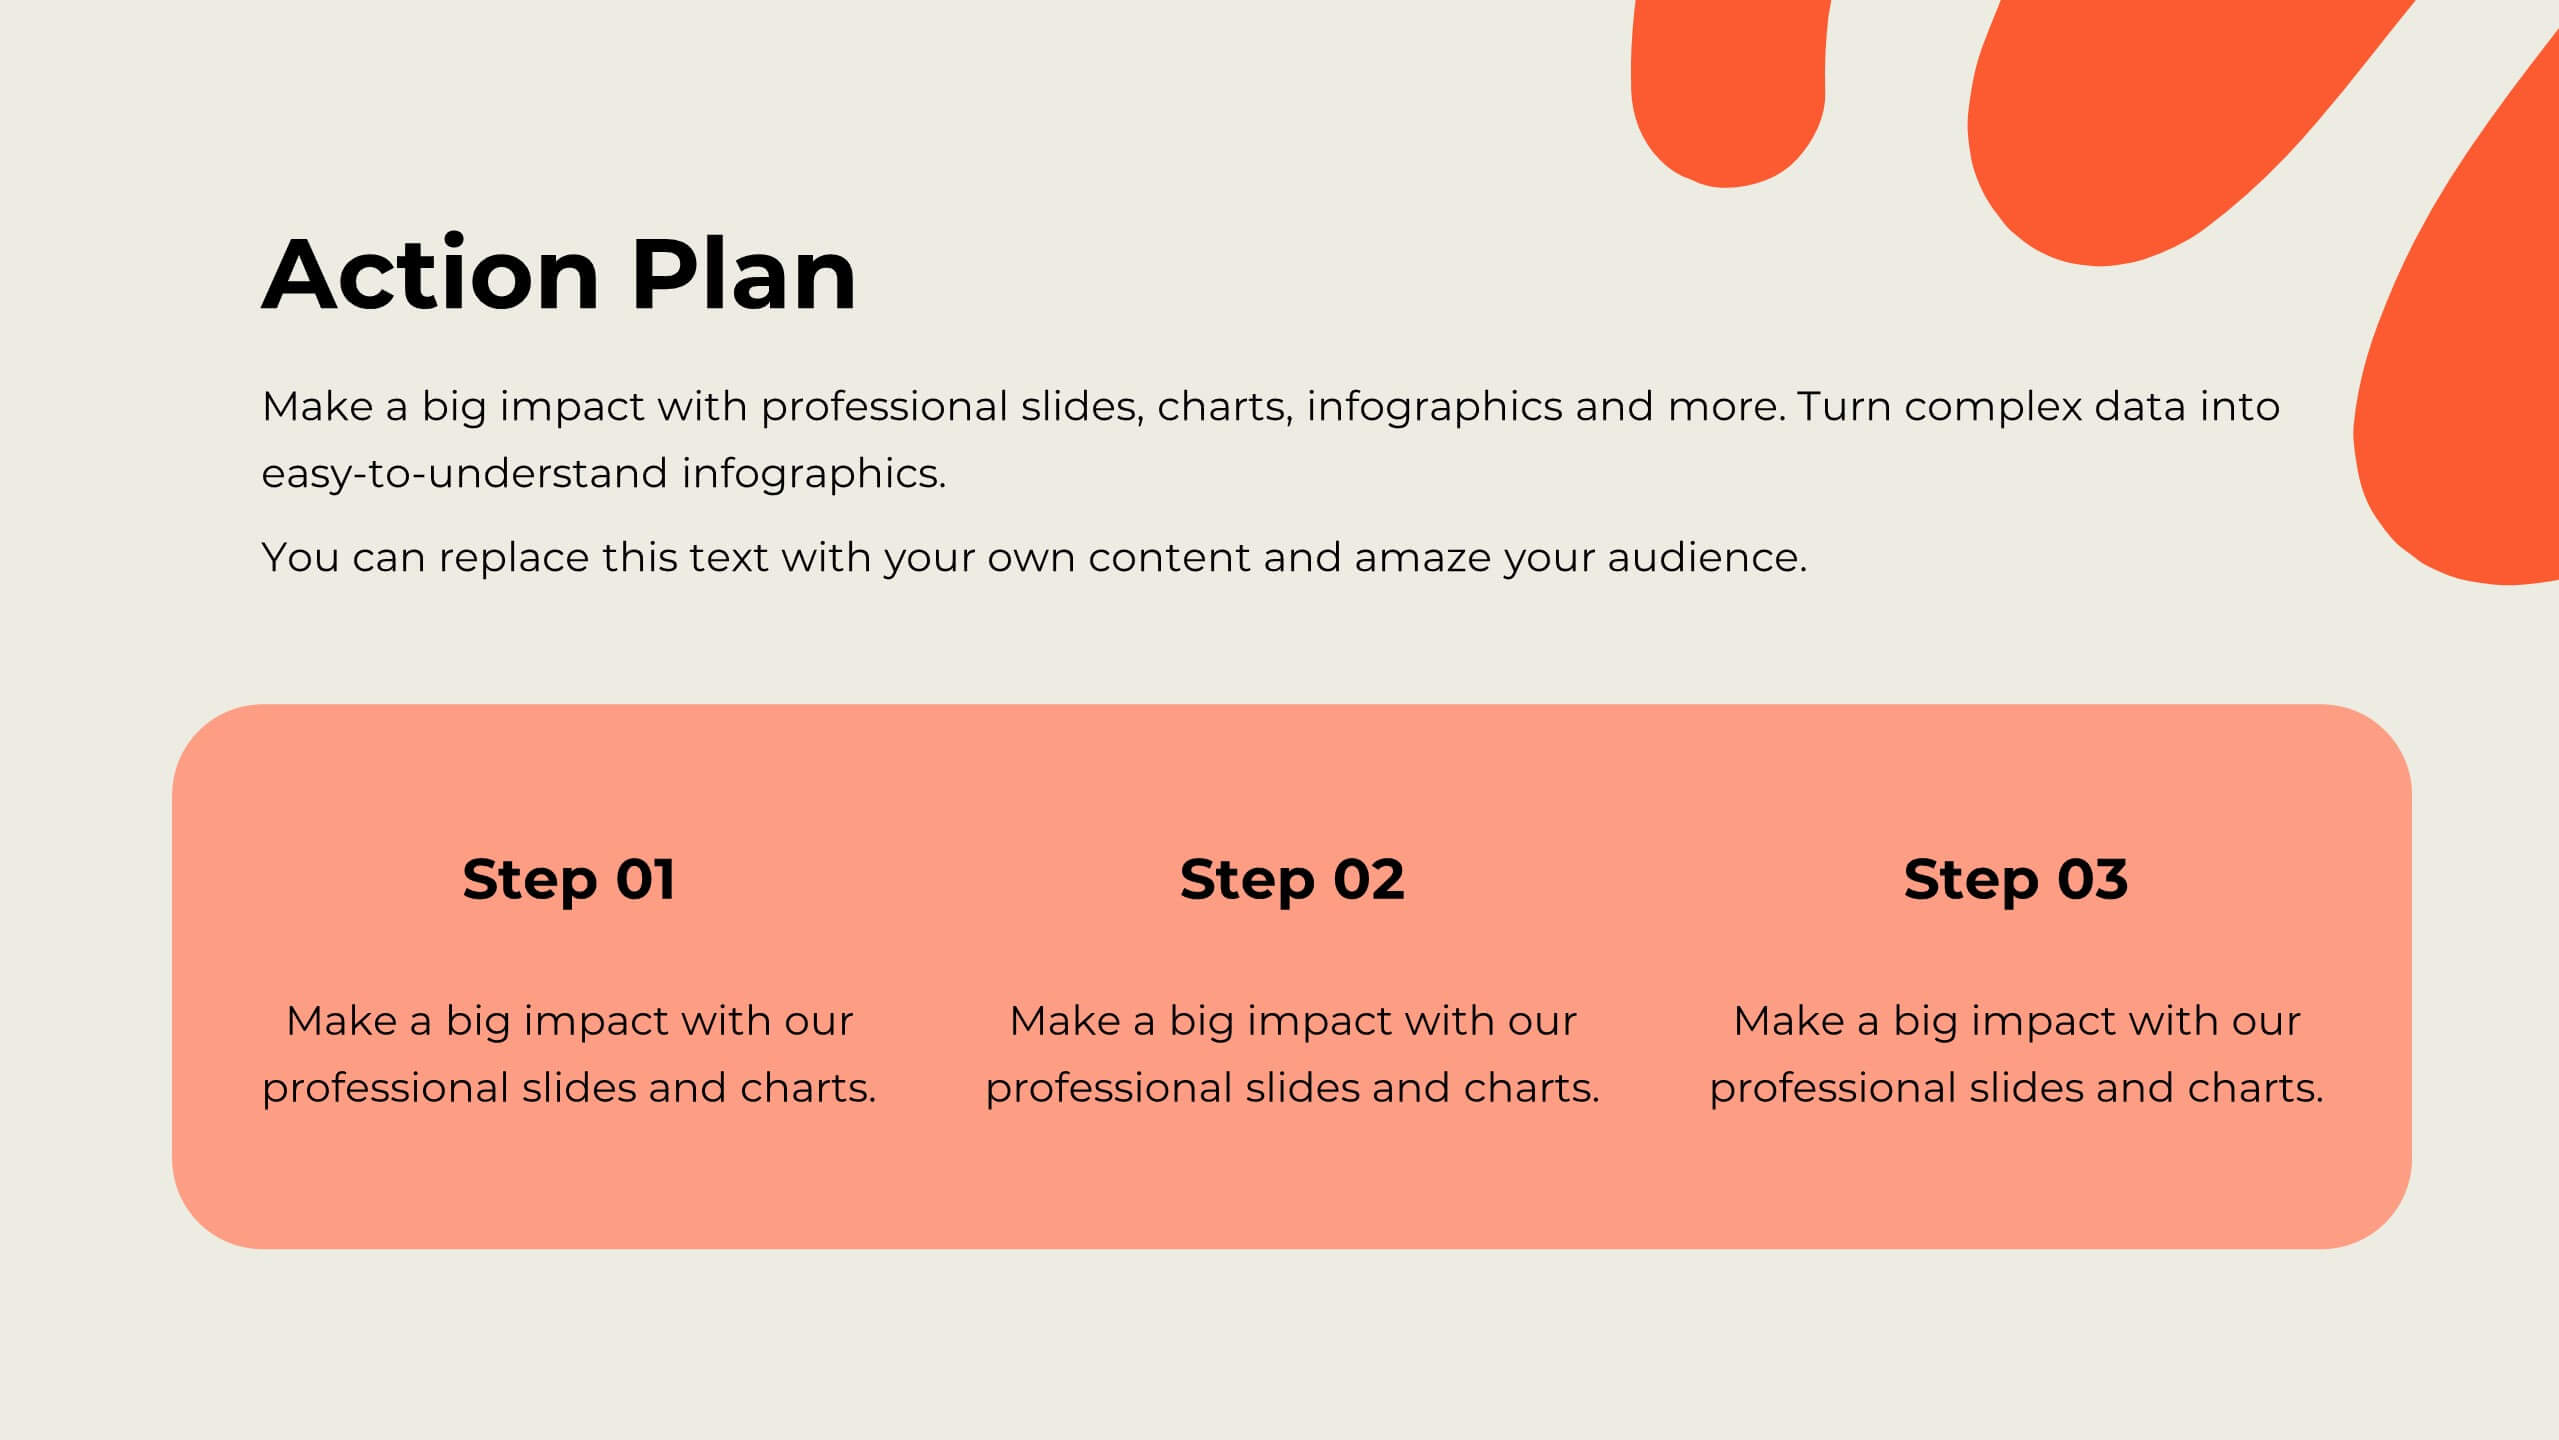
Defining Company Purpose Presentation
This template provides a visually engaging platform to articulate your organization's core values and mission. It features vibrant, clear sections for detailed insights, helping to communicate the foundational elements that drive business decisions and culture. Each slide is designed to support a cohesive narrative about your company's objectives and strategic direction, ensuring a professional presentation of your corporate ethos. This template is perfect for workshops, stakeholder meetings, or internal team alignments and is fully compatible with PowerPoint, Keynote, and Google Slides.


6 slides
Numbered Steps Diagram Presentation
Watch your workflow come to life as each step rises in a clean, structured path that makes progress easy to follow. This presentation guides audiences through sequential actions with clarity, helping simplify processes, plans, or instructions. Perfect for business, training, or project teams. Fully compatible with PowerPoint, Keynote, and Google Slides.


5 slides
Demographic and Psychographic Segments Presentation
Break down your audience with clarity using the Demographic and Psychographic Segments Presentation. This slide is ideal for showcasing four key consumer dimensions through a centered circular layout and quadrant icons. Perfect for marketing campaigns, branding strategies, and audience targeting. Fully editable in Canva, PowerPoint, Keynote, or Google Slides.


6 slides
Customer Journey Mapping with Buyer Persona Presentation
Clearly visualize the customer experience across all touchpoints with this structured journey mapping slide. Featuring a central buyer persona graphic and six customizable steps with icons, this layout helps you break down each stage of the customer path. Perfect for UX strategy, customer service insights, and product development. Fully editable and compatible with PowerPoint, Keynote, and Google Slides.


6 slides
Data Visualization Pie Chart Presentation
Present data with clarity using the Data Visualization Pie Chart Presentation template. This professional and fully customizable slide deck is designed for business analysts, marketers, and data scientists to showcase key insights in an engaging and visually impactful way. Featuring a modern pie chart layout, it simplifies complex information for clear communication. Compatible with PowerPoint, Keynote, and Google Slides.


12 slides
Customer Satisfaction Smile Rating Presentation
Measure customer happiness with this engaging customer satisfaction smile rating template! Featuring a visual scale from dissatisfaction to delight, this design helps businesses track feedback and identify improvement areas. Ideal for reports, surveys, and performance reviews. Fully customizable and compatible with PowerPoint, Keynote, and Google Slides.


23 slides
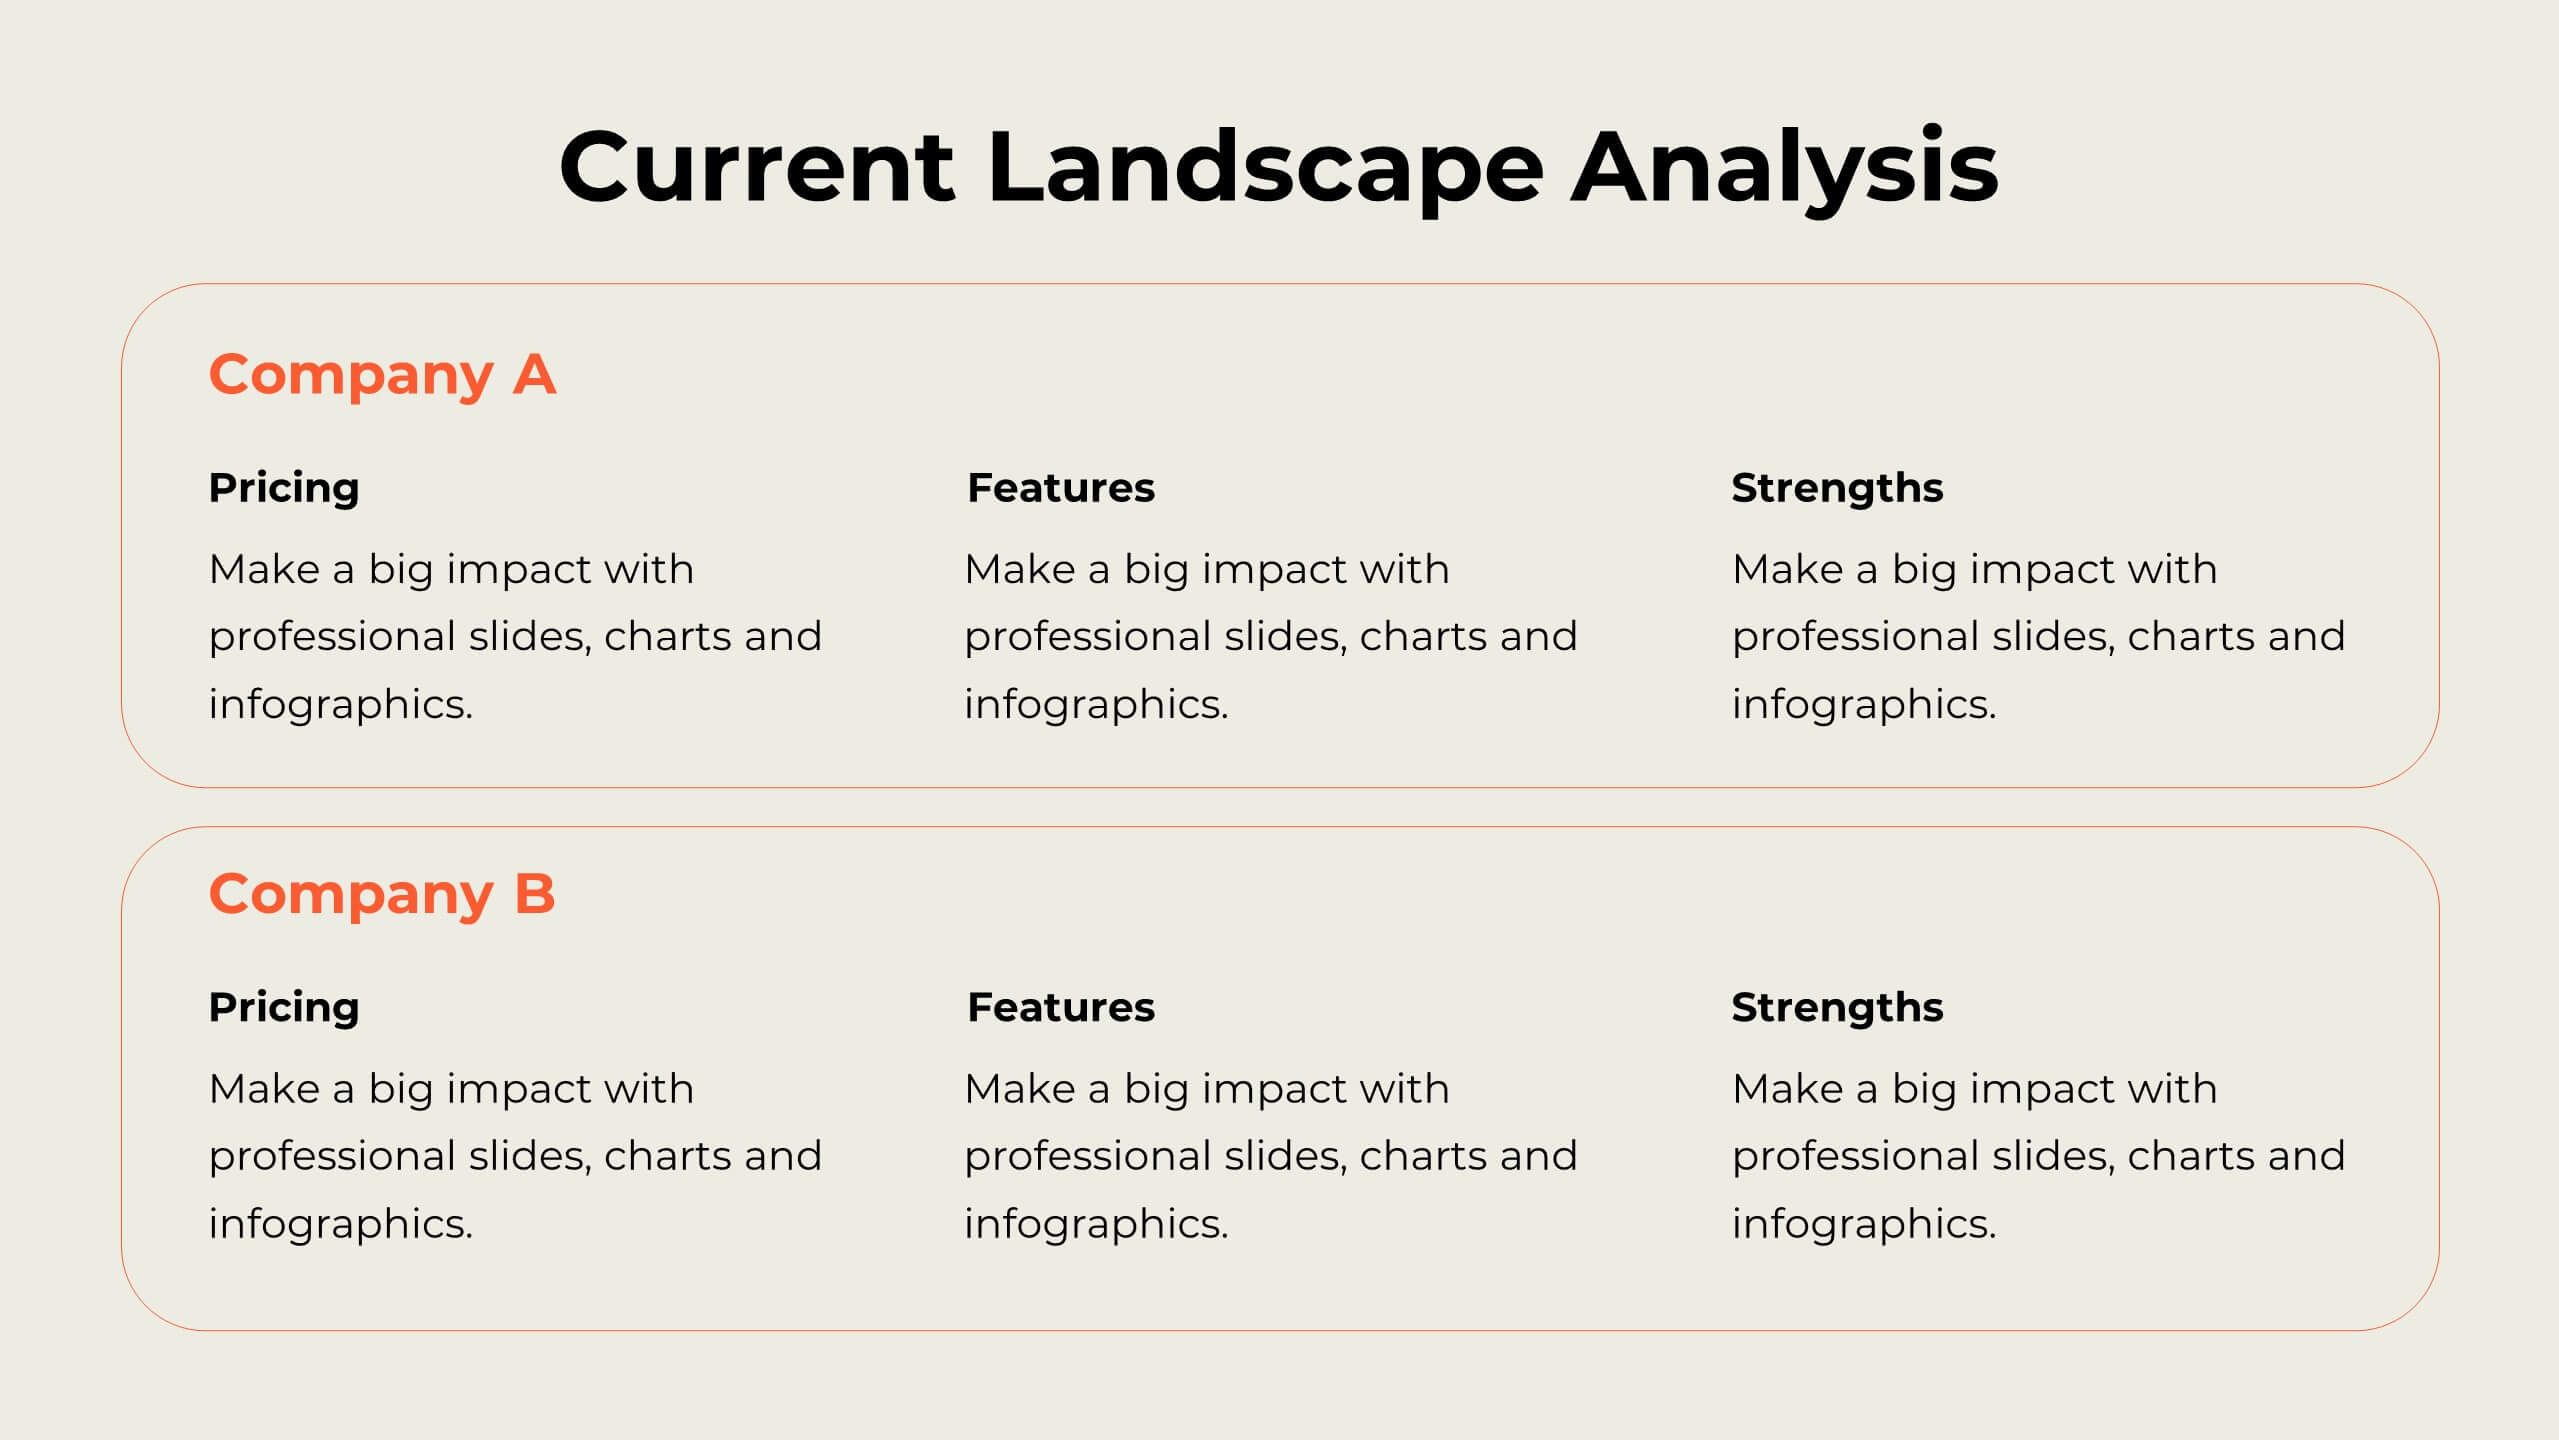
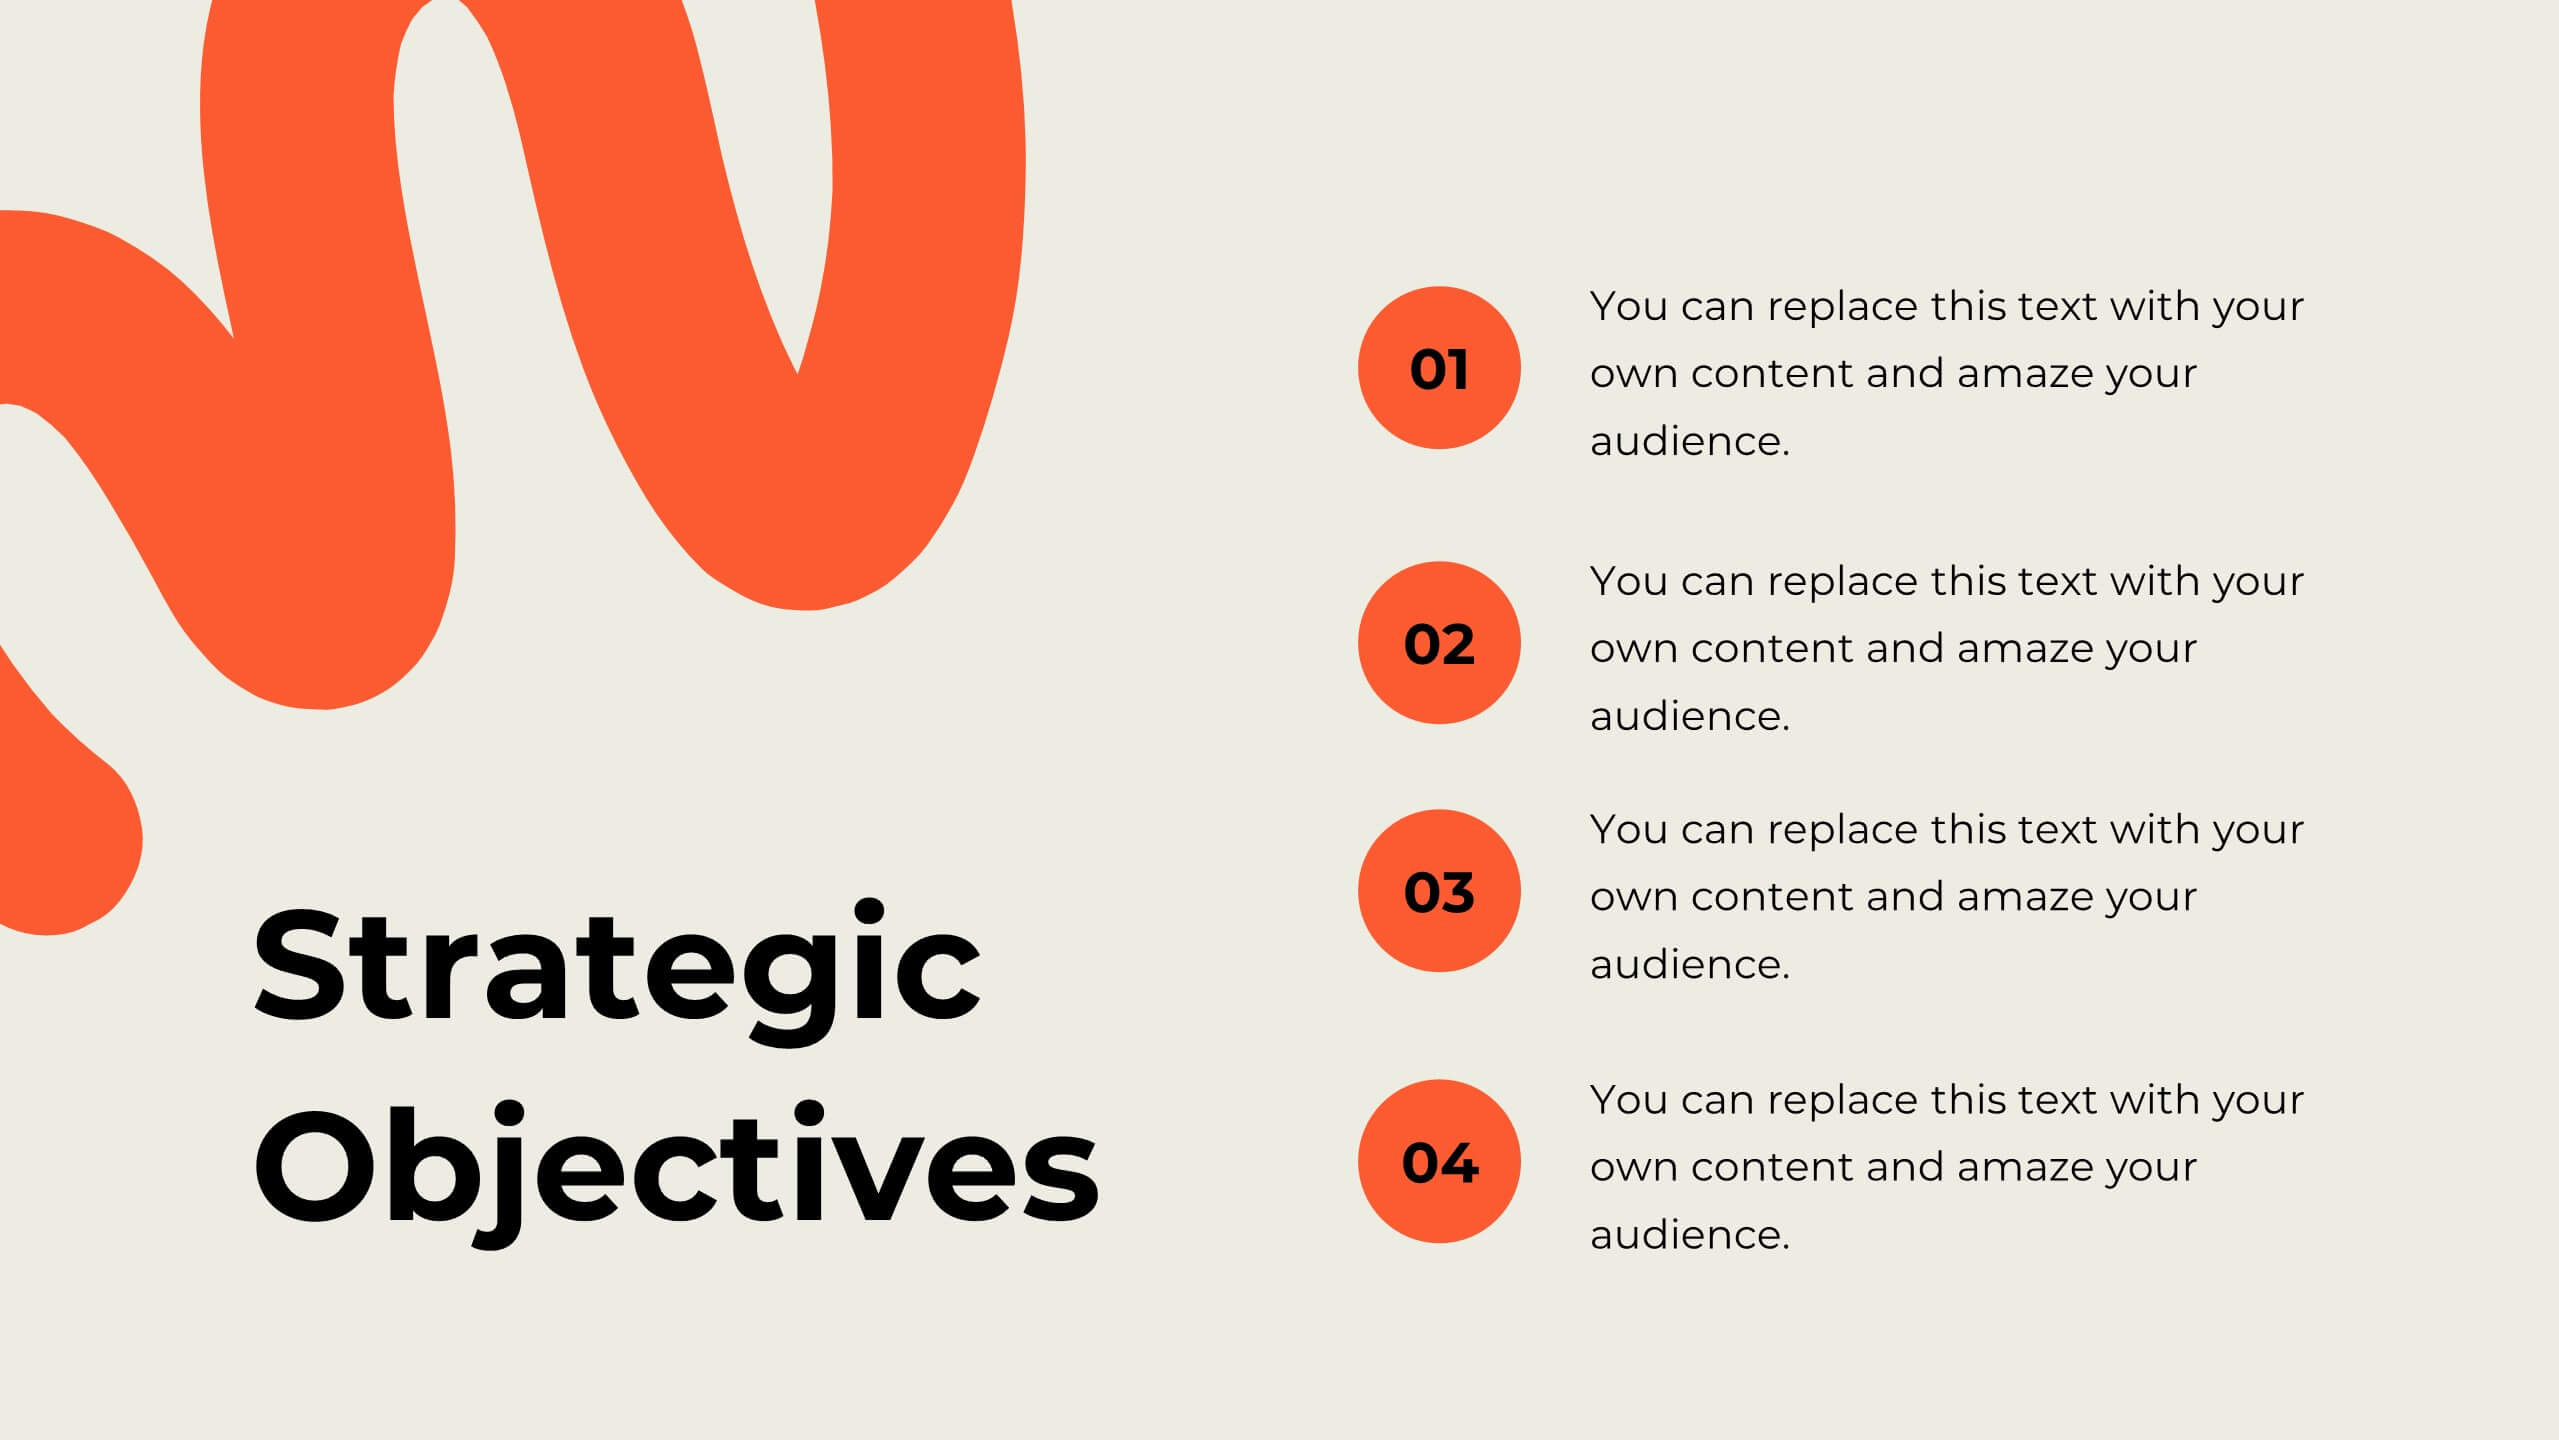
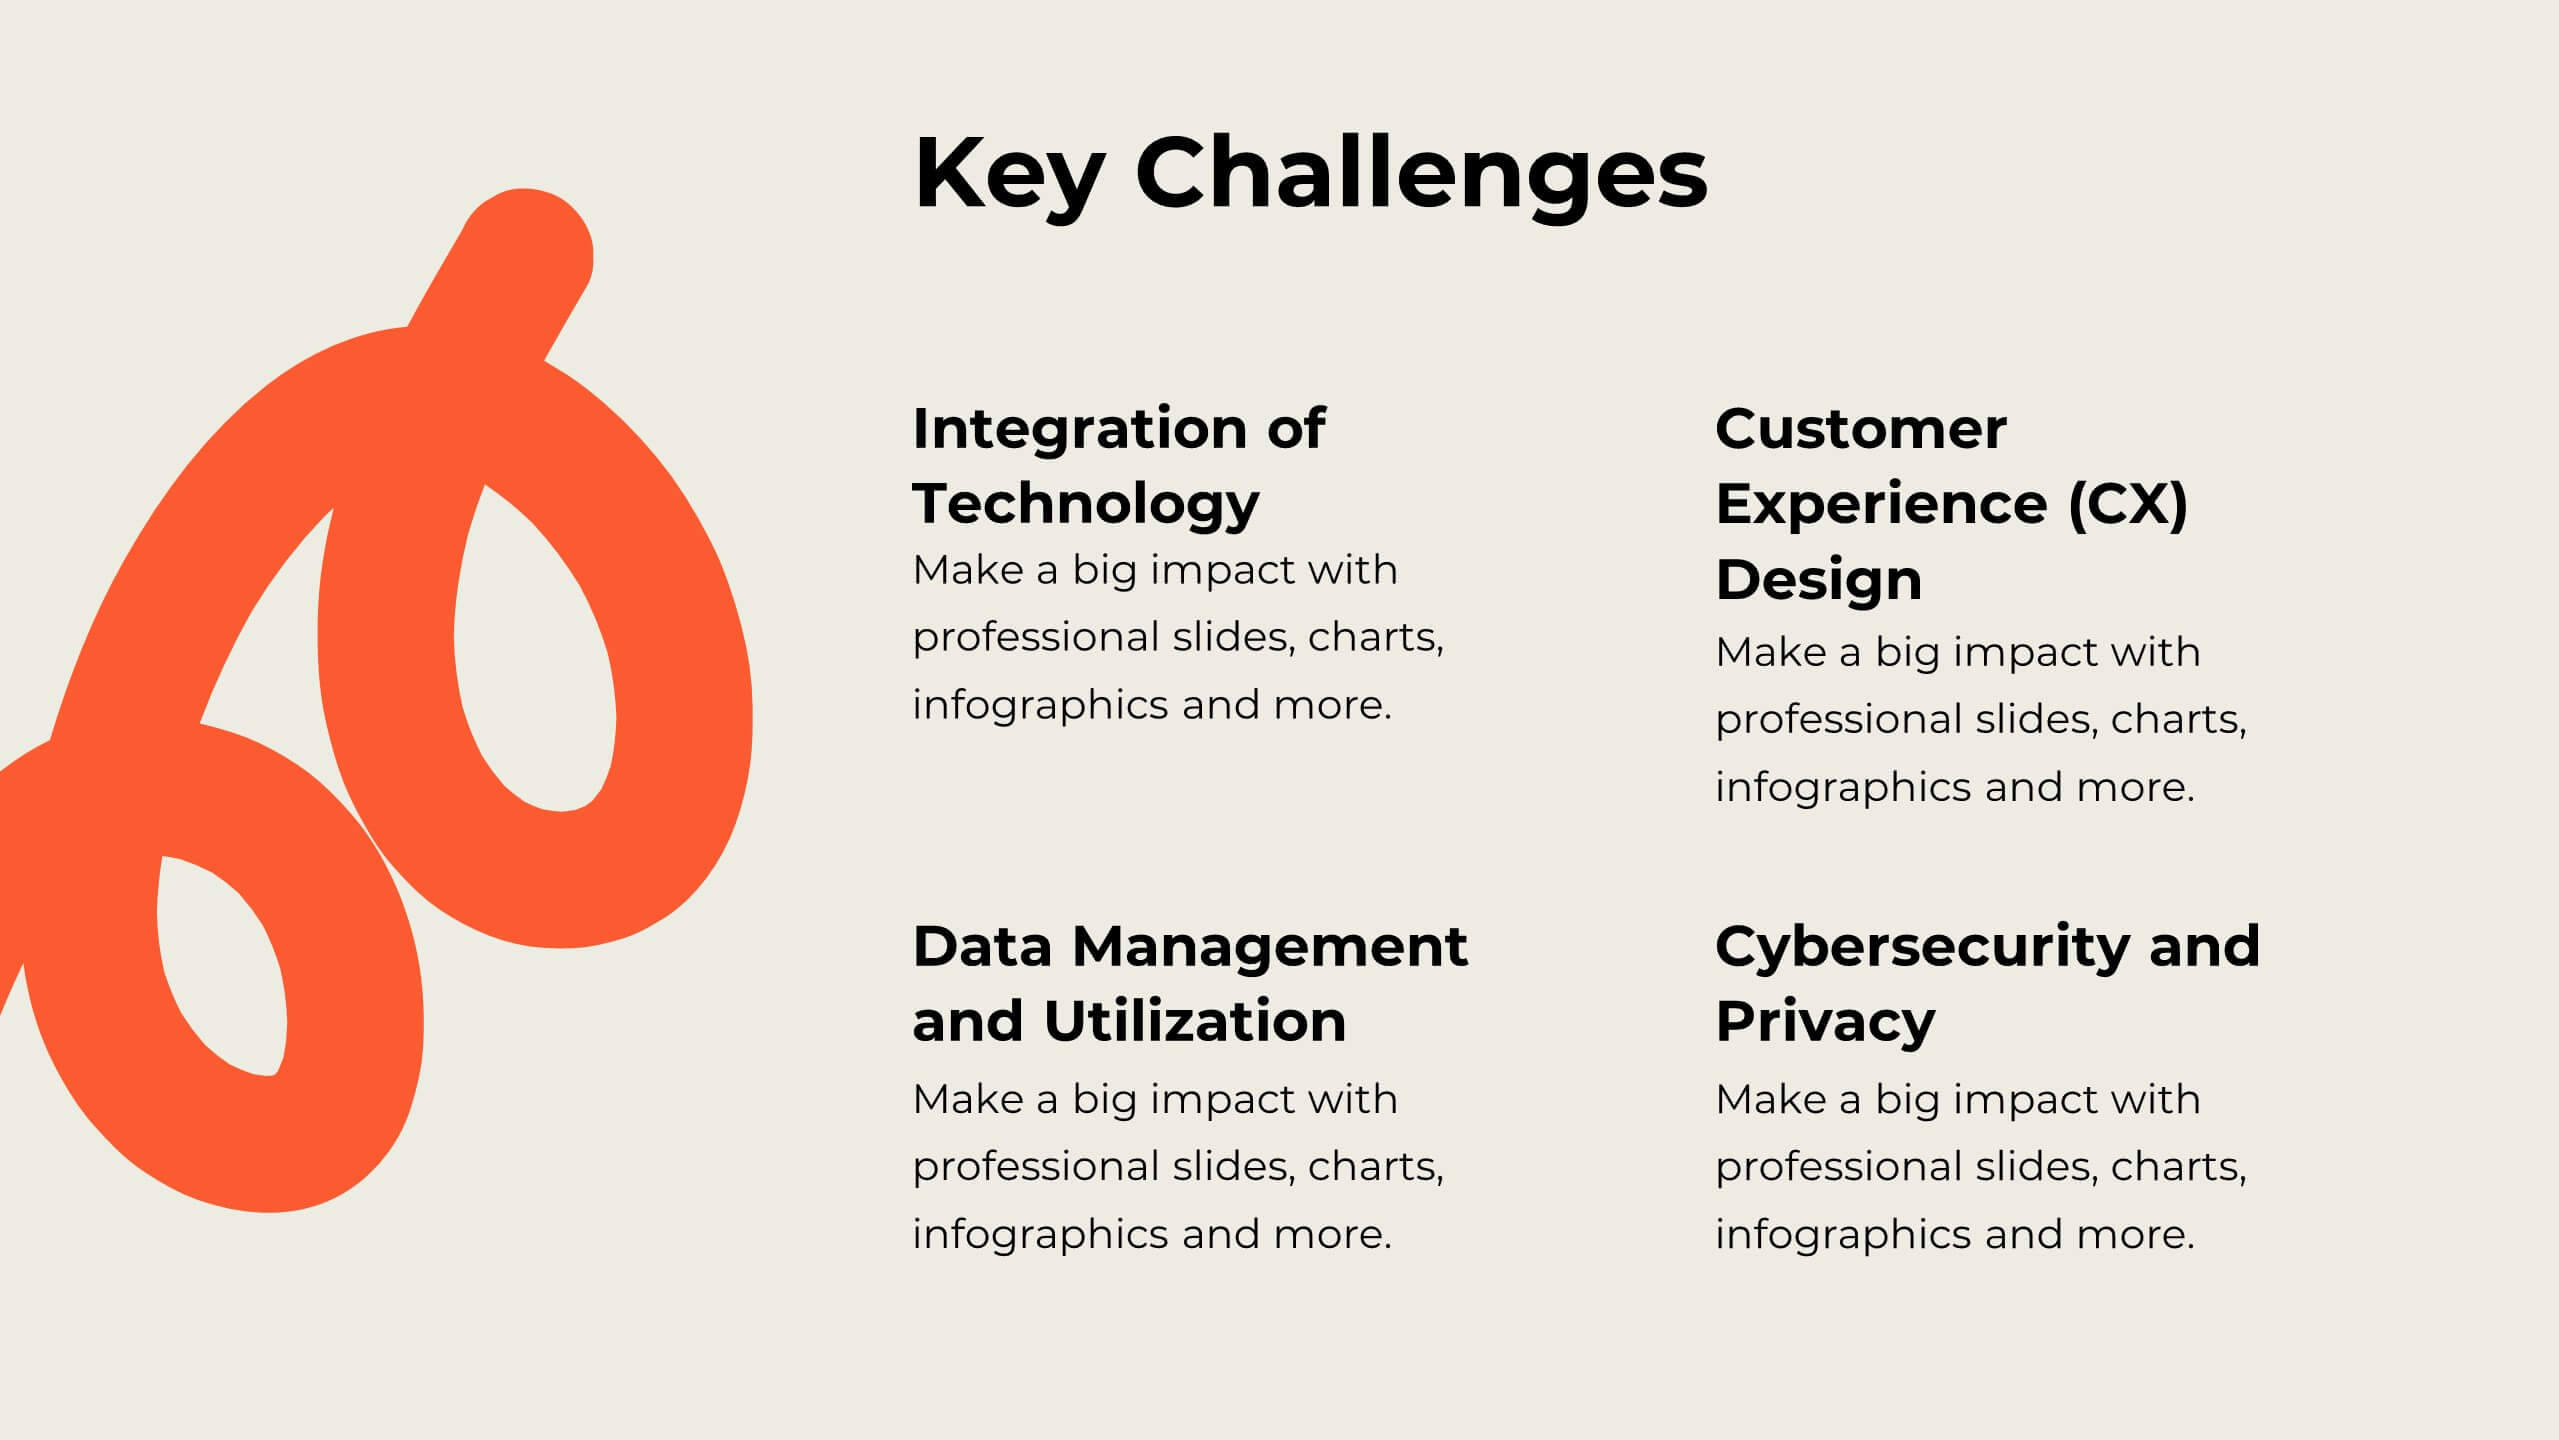
Mirage Digital Strategy Presentation
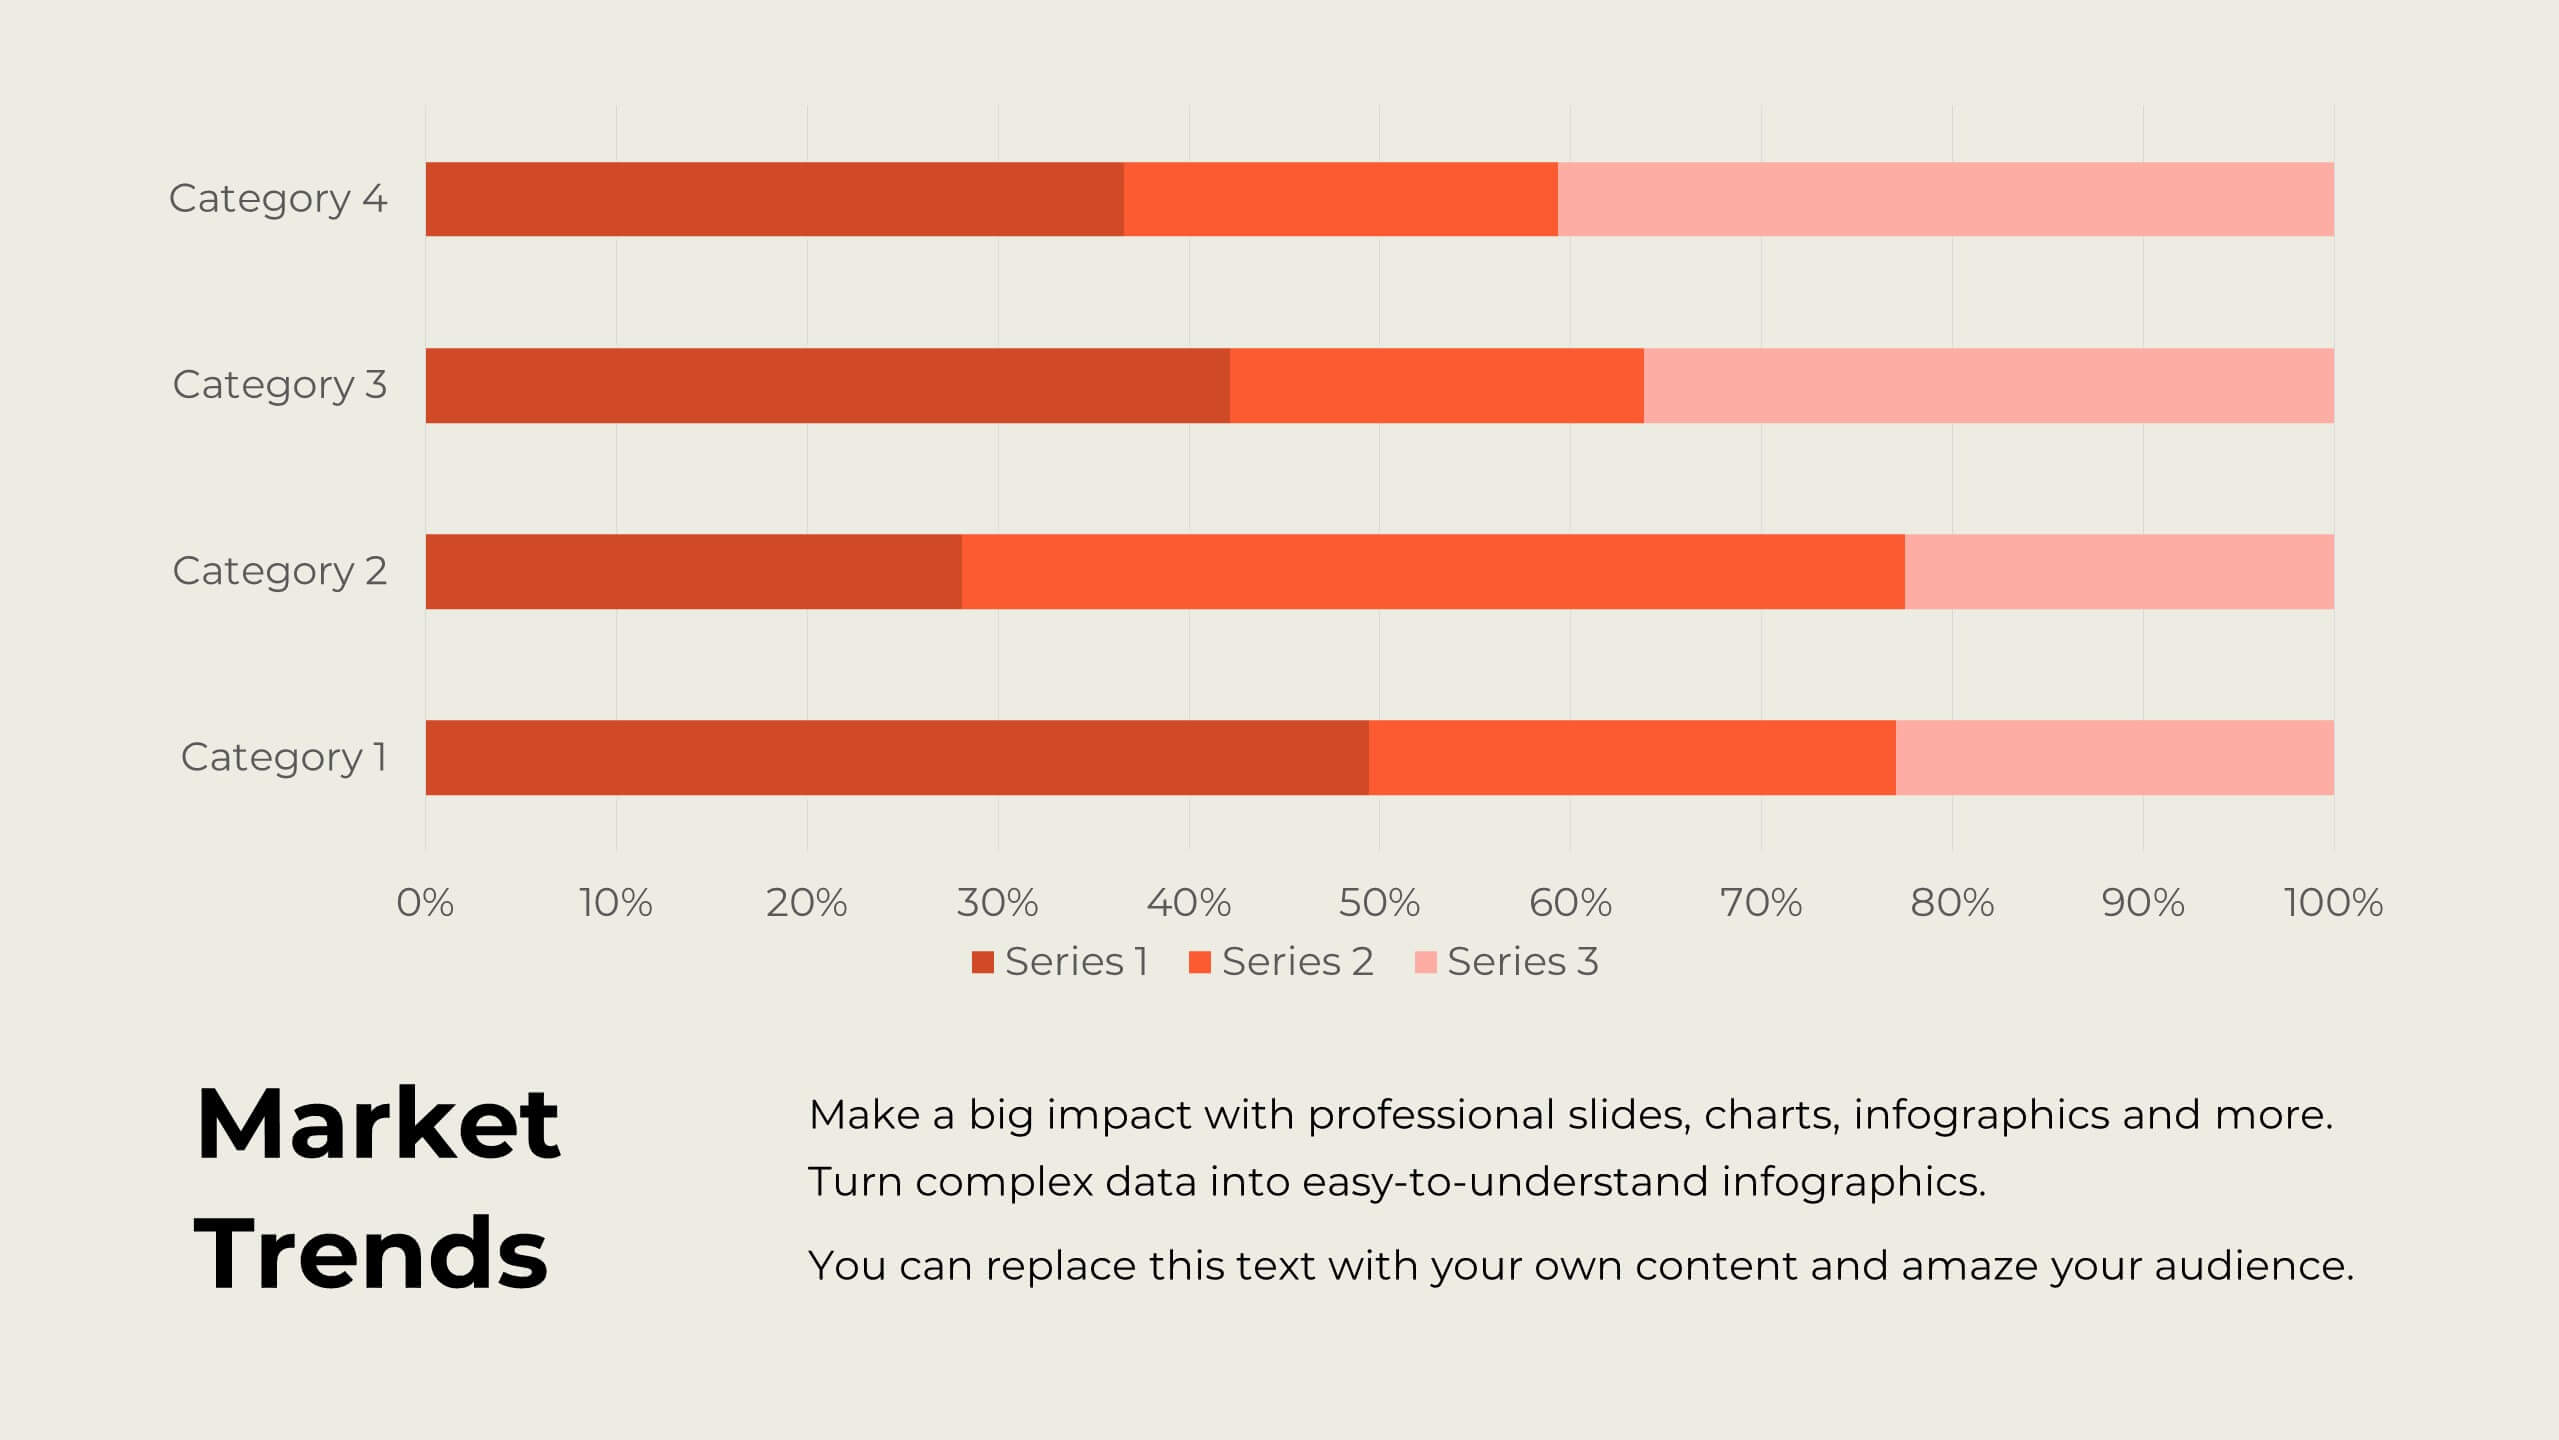
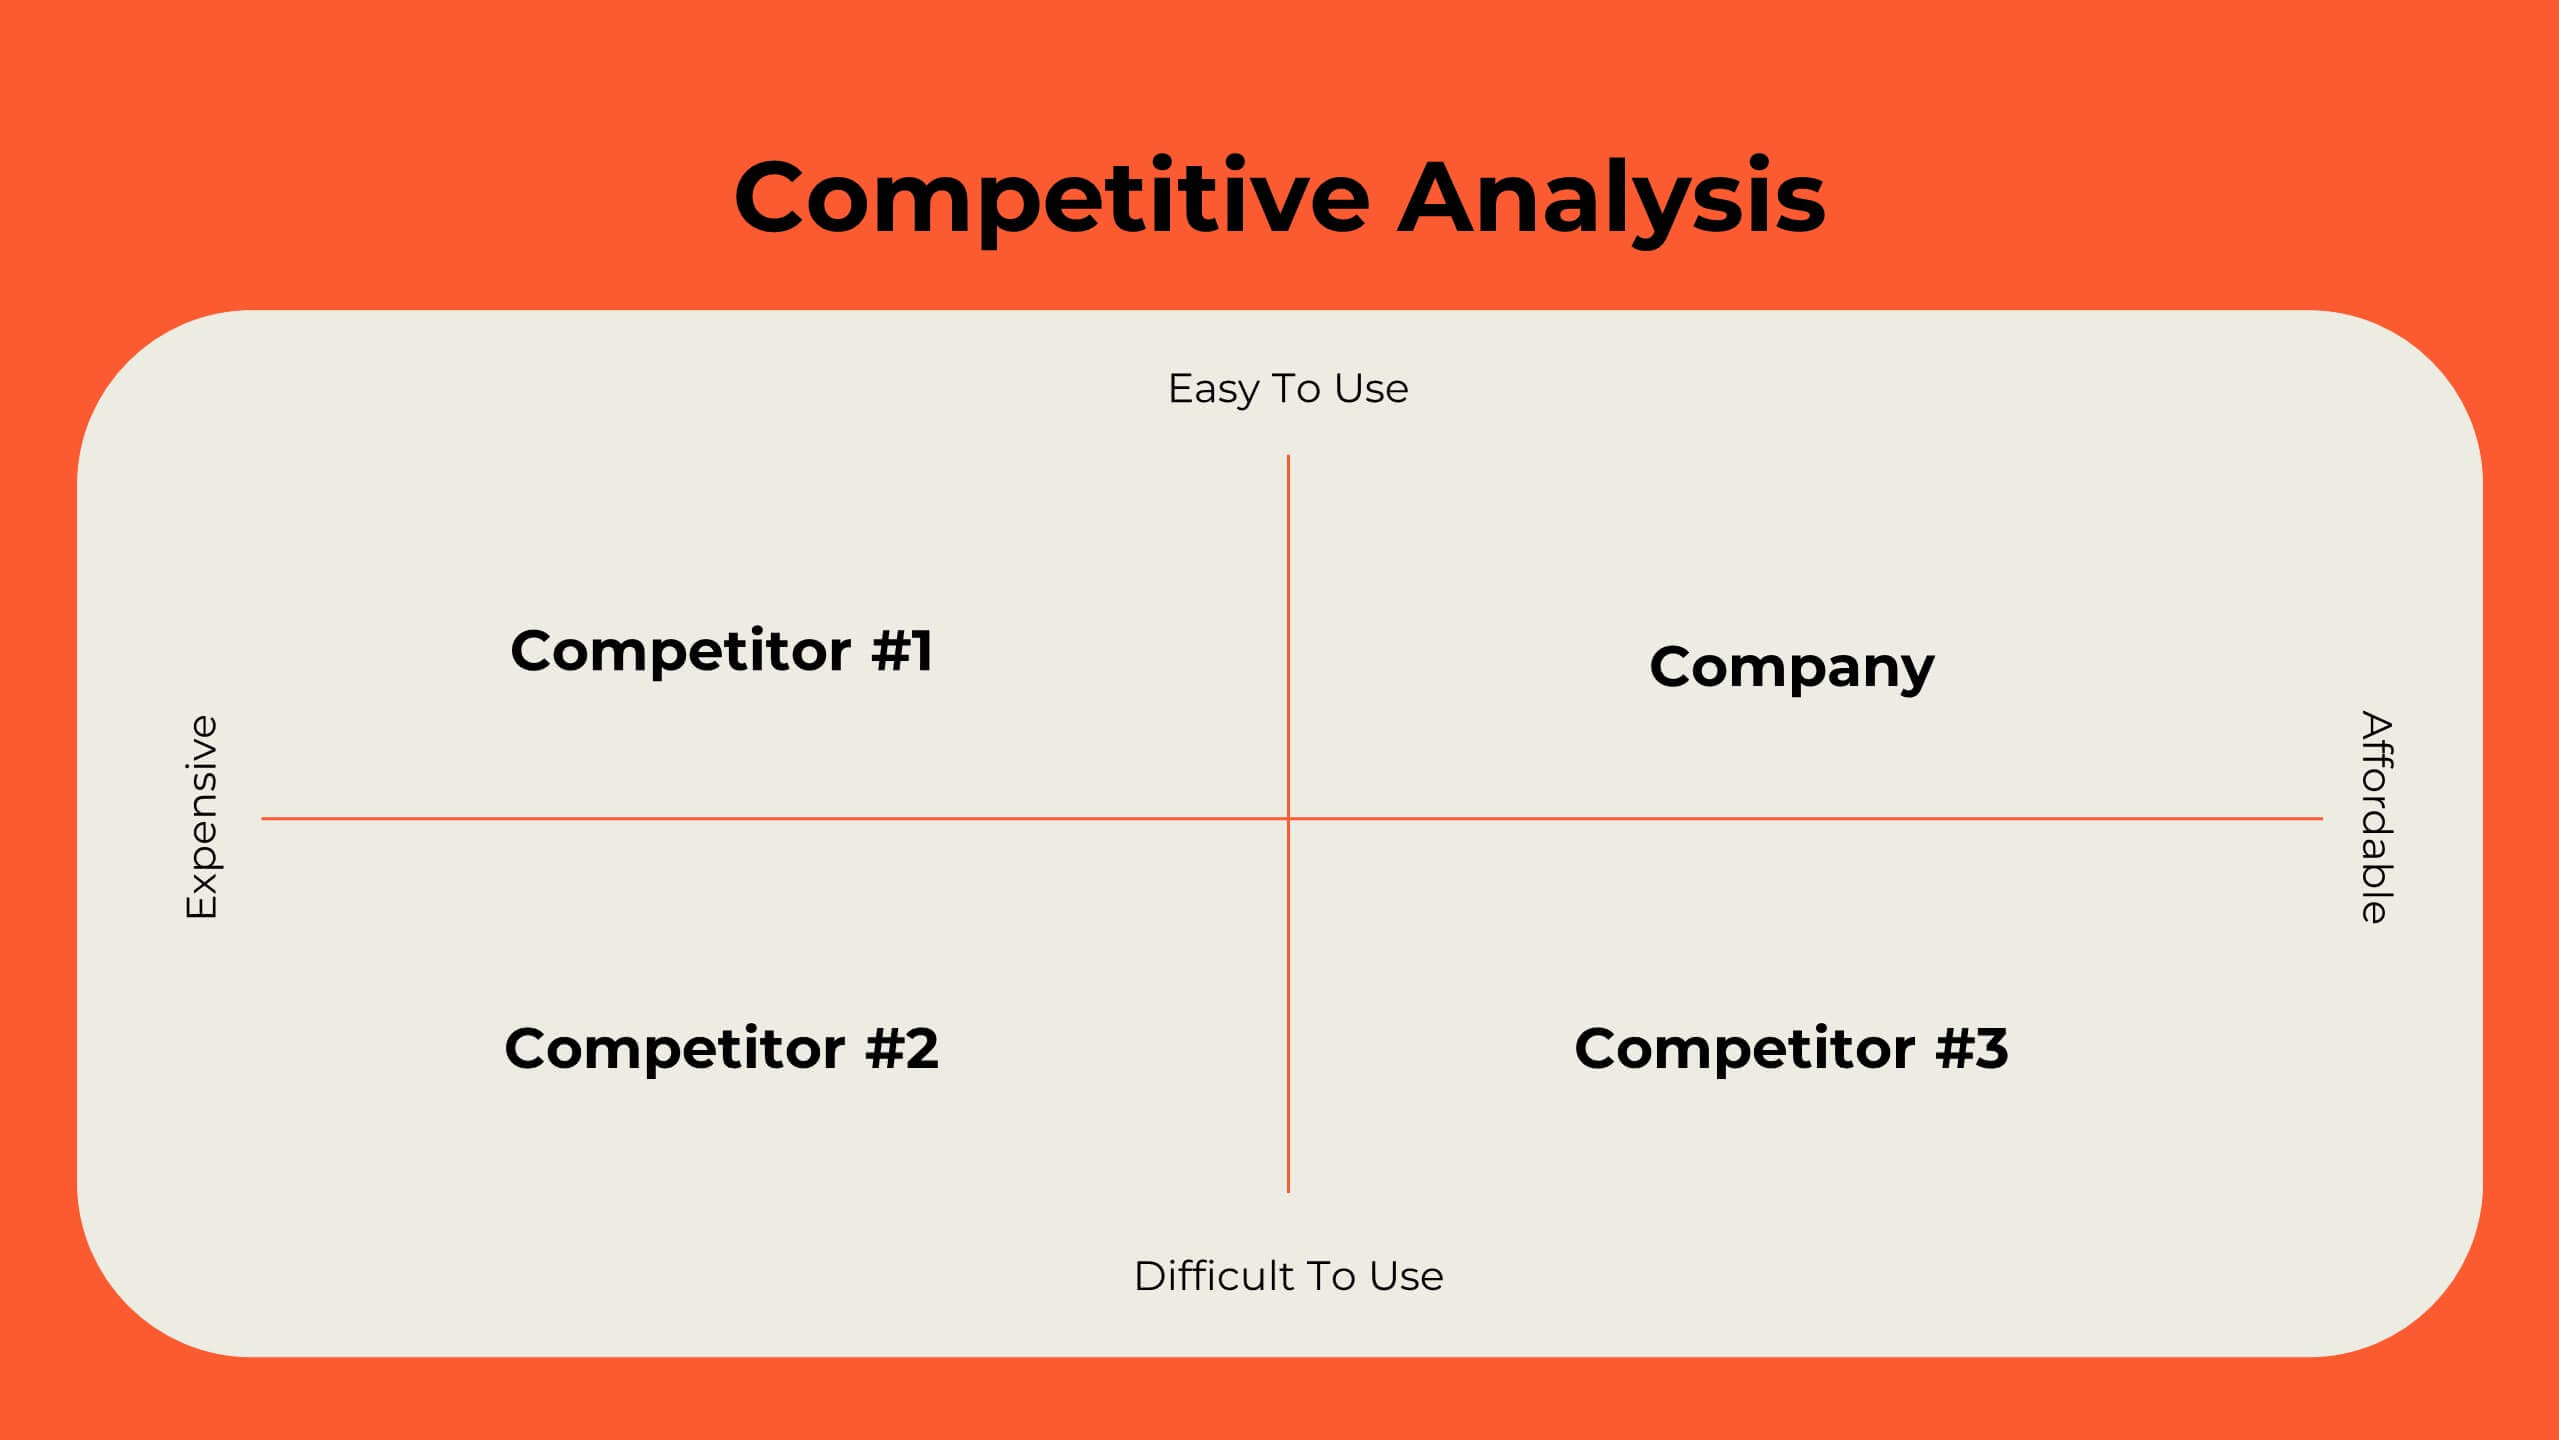
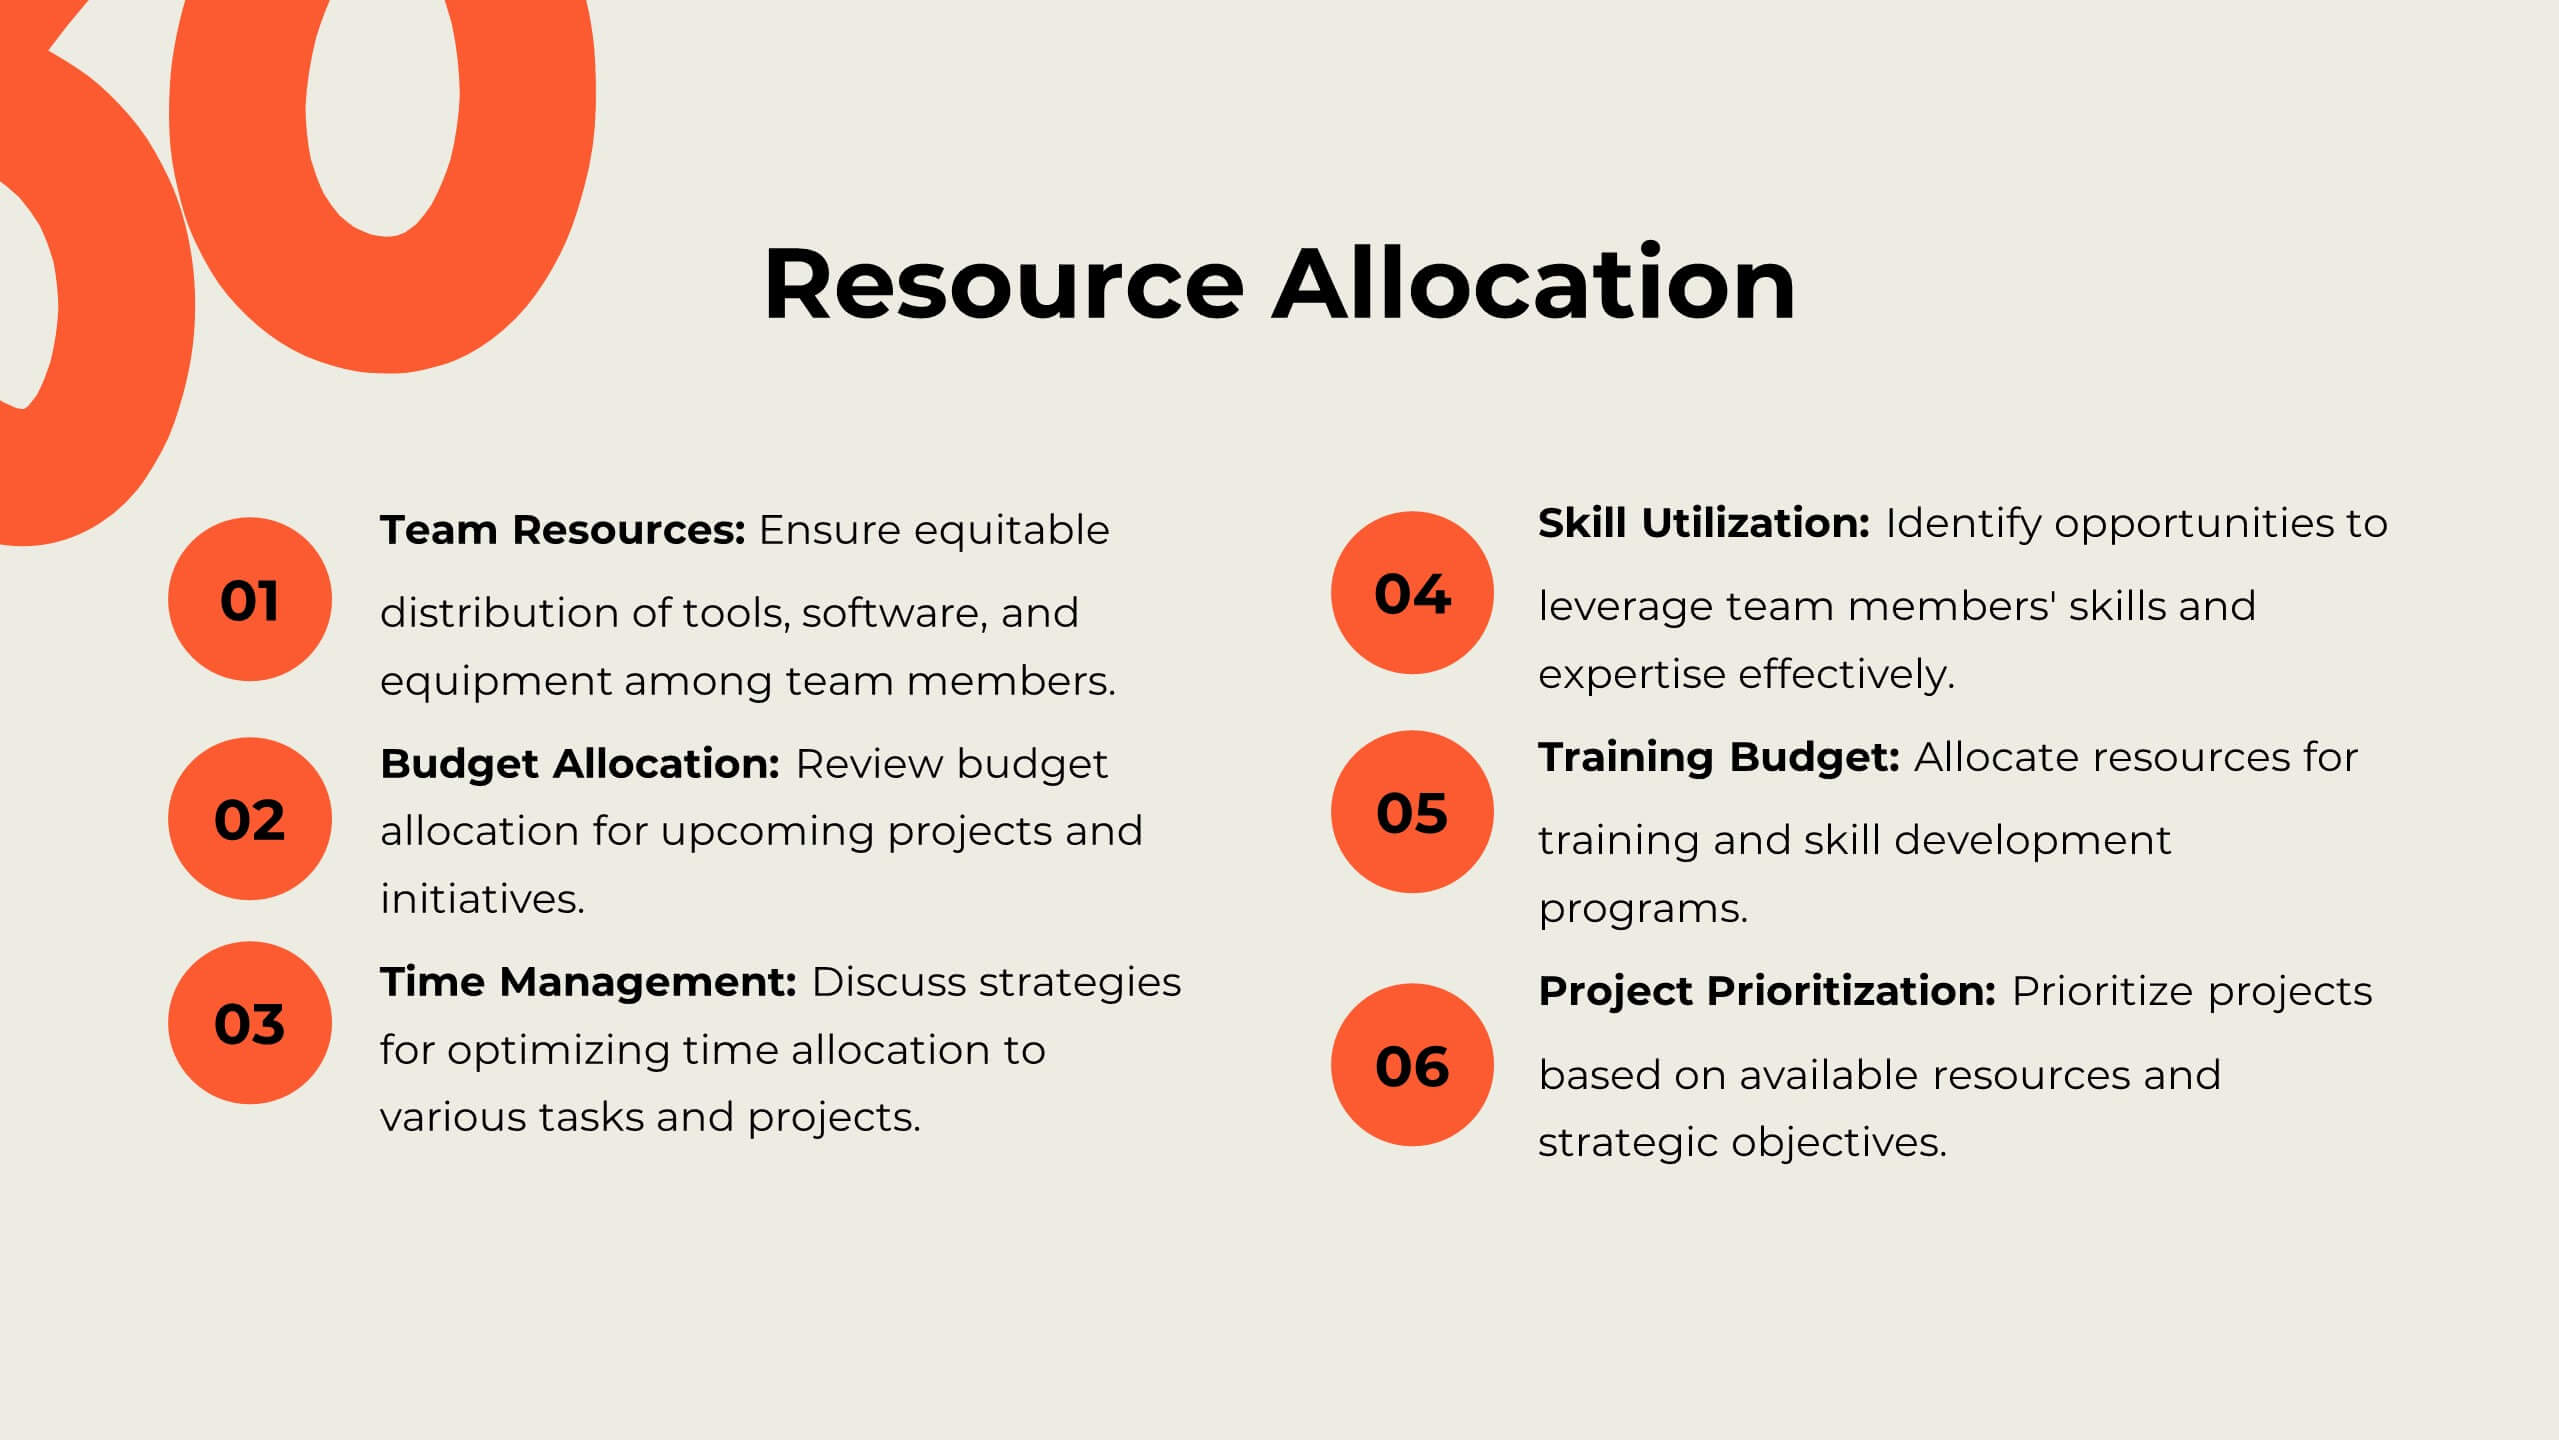
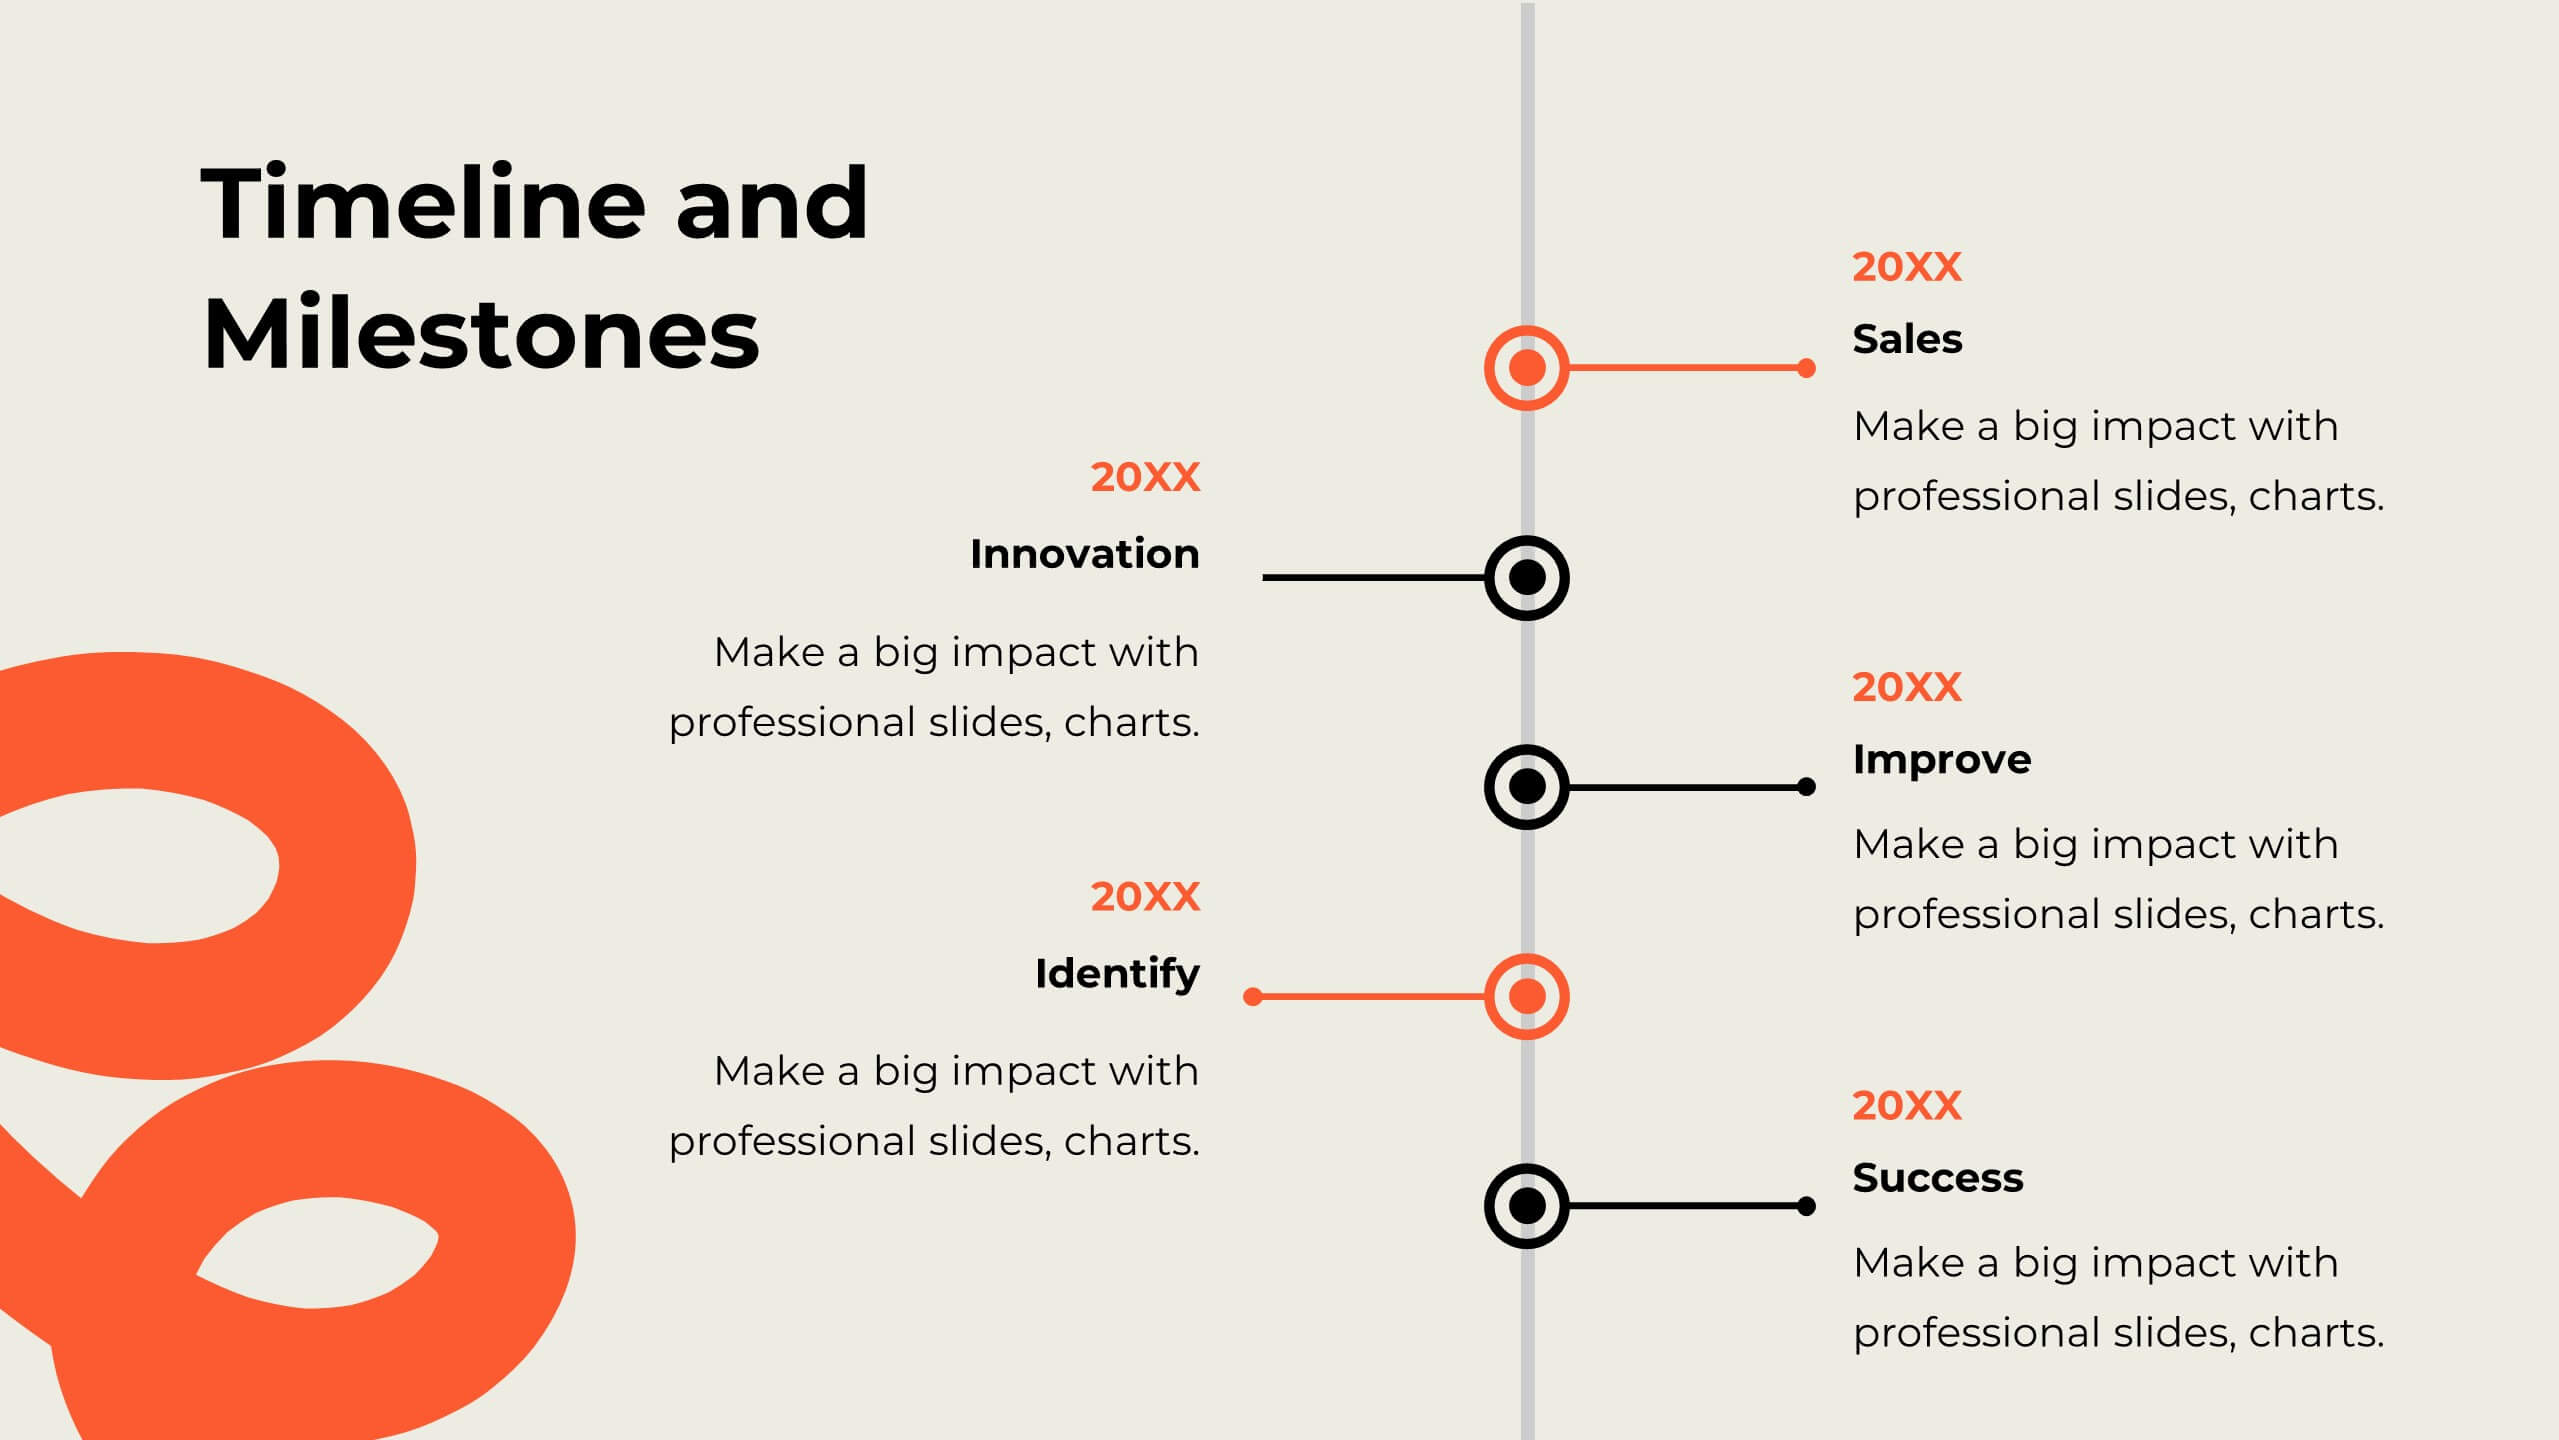
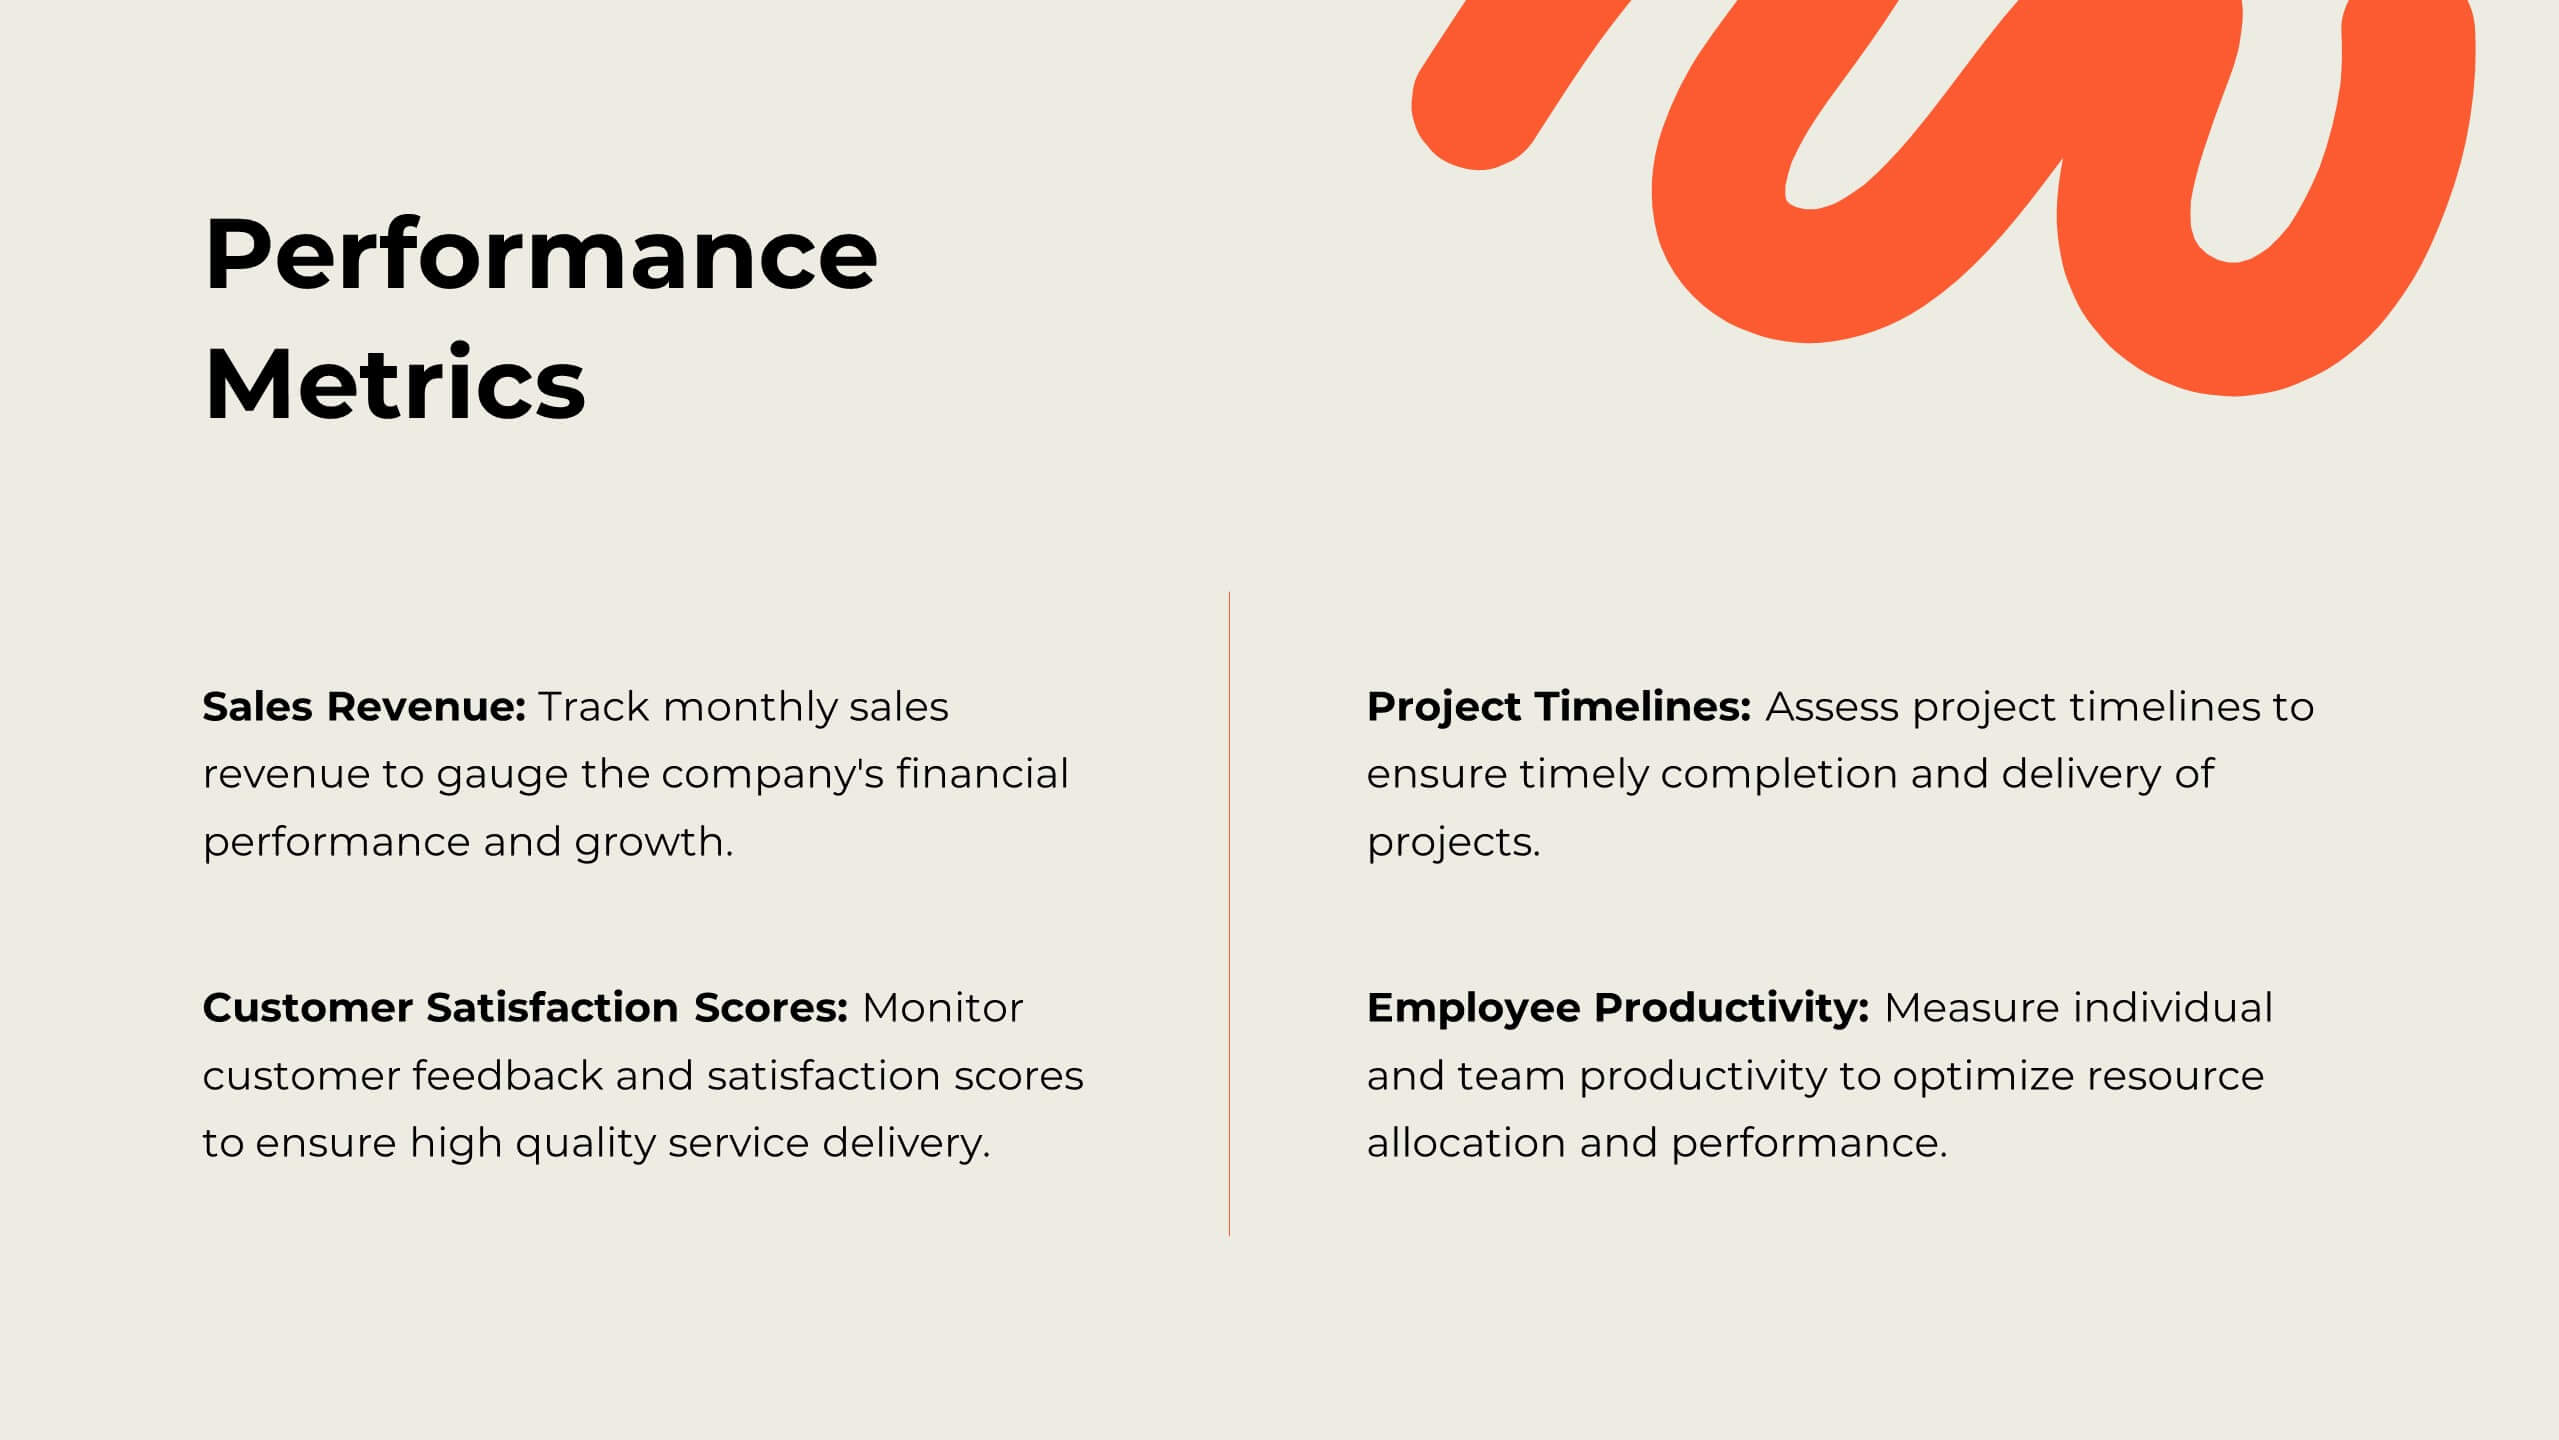
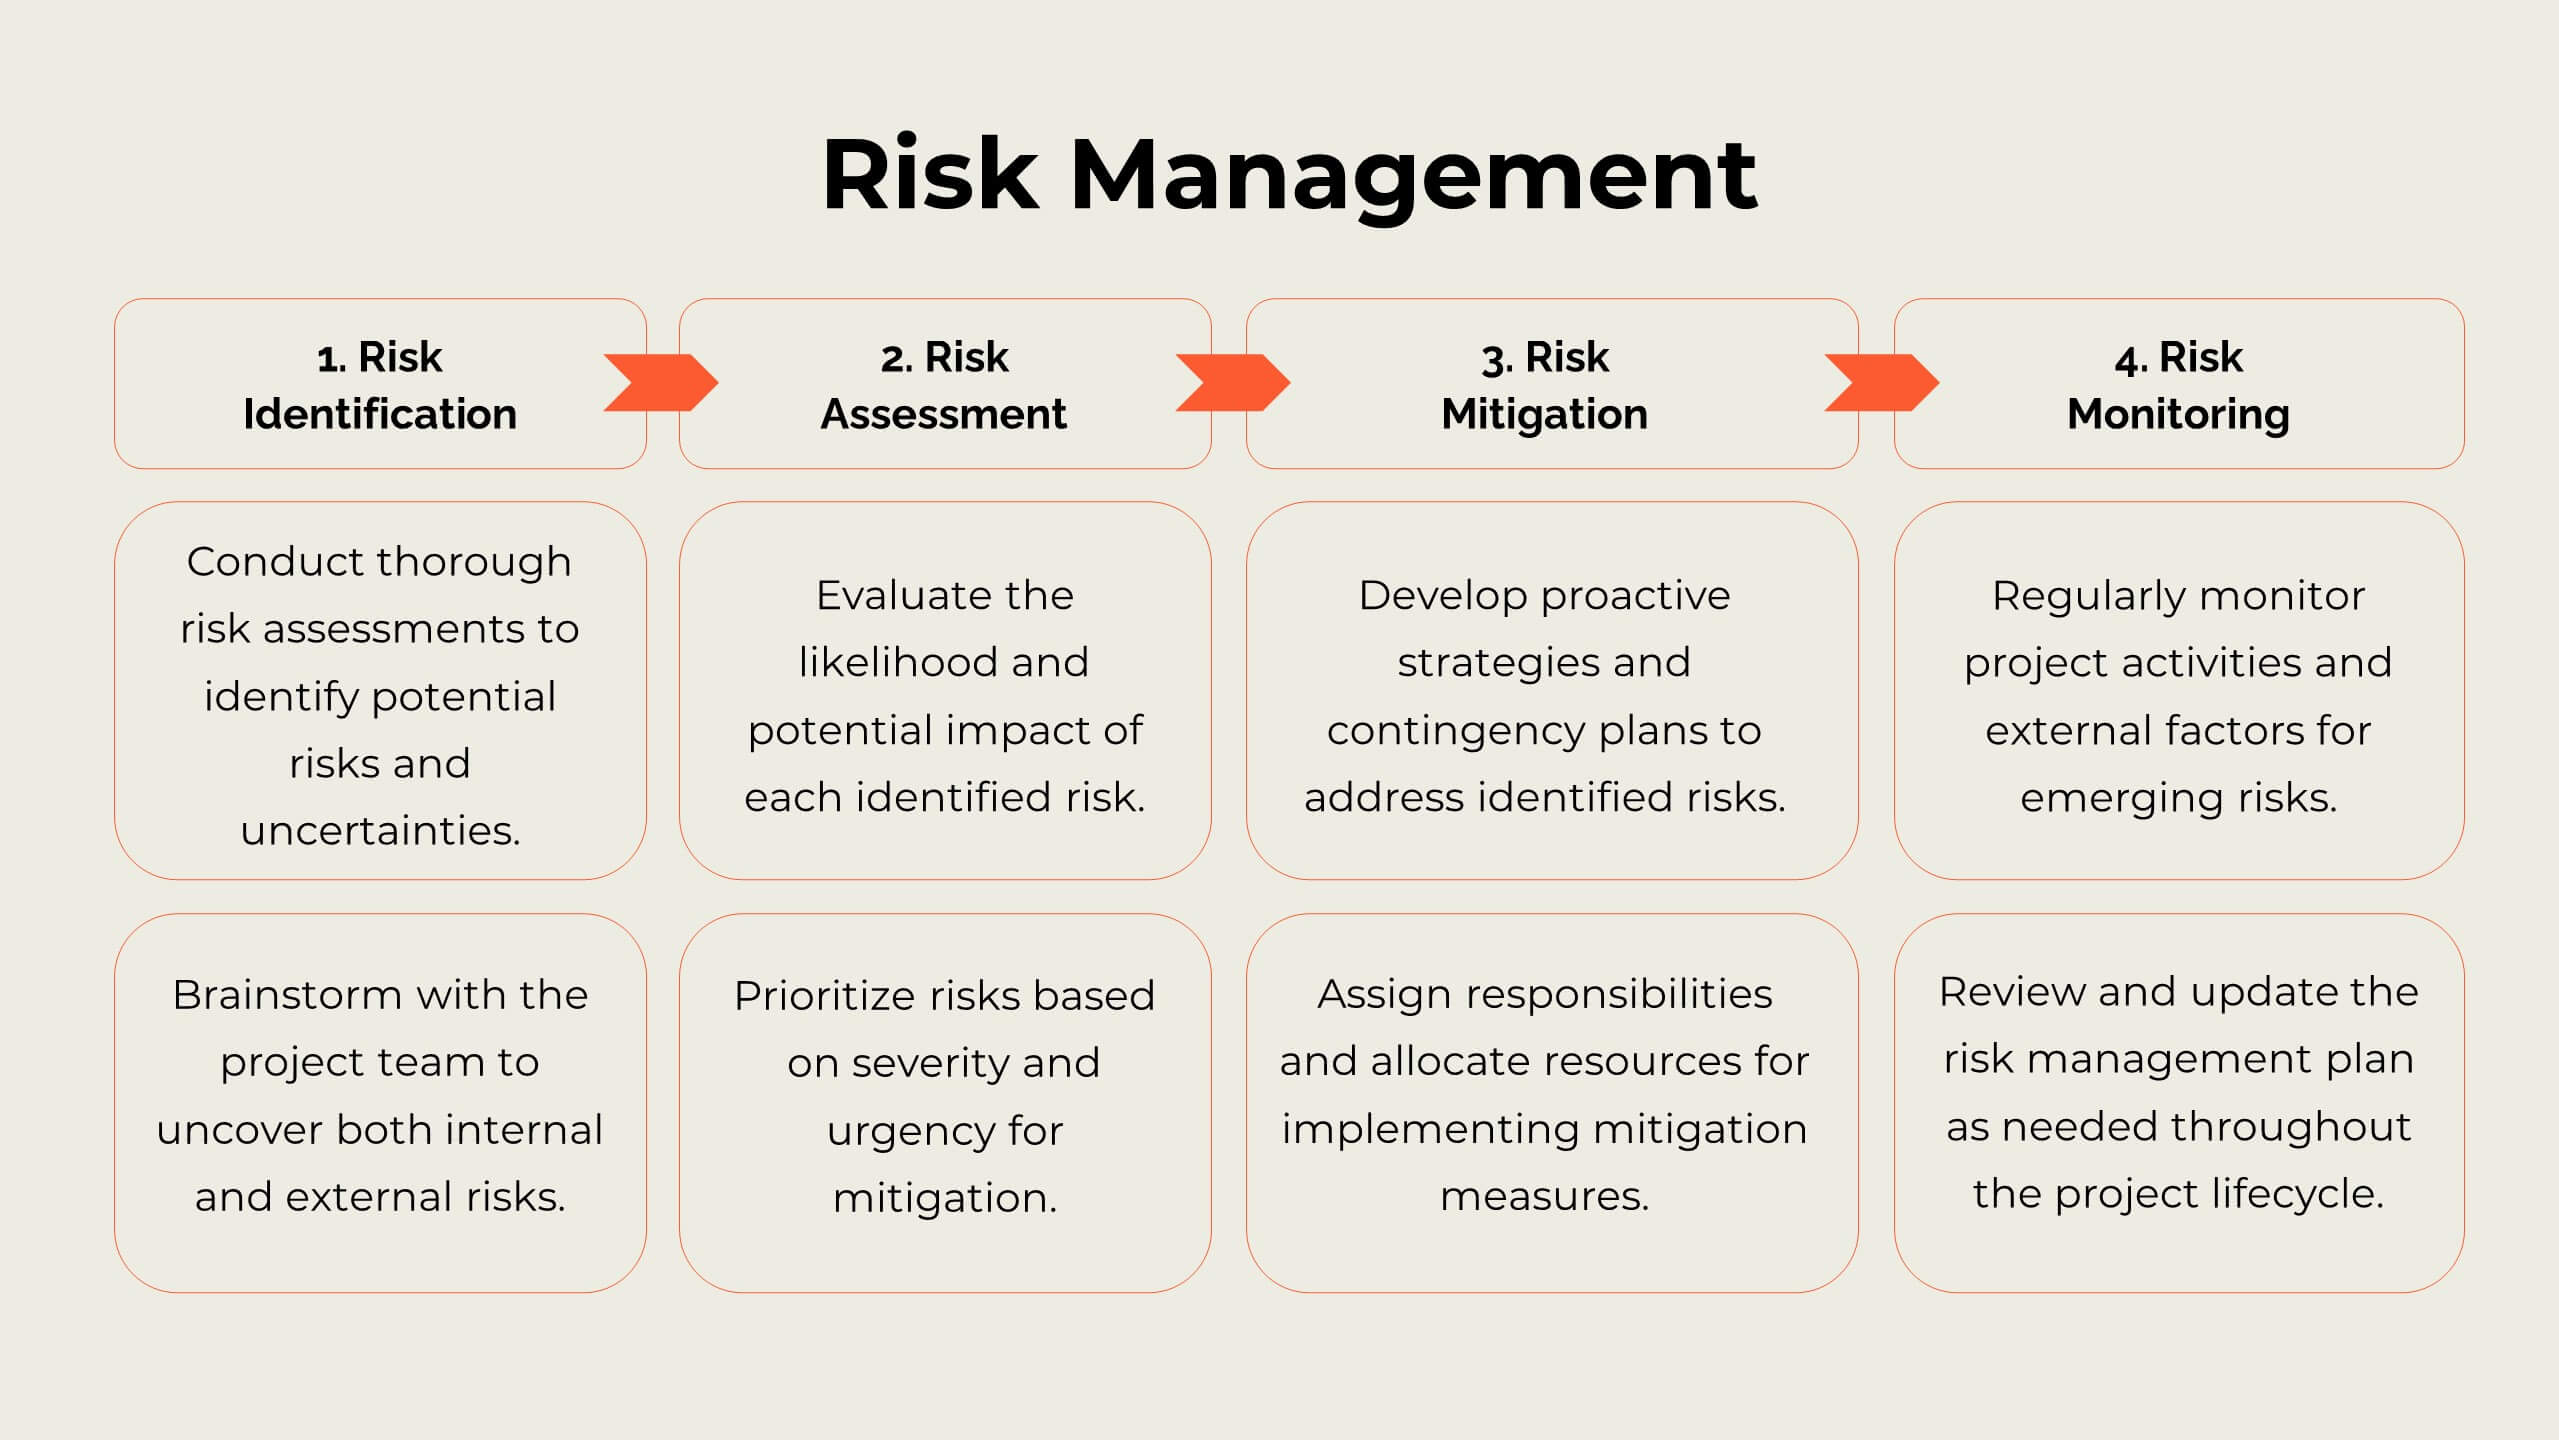
Revitalize your marketing efforts with this dynamic strategy plan template! Perfect for outlining objectives, competitive analysis, and target audience identification, it includes slides for SWOT analysis, resource allocation, and implementation plans. Engage stakeholders with vibrant visuals and comprehensive content. Compatible with PowerPoint, Keynote, and Google Slides for seamless presentations on any platform.


26 slides
Flowers Bold Company Profile Presentation
Step into the enchanting garden of happy flowers, where petals dance and colors sing. Our template, awash in sunlit shades of pink, yellow, orange, and blue, encapsulates the very essence of floral joy. Bursting with vibrant graphics, whimsical icons, and cheerful image placeholders, it's a bouquet of design brilliance. Crafted to perfection for Powerpoint, Keynote, or Google Slides. A delightful pick for florists, garden enthusiasts, event planners, or anyone looking to infuse their presentation with a touch of nature's merriment. Blossom your ideas; let your presentations bloom with happiness.


6 slides
Real Estate Property Market Overview Presentation
Present key property market insights using this structured, easy-to-follow layout. The slide features six labeled sections flanking a central house graphic—ideal for highlighting data points, regional comparisons, or investment factors. Fully customizable in Canva, PowerPoint, and Google Slides, making it perfect for real estate reports, pitches, or client presentations.


4 slides
Modern Transportation and Logistics Strategy Presentation
Move your audience through a fast-paced world of movement and delivery with a clean, visual slide that maps out each step of your logistics process. This layout helps explain workflows, supply chain stages, and transportation planning with clarity and ease. Fully compatible with PowerPoint, Keynote, and Google Slides.


5 slides
Home Investment and Property Value Presentation
Visualize key real estate insights with this skyline-themed slide, ideal for showcasing home investment data and market value trends. Designed for realtors, analysts, or housing consultants, it features a cityscape layout for clear comparison. Fully editable in PowerPoint, Keynote, and Google Slides for effortless customization and polished presentations.


19 slides
Zenith Sales Proposal Presentation
Get ready to blow your clients away with this electrifying sales proposal template! Packed with sections on project scope, bold objectives, timelines, and jaw-dropping pricing, it’s designed to make a powerful impact. The sleek, cutting-edge design ensures you’ll leave a lasting impression. Fully compatible with PowerPoint, Keynote, and Google Slides!