


Features
- 6 Unique slides
- Fully editable and easy to edit in Microsoft Powerpoint, Keynote and Google Slides
- 16:9 widescreen layout
- Clean and professional designs
- Export to JPG, PDF or send by email


Do you have any questions?
Recommend


4 slides
Investor Business Plan One-Pager Presentation
Present your startup vision with clarity using this Investor Business Plan One-Pager. Designed to outline key milestones, growth projections, and funding goals, it’s perfect for pitch decks and investor briefs. Visually dynamic and fully customizable, this one-slide format works seamlessly in PowerPoint, Keynote, and Google Slides—ideal for entrepreneurs and startups.


20 slides
Novelix Graphic Design Project Plan Presentation
Elevate your design projects with this modern and stylish presentation template. Covering key areas such as concept development, design elements, prototypes, and project timelines, it provides a structured approach to presenting creative work. Perfect for designers and agencies alike. Compatible with PowerPoint, Keynote, and Google Slides for effortless customization.


4 slides
Identifying Performance Gaps
Clearly showcase the steps needed to bridge critical performance gaps with this modern template. Ideal for strategic planning, business reviews, and goal-setting sessions. Highlight each stage of growth with dynamic visuals. Fully customizable for PowerPoint, Keynote, and Google Slides.


8 slides
Effective Team Building Model Presentation
Visualize your strategy for collaboration with the Effective Team Building Model Presentation. This layered block layout is perfect for illustrating step-by-step frameworks, progressive strategies, or hierarchical team development stages. Clean, modern, and color-coded for clarity, it's ideal for internal planning, training, or leadership presentations. Fully editable in PowerPoint, Keynote, Canva, and Google Slides.


6 slides
Modern Business Strategy Presentation
Bring your ideas to life with a sleek, forward-thinking presentation designed to communicate business growth and strategic planning. Ideal for outlining goals, performance steps, and innovation roadmaps, this clean and modern layout ensures every concept stands out. Fully compatible with PowerPoint, Keynote, and Google Slides for easy customization.


5 slides
Actionable Steps for Team Execution Presentation
Highlight progress and key insights with the Actionable Steps for Team Execution Presentation. This vertically stacked arrow slide uses five colorful blocks ascending upward to represent steps, milestones, or growth metrics. Each step includes space for a title and description to clearly outline tasks or performance trends. Ideal for showcasing team roadmaps, strategic plans, or KPIs. Compatible with PowerPoint, Keynote, and Google Slides.


5 slides
Business Plan Infographics
Elevate your strategic approach with the business plan infographics template. Cast in the motivational hues of orange, purple, and green, this template breathes life into your business strategy, illustrating your plan's potential. Entrepreneurs and corporate strategists will find this creative, vertical-style infographic an invaluable ally in conveying complex business plans with simplicity and visual flair. Compatible with Powerpoint, Keynote, and Google Slides. This dynamic template comes complete with innovative graphics, thematic icons, and designated image placeholders, all fashioned to articulate your business journey. Utilize this tool to captivate your audience.


5 slides
5G Wireless Technology Infographics
5G technology refers to the fifth generation of wireless communication technology. These infographic templates are designed to showcase the key features, benefits, and impact of 5G technology. These are perfect for technology enthusiasts, professionals, educators, or anyone looking to explain the concept and advancements of 5G. Educate and inform your audiences about the concept, benefits, and applications of 5G technology with these infographics. It is fully customizable and has attention-grabbing design elements making it easy to create a compelling presentation about the advancements and potential of 5G technology.


6 slides
Public Healthcare System Strategy Presentation
Present key components of your medical or government plan with the Public Healthcare System Strategy Presentation. This clean and modern slide design uses a heart-centered layout with five surrounding icons to highlight core pillars—perfect for policy updates, strategy overviews, or health service workflows. Fully editable in Canva, PowerPoint, Keynote, and Google Slides.


6 slides
Technology Trends Overview Presentation
Step into the future with a sleek visual that maps out emerging ideas in a way anyone can follow. This presentation helps you break down key innovations, highlight major shifts, and explain how new technologies influence your strategy. Ideal for reports and trend discussions. Fully compatible with PowerPoint, Keynote, and Google Slides.


26 slides
Jewelry Elegant Company Profile Presentation
Immerse yourself in the dazzling world of jewelry, where gems and craftsmanship create timeless elegance. Our template, exuding luxury in shades of brown and orange, embodies the modern elegance and aesthetic charm of fine jewelry. Enhanced with chic graphics, bespoke icons, and evocative image placeholders, it mirrors the allure of precious metals and stones. Seamlessly adapted for Powerpoint, Keynote, or Google Slides. A shimmering choice for jewelry brands, boutique owners, designers, or anyone seeking to showcase the sparkle and artistry of jewelry. Illuminate your brand; let each jewel tell its story.

19 slides
Tidal Design Proposal Presentation
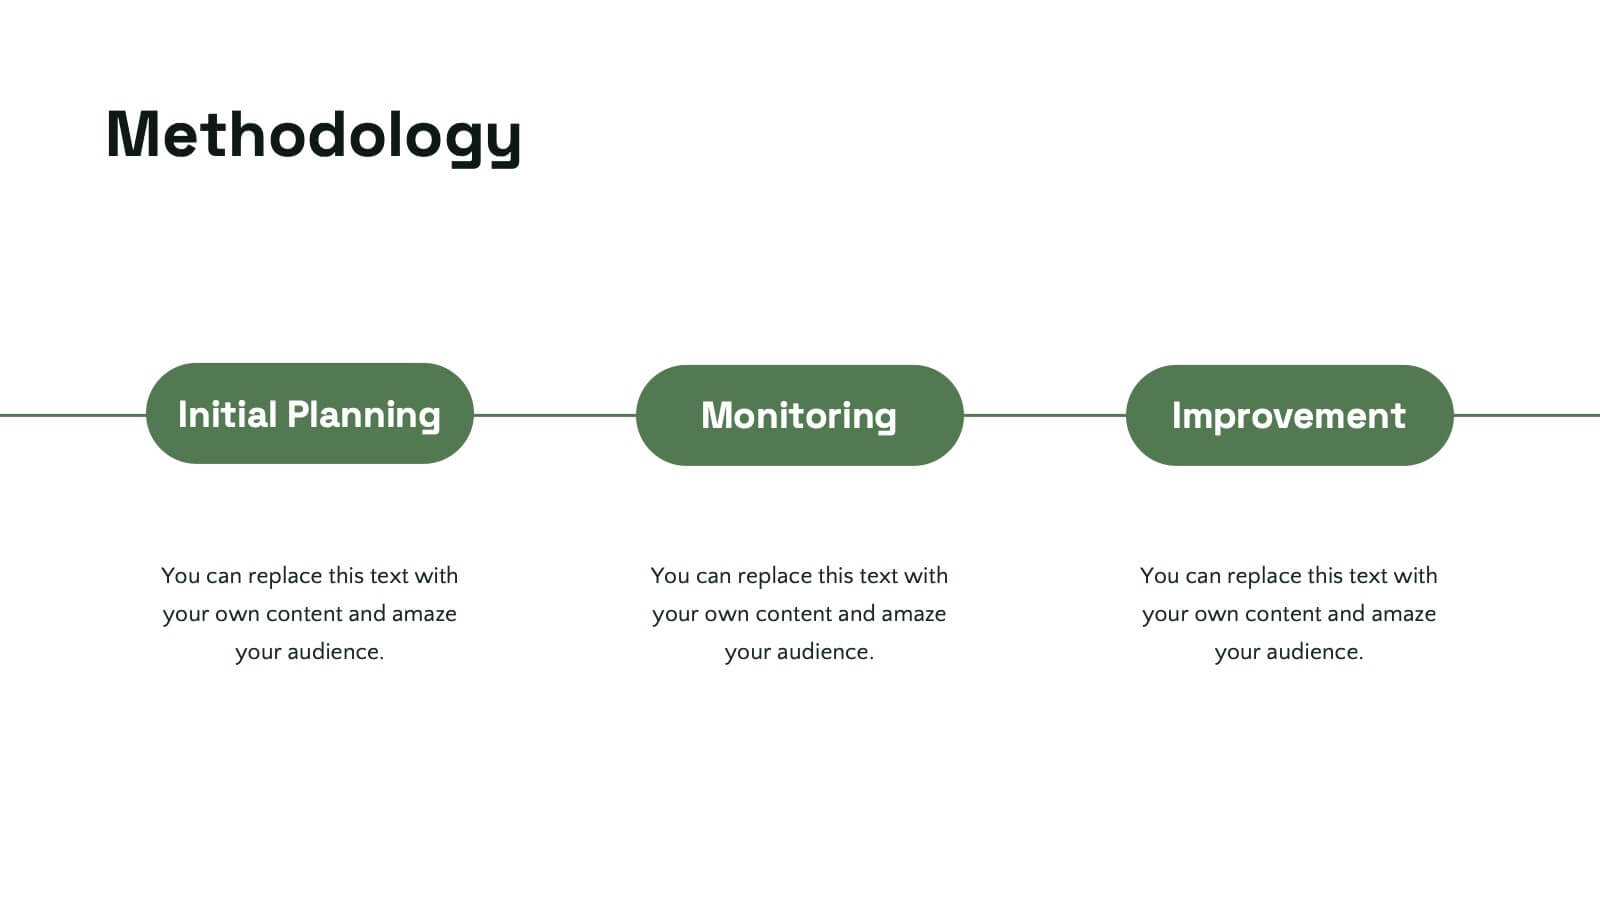
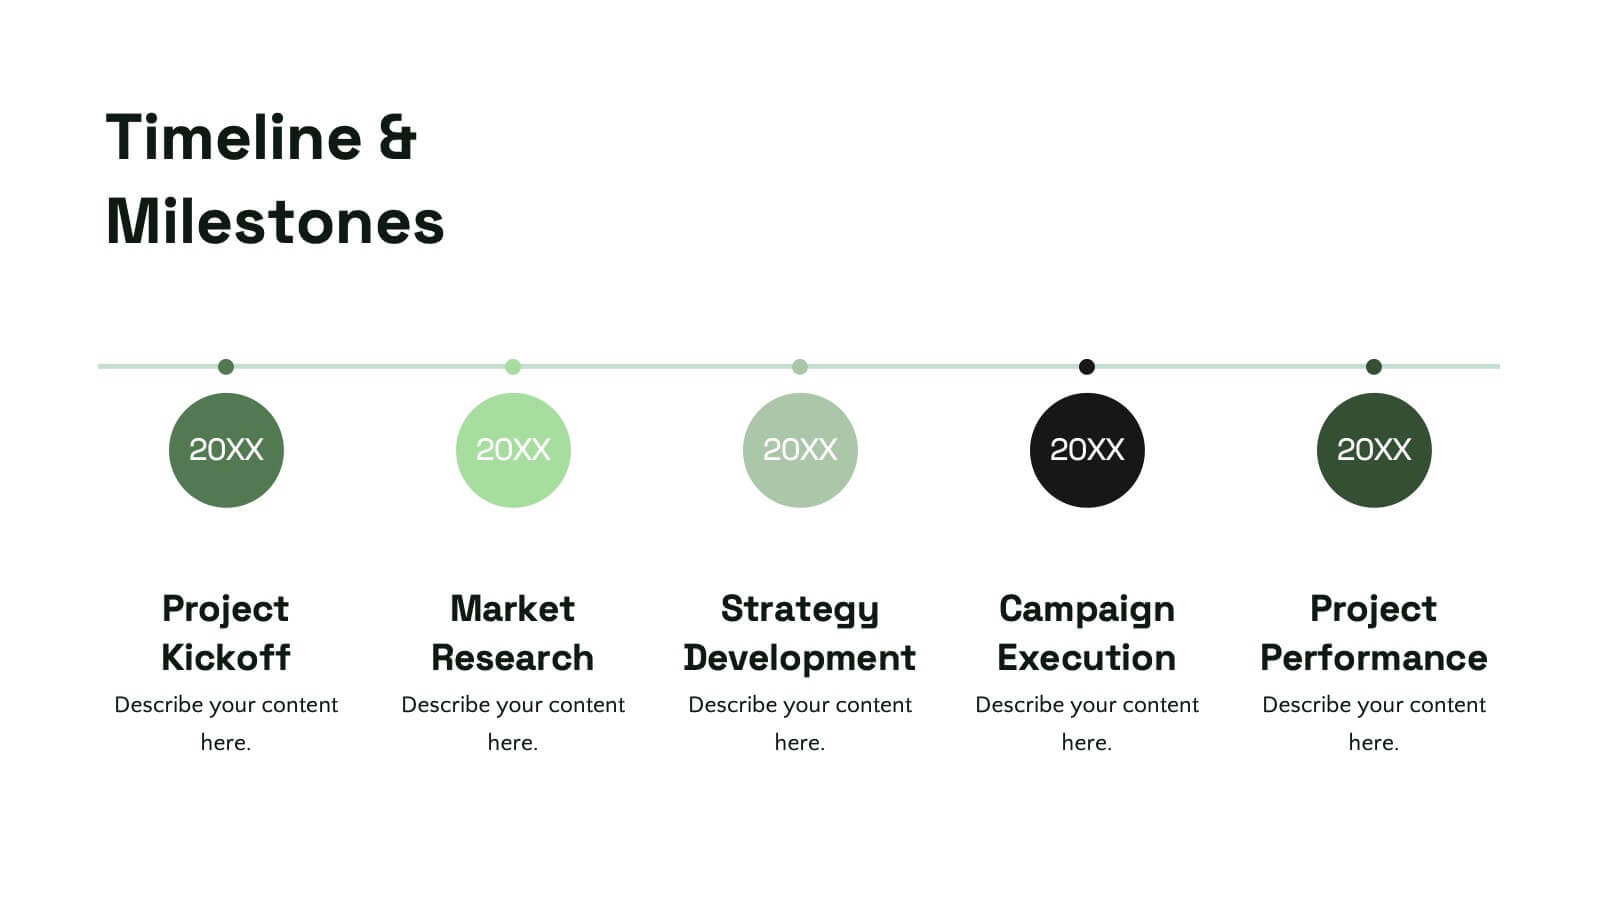
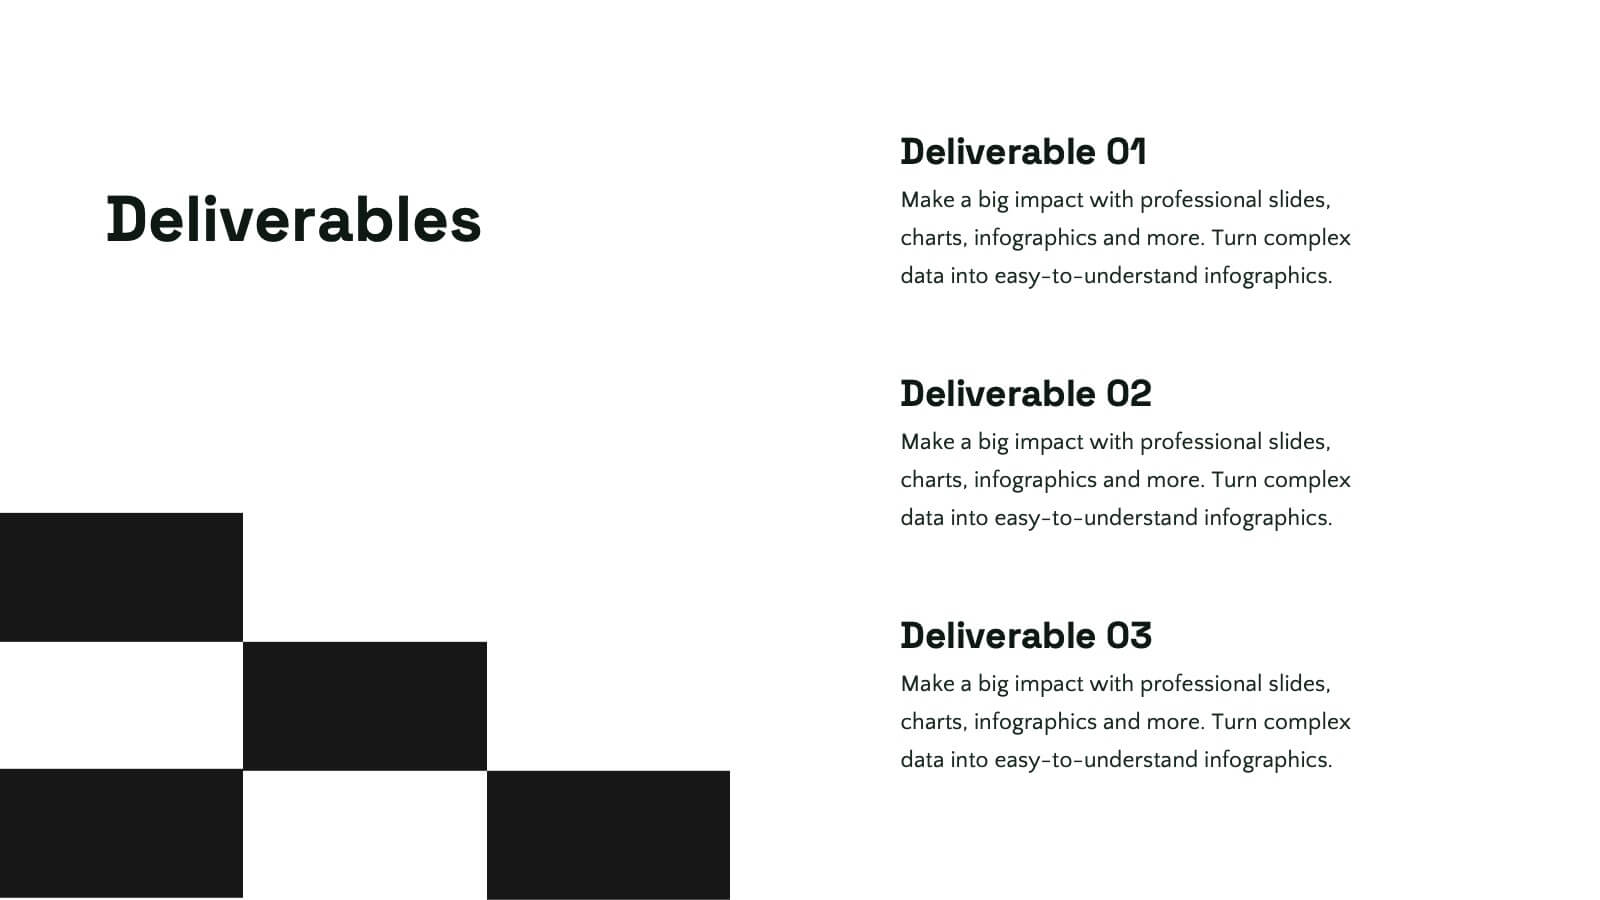
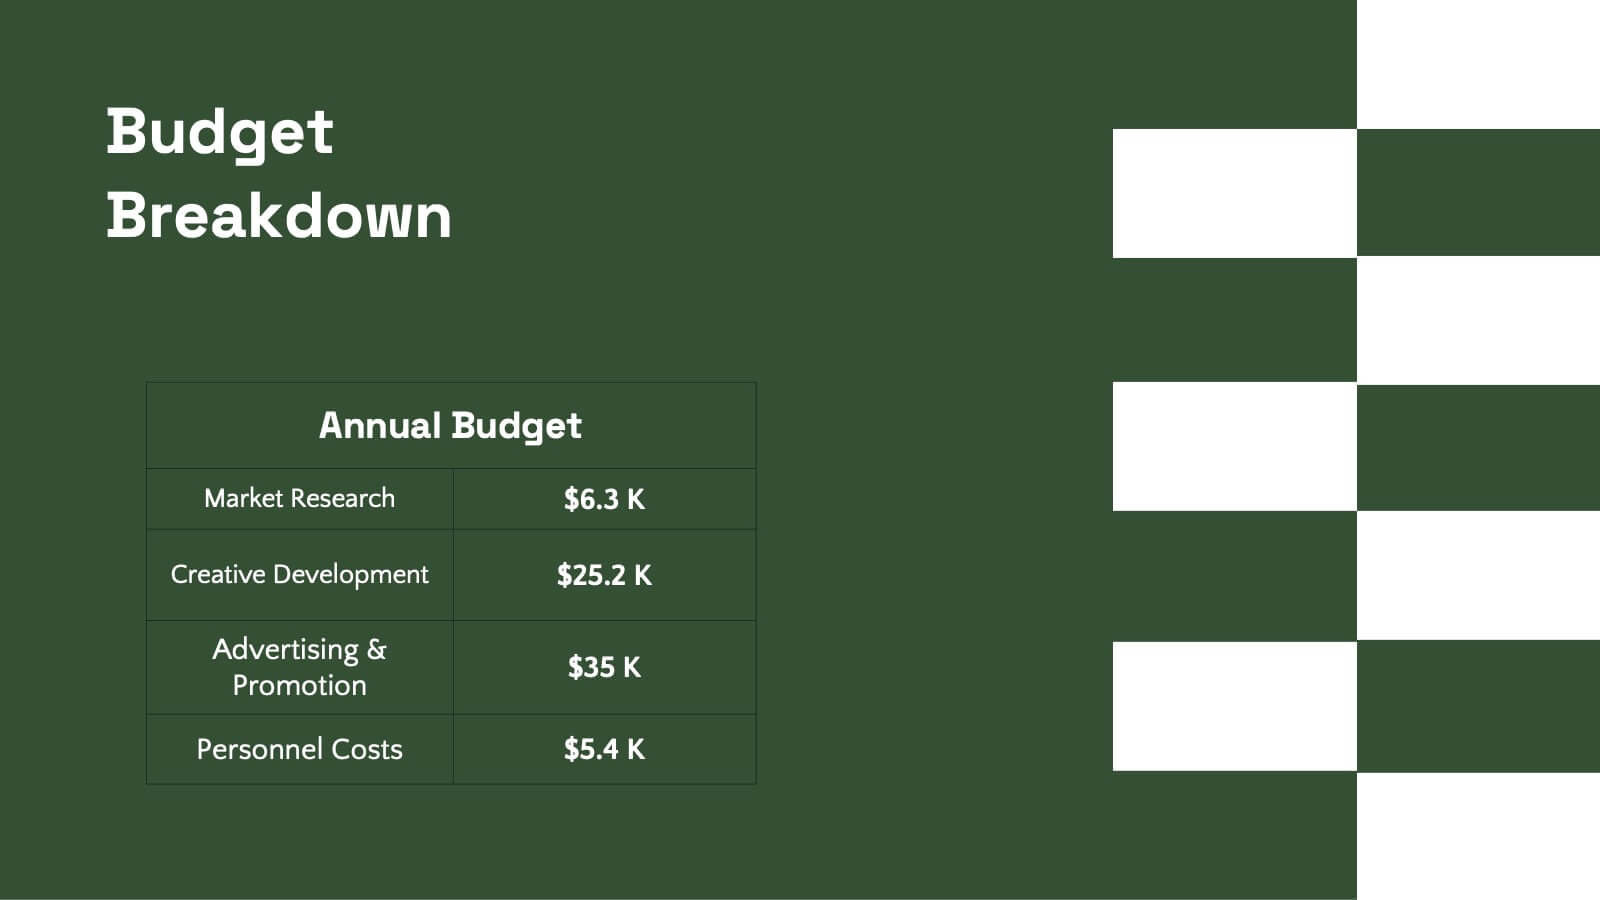
Elevate your pitch with this sleek design proposal template! Perfect for presenting project details, objectives, methodology, and milestones, it ensures your ideas stand out. Impress stakeholders with clear, structured slides and professional aesthetics. Compatible with PowerPoint, Keynote, and Google Slides for a seamless presentation experience across all platforms.


4 slides
IT Infrastructure Overview Presentation
Map out your digital ecosystem with this IT Infrastructure Overview Presentation. Featuring a cloud-based diagram with interconnected folders and icons, this slide helps communicate key components of your organization’s infrastructure—from servers and databases to networks and cloud solutions. Great for explaining system architecture or IT service flows. Fully customizable in PowerPoint, Keynote, and Google Slides.


8 slides
Benefits Table Template
Optimize your presentation of complex options with our "Benefits Table Template." Designed to clearly distinguish between different plans, this template enables you to showcase Plan A, Plan B, and Plan C with ease. Each column is distinctively colored and detailed to ensure your audience can grasp the variances in benefits at a glance. Ideal for comparing packages, costs, or strategic choices in a corporate setting, this template helps clarify decision-making processes. Compatible with PowerPoint, Keynote, and Google Slides, it is an invaluable tool for business analysts, sales teams, and marketers aiming to communicate effectively with their stakeholders.


6 slides
Porter's Five Forces Market Analysis Presentation
Gain a competitive edge with this Porter's Five Forces market analysis template! Designed to help businesses assess industry dynamics, this structured layout highlights competitive rivalry, supplier power, buyer influence, new market entries, and substitute threats. Perfect for strategists and analysts. Fully customizable and compatible with PowerPoint, Keynote, and Google Slides.


12 slides
Geometric Shapes Design Slide Presentation
Make your content stand out with a bold, modern layout built from clean geometric forms that guide the viewer’s eye effortlessly. This presentation helps you organize ideas, highlight key points, and create a polished visual flow without distractions. Fully editable and compatible with PowerPoint, Keynote, and Google Slides.


5 slides
Operational Process Logic Map
Visualize how every function interconnects with the Operational Process Logic Map Presentation. This template uses a radial node structure to break down workflows, responsibilities, or systems into logical clusters, showing how different units or steps interact within an operational framework. Each node is color-coded and icon-marked for clarity, ideal for explaining process flows, department roles, or system dependencies. Fully editable in PowerPoint, Keynote, and Google Slides.