


Features
- 5 Unique slides
- Fully editable and easy to edit in Microsoft Powerpoint, Keynote and Google Slides
- 16:9 widescreen layout
- Clean and professional designs
- Export to JPG, PDF or send by email


Do you have any questions?
Recommend


22 slides
Mistgrove Digital Agency Strategy Plan Presentation
Craft an impactful strategy for your digital agency with this sleek and professional presentation template. Highlight your agency's mission, vision, and services while showcasing success stories through client testimonials and case studies. Dive into essential sections like market analysis, industry trends, and competitive positioning to communicate a forward-thinking strategy effectively. This template includes dedicated slides for creative processes, strategy development, and campaign execution, ensuring you present your approach clearly and confidently. With options for measurement and analytics, future outlooks, and social impact initiatives, it empowers you to convey the value and growth potential of your strategies. Fully compatible with PowerPoint, Google Slides, and Keynote, this template offers seamless customization to align with your agency's unique brand identity and goals.


8 slides
Root Cause Visual via Ishikawa Method
Clarify root causes and drive actionable solutions with the Root Cause Visual via Ishikawa Method Presentation. This fishbone-style infographic layout uses six categorized nodes mapped directly to a streamlined fish silhouette, ideal for visualizing complex problems. Easily editable in PowerPoint, Keynote, and Google Slides.


7 slides
Company Structure Infographic
Company structure, often referred to as organizational structure, outlines how a company is organized in terms of hierarchy, roles, responsibilities, and the flow of information. Discover the inner workings of your organization with our Company Structure Infographic. This visually captivating and informative infographic serves as a guide to understanding the hierarchical layout, roles, and relationships within your company. Compatible with Powerpoint, Keynote, and Google Slides. Illustrate the structure levels within the company, showcasing the roles and responsibilities at each level and how they contribute to the company's success.


5 slides
Medical Technology Infographics
Medical Technology refers to the use of innovative technologies, devices, and systems in healthcare to improve patient care, diagnosis, treatment, and overall healthcare delivery. These infographics are comprehensive and visually appealing designs that allow you to showcase the advancements and impact of medical technology in the healthcare industry. This template is perfect for presentations, reports, or educational materials related to medical technology. The template includes various vertical infographic elements that allow you to highlight the benefits, applications, and advancements in medical technology.


21 slides
Starforge Project Status Report Presentation
This Project Status Report Presentation template provides a professional and structured format to track progress, review performance metrics, and outline key achievements. Ideal for business updates, it covers agenda, financial summary, goals review, and next steps. Fully customizable and compatible with PowerPoint, Keynote, and Google Slides for effortless editing.


6 slides
DMAIC Six Sigma Framework Presentation
Dive into process perfection with our DMAIC Six Sigma Framework template! This visually appealing guide breaks down each phase—Define, Measure, Analyze, Improve, and Control—making it easier to streamline operations and enhance quality. Fully compatible with PowerPoint, Keynote, and Google Slides, it's designed for professionals dedicated to operational excellence and continuous improvement.


26 slides
Modern Company Profile Striped Presentation
Present your company with style, our modern company profile presentation, is the perfect template to showcase your business in a contemporary and stylish way. This template combines professionalism with a touch of flair and striped elements, making it ideal for modern businesses looking to make a lasting impression. Ideal for tech startups, creative agencies, or a professional service firms, this presentation will help you convey your company's professionalism. Fully customizable and compatible with Powerpoint, Keynote, and Google Slides. This makes it easy for potential clients, partners, and investors to reach out!


8 slides
Health and Safety Training
Create impactful safety briefings with this visual slide designed around a caution-sign layout. Perfect for outlining training modules, compliance steps, or workplace hazard procedures, it presents four key points using icons and color-coded elements. Fully customizable in PowerPoint, Keynote, and Google Slides.


5 slides
Root Cause Business Problem Slide
Uncover the foundation of complex challenges with this tree-inspired slide—perfect for visualizing root causes behind business problems. Showcase contributing factors at each root to guide effective solutions. Fully editable in PowerPoint, Keynote, and Google Slides.


5 slides
5-Step Business Optimization Plan Presentation
Showcase your improvement roadmap using this 5-step building block diagram. Perfect for illustrating sequential development, each step is styled like interlocking bricks to convey progress and structure. Fully editable in PowerPoint, Keynote, and Google Slides—ideal for strategic planning, process optimization, and business growth presentations needing a clear step-by-step layout.


6 slides
Business Growth and Progress Report Presentation
Visualize business success with clarity using this Business Growth and Progress Report template. This puzzle-style infographic illustrates the interconnected steps of development, making it ideal for performance tracking, quarterly reports, and strategic planning. Fully customizable—adjust colors, labels, and data points to align with your business metrics. Compatible with PowerPoint, Keynote, and Google Slides for effortless integration into your presentations.


5 slides
Space Race Infographics
The Space Race refers to the competition between the United States and the Soviet Union during the Cold War era to achieve milestones in space exploration and technology. These vertical infographics are informative resources that explore the historic space race. They are designed to present key facts, milestones, and achievements of this significant period in space exploration history. The template features a captivating design with space-themed visuals, cosmic colors, and modern typography. The visuals are carefully selected to depict iconic spacecraft, astronauts, celestial bodies, and other relevant elements, creating an immersive infographic experience.


6 slides
Clarifying Questions and Response Slide Presentation
Help your audience follow complex topics with the Clarifying Questions and Response Slide Presentation. Designed around a bold question mark layout, this slide format highlights five key clarifications or FAQs alongside thoughtful responses. Ideal for training, onboarding, or product demos, it enhances understanding and engagement. Fully editable in Canva, PowerPoint, Keynote, and Google Slides.


4 slides
Executive Data Overview Dashboard Presentation
Drive informed decision-making with the Executive Data Overview Dashboard Presentation. This sleek, data-centric slide layout features clean blocks for KPIs, progress percentages, and simple bar or donut charts—ideal for summarizing business insights, performance metrics, or operational updates. Fully editable in PowerPoint, Keynote, and Google Slides, it's designed for clarity, speed, and high-level reporting.


7 slides
Market Focus and Demographic Insights Presentation
Present your audience data with clarity using this Market Focus and Demographic Insights presentation. Designed with a central persona and six key data points, this slide helps visualize customer characteristics, behavioral trends, and strategic targets. Great for marketing, branding, or investor decks. Fully editable in Canva, PowerPoint, and Google Slides.


7 slides
Pyramid Infographic Presentation Template
A Pyramid Infographic is a type of representation that uses a pyramid shape to organize and present information in a hierarchical manner. The top of the pyramid represents the most important or main idea and the levels below it represent sub-ideas or details that support the main idea. With this template you can show the relationship between different levels of information or to illustrate the main points of a topic in a simple and easy way, perfect for business, education, and marketing. This template will help you organize your information and make it more understandable.


22 slides
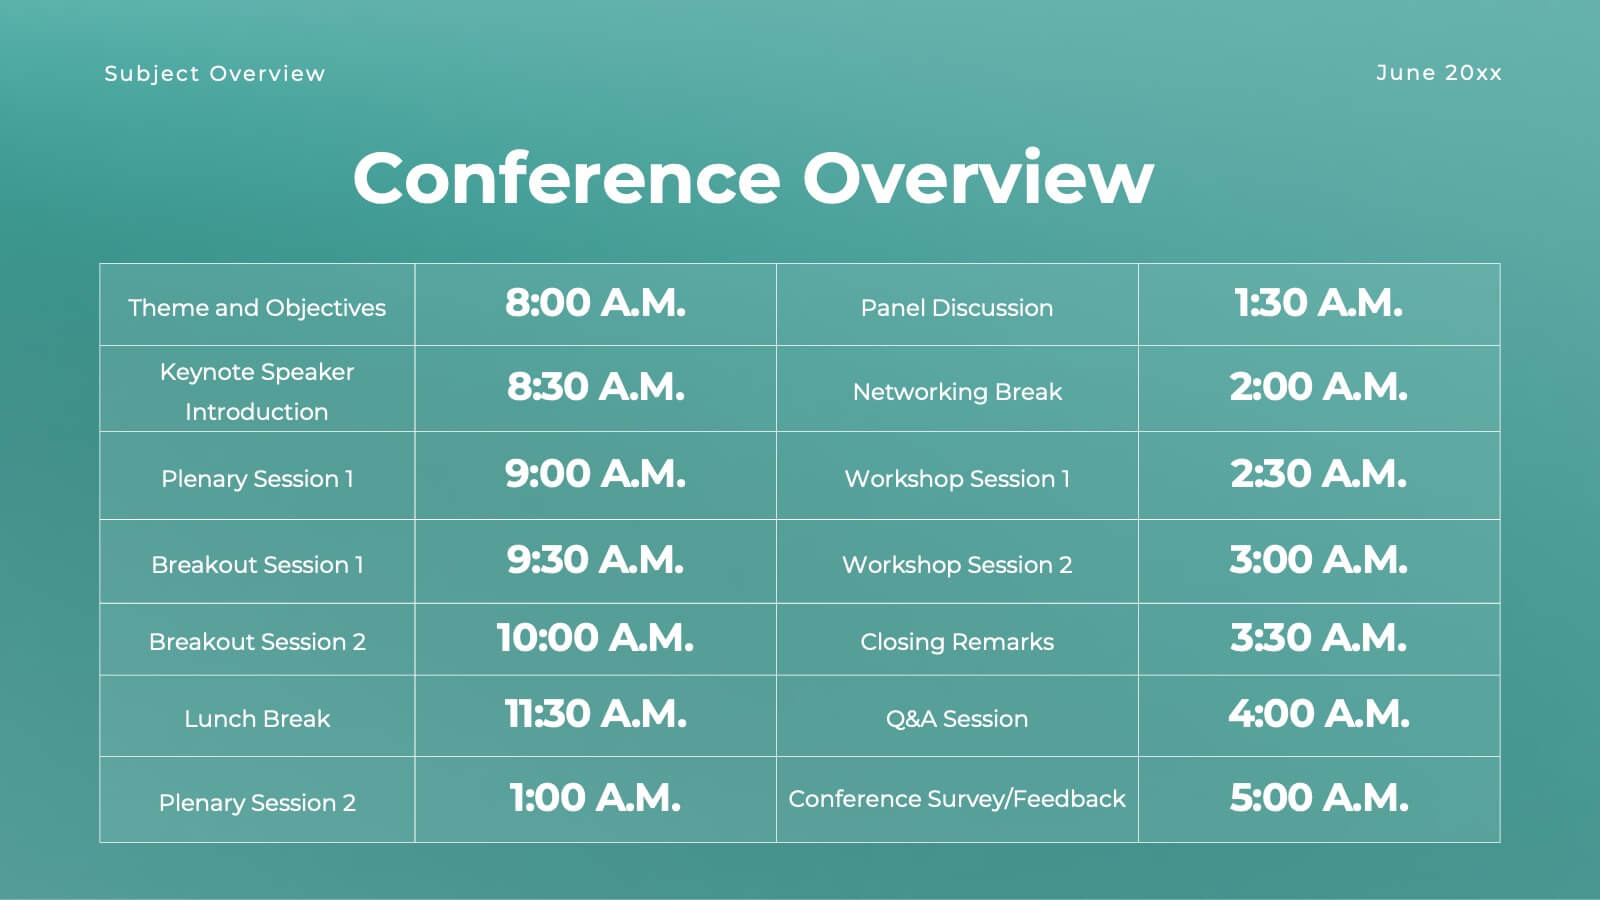
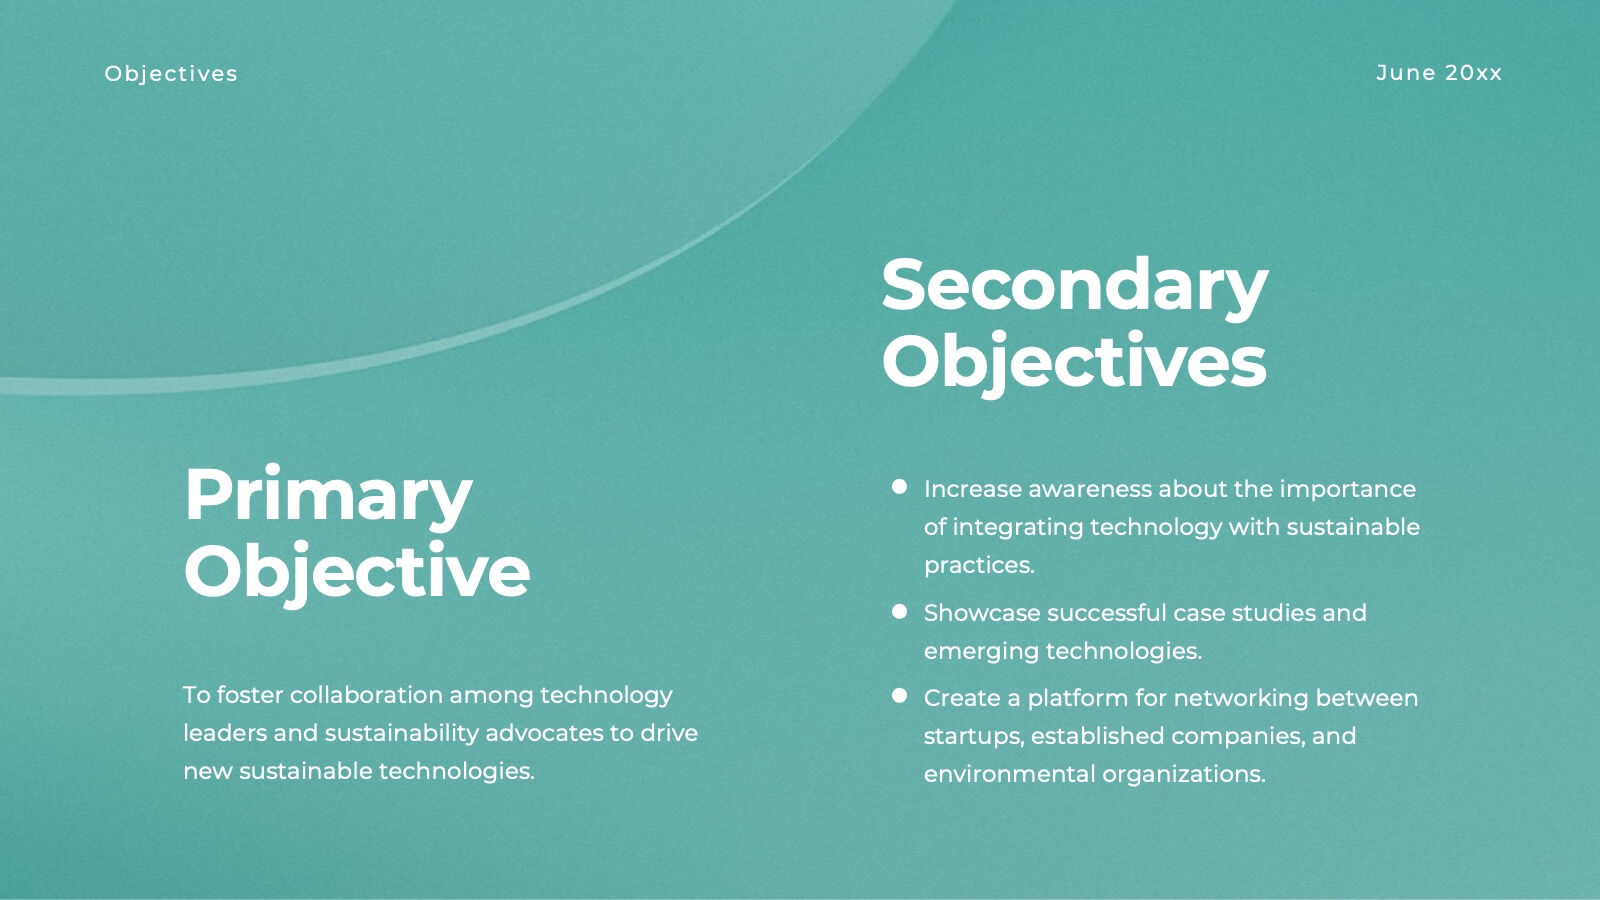
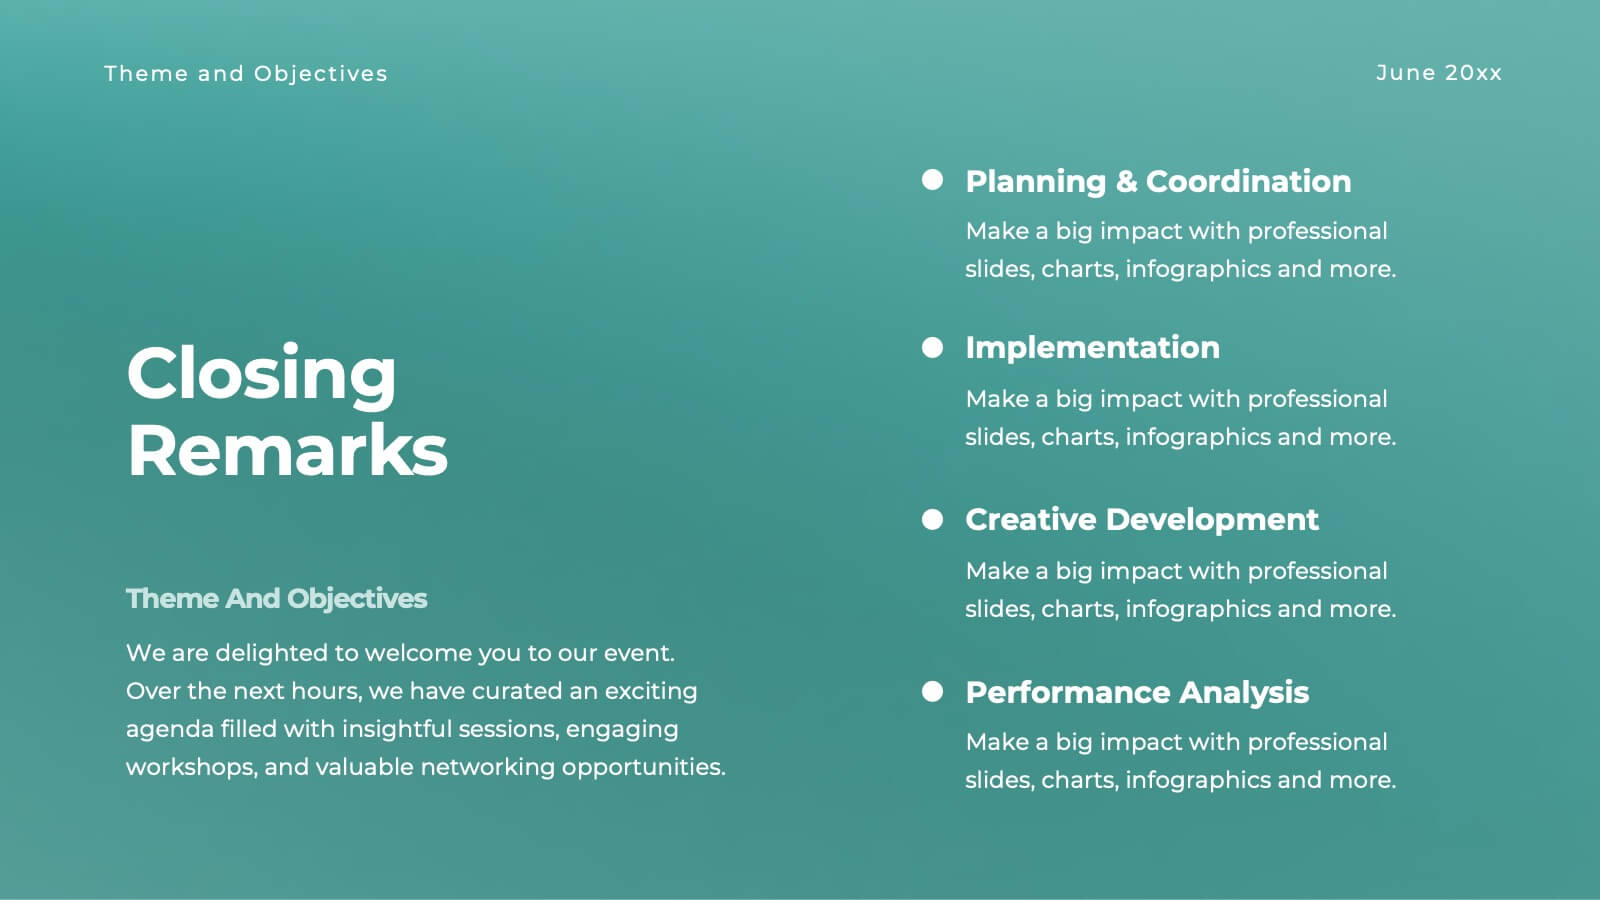
Halo Small Business Pitch Deck Presentation
Streamline your business presentations with this versatile pitch deck template! Ideal for conferences and meetings, it includes slides for objectives, session details, keynote speakers, and panel discussions. Keep your audience engaged with professional design and clear, structured content. Compatible with PowerPoint, Keynote, and Google Slides for seamless presentations on any platform.