


Features
- 4 Unique slides
- Fully editable and easy to edit in Microsoft Powerpoint, Keynote and Google Slides
- 16:9 widescreen layout
- Clean and professional designs
- Export to JPG, PDF or send by email


Do you have any questions?
Recommend


4 slides
Decision Making with Option Comparison Presentation
Illuminate your choices with the Decision Making with Option Comparison Presentation. This slide uses a bold lightbulb illustration surrounded by icons to visually break down multiple options or solutions. Ideal for showcasing pros and cons, strategic alternatives, or scenario evaluations. Each option includes space for a clear title and supporting insights, making it easy to compare ideas side-by-side. Fully editable in PowerPoint, Keynote, and Google Slides—perfect for business strategy sessions, team decisions, or client pitches.


6 slides
Vision to Execution Business Strategy Presentation
Bridge the gap between strategic vision and operational execution with this visual funnel-style template. Ideal for mapping high-level goals to tactical outcomes, this slide helps communicate transformation processes, business initiatives, or product strategies. Fully editable in PowerPoint, Keynote, or Google Slides for strategic planning, leadership sessions, or roadmap presentations.


5 slides
Clear Strategy in Five Stages Presentation
Outline your strategic roadmap with this five-step cube staircase layout. Perfect for planning, growth tracking, or project milestones, each stage is color-coded with icons and numbered steps for clarity. Easy to edit in PowerPoint, Keynote, and Google Slides—ideal for business planning, strategy sessions, or performance reviews.

22 slides
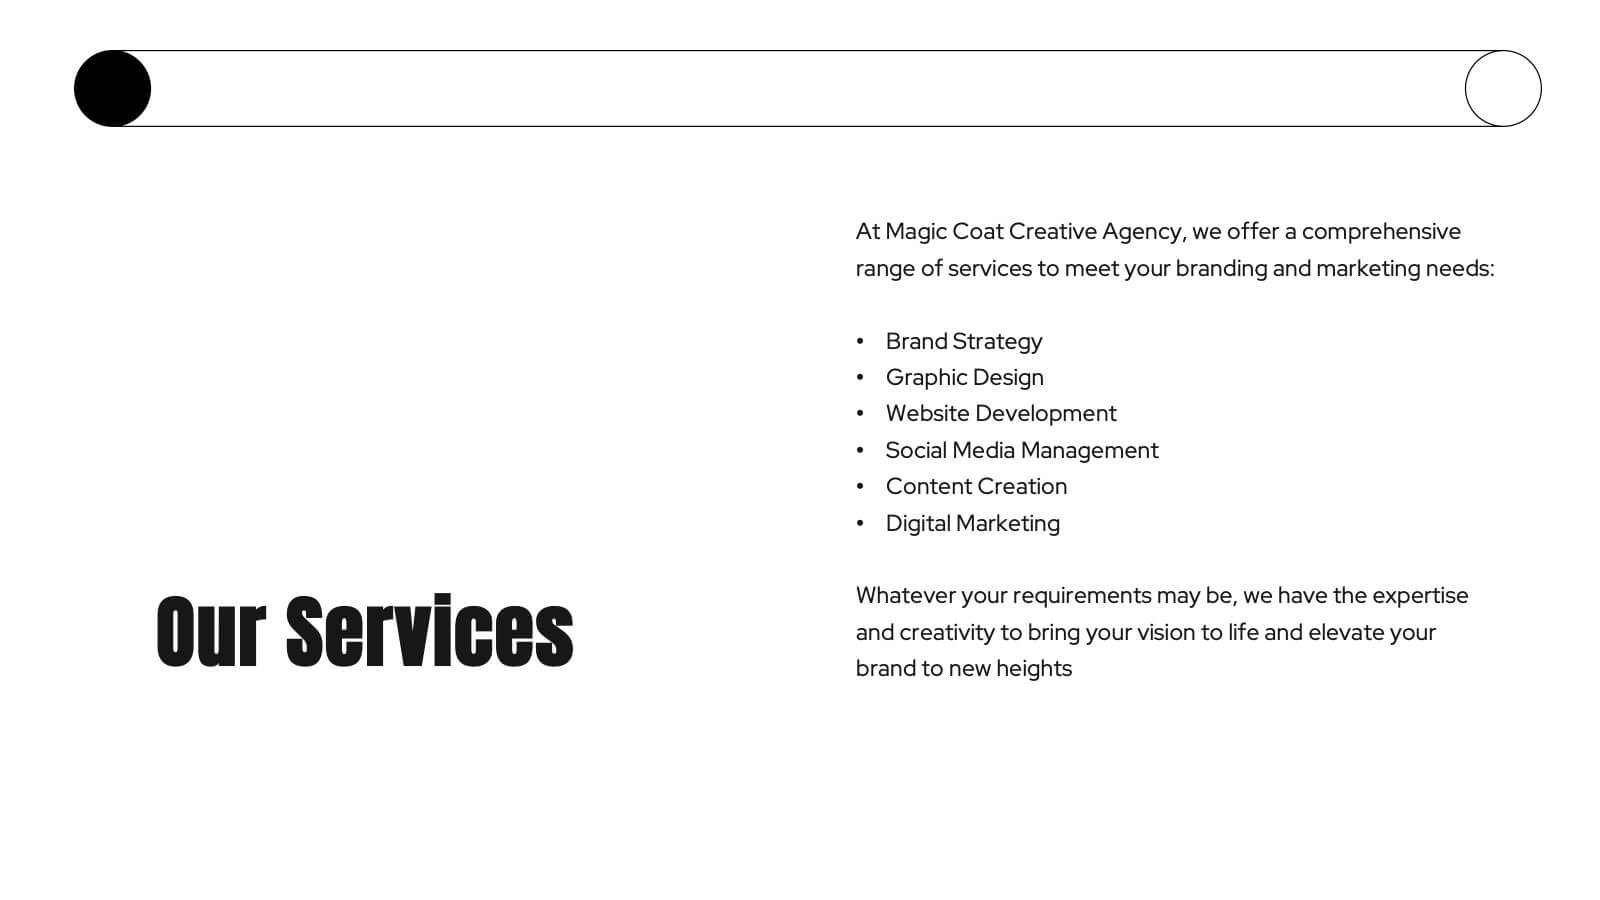
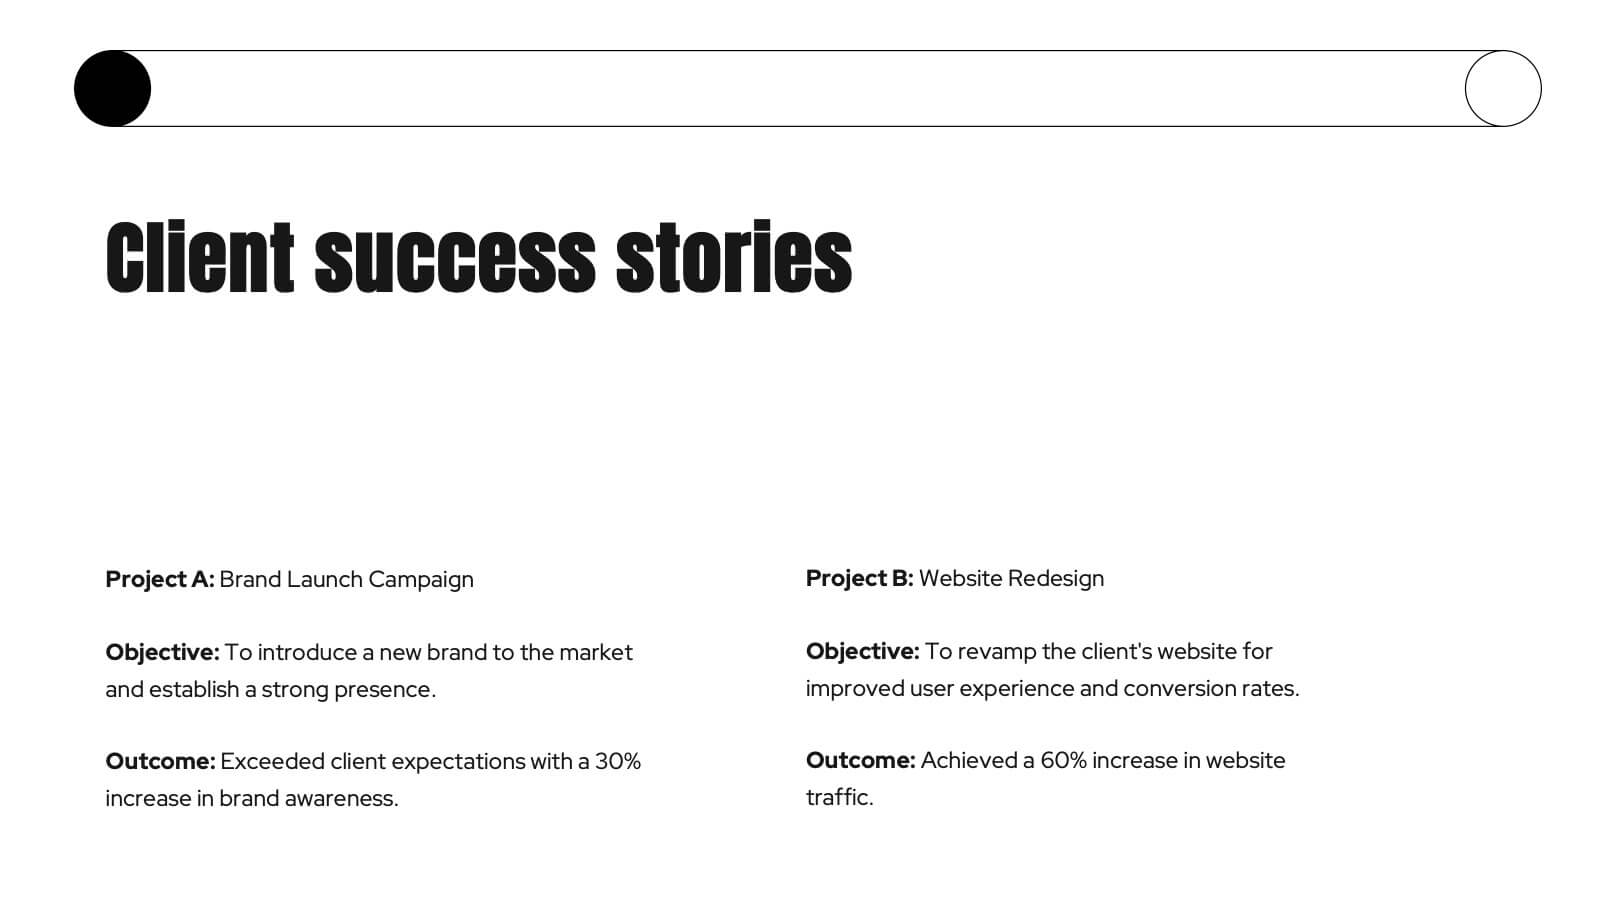
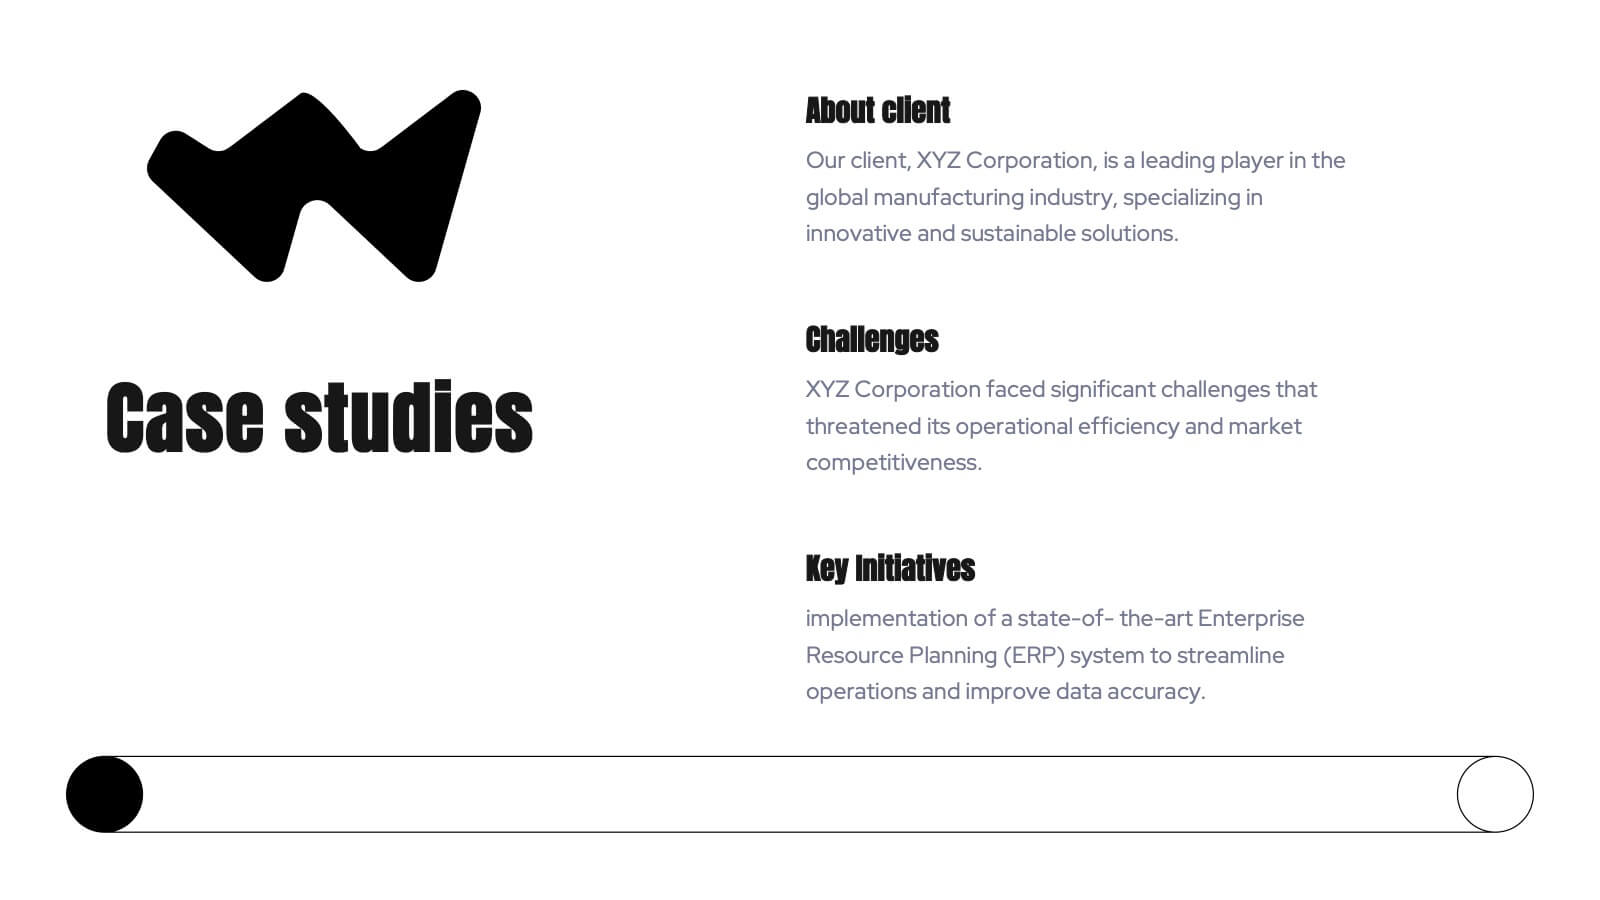
Kraken Agency Portfolio Presentation
This agency portfolio template showcases your agency's work and expertise with a sleek, modern design. It features slides for client success stories, case studies, services, market analysis, and creative process. Perfect for demonstrating your team’s skills and approach. Compatible with PowerPoint, Keynote, and Google Slides for easy customization and presentation.


5 slides
AI for Business Innovation Presentation
The "AI in Business" presentation template showcases how AI can be applied across different business processes. It features a friendly robot icon that creatively represents AI's role in modern business, making it visually engaging. The four connected nodes A, B, C, and D likely detail specific applications or case studies of AI in business, such as data analysis, automation, customer interaction, and innovation. This layout is excellent for presentations that aim to explain complex technological implementations in a straightforward and accessible manner, perfect for corporate training or stakeholder briefings.


5 slides
Understanding Customer Needs with Empathy Map Presentation
Gain deeper customer insights with the Understanding Customer Needs with Empathy Map Presentation. This template simplifies user research by visually organizing customer thoughts, behaviors, and emotions into a clear layout. Perfect for UX teams, product designers, and marketers aiming to craft user-centric strategies. Fully editable in PowerPoint, Keynote, Canva, and Google Slides.


5 slides
Hidden Risks Iceberg Model Diagram Presentation
Spotlight what lies beneath the surface with the Hidden Risks Iceberg Model Diagram Presentation. This slide helps you visually distinguish between visible issues and deeper, less obvious risks—perfect for risk assessments, compliance, safety briefings, and executive strategy discussions. Fully editable in PowerPoint, Keynote, and Google Slides for quick customization.


8 slides
End-to-End Project Lifecycle Management Presentation
Visualize each phase of your project lifecycle with this clean, circular flow layout. Ideal for showcasing planning, execution, and delivery stages in a structured loop. Each segment is fully editable to match your content. Compatible with PowerPoint, Google Slides, and Keynote for effortless customization and professional results.


4 slides
Content Calendar and Engagement Plan Presentation
Plan and track content effectively with this calendar-style engagement layout. Visualize posting frequency, engagement goals, and campaign performance in a single view. Ideal for content strategists and marketers managing social or editorial schedules. Fully editable in PowerPoint, Keynote, or Google Slides to suit your unique workflow and branding needs.


8 slides
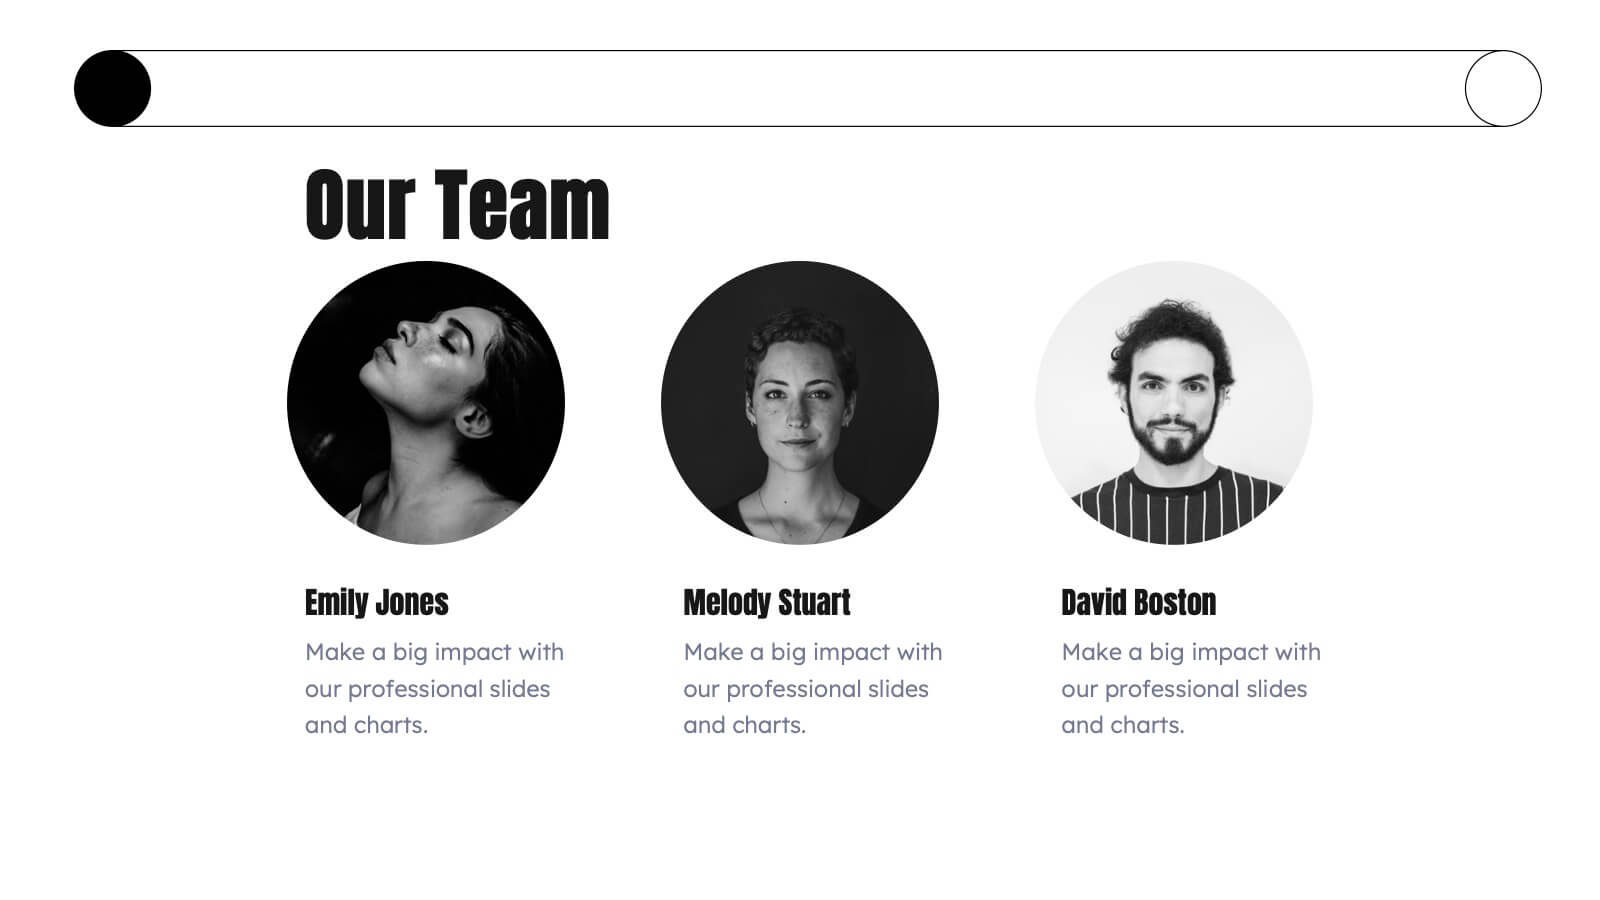
Meet the Team Presentation
Showcase your team effectively with our "Meet the Team Presentation" template. This sleek design features personalized cards for each team member, displaying their photo, name, and contact details on a visually appealing, color-coded background. Perfect for onboarding, company introductions, or team-building presentations, this template enhances recognition and cohesion. The distinct colors can be used to signify different roles or departments, making it easy to identify team dynamics at a glance. Compatible with PowerPoint, Keynote, and Google Slides, it’s an essential tool for any organization aiming to present their team in a professional and engaging manner.


6 slides
Best Pricing Tables Infographics
Maximize your product or service presentation with our Best Pricing Tables infographic template. This template is fully compatible with popular presentation software like PowerPoint, Keynote, and Google Slides, allowing you to easily customize it to showcase your pricing structures effectively. The Best Pricing Tables infographic template offers a visually appealing platform to display different pricing tiers, features, and benefits. Whether you're a business owner, marketer, or sales professional, this template provides a user-friendly canvas to create pricing tables that captivate your audience. Optimize your pricing strategy with this SEO-optimized Best Pricing Tables infographic template, thoughtfully designed for clarity and ease of use. Customize it to highlight competitive advantages, discounts, and special offers, helping you convert potential customers into loyal clients. Start crafting your personalized pricing tables today to boost your sales and revenue!


7 slides
Governance Structure Infographic
Governance structure refers to the framework, system, and processes that define how an organization's operations, strategies, and objectives are directed, controlled, and regulated. This infographic template serves as a clear roadmap, guiding you through the key pillars that establish a strong foundation for successful governance. Compatible with Powerpoint, keynote, and Google Slides. The checkpoints illustrate the importance of compliance and effective risk management at various stages of your governance journey. This illuminating template empowers you to communicate the principles that steer an organization toward its objectives.


5 slides
IT Security and Data Protection Presentation
Communicate your cybersecurity objectives with impact using this clean, shield-based visual layout. This presentation slide features five distinct steps with matching icons, perfect for detailing protocols like data governance, firewall strategies, or access control measures. Ideal for IT professionals, network admins, or compliance teams. Fully customizable and compatible with PowerPoint, Keynote, and Google Slides.


5 slides
Detailed Project Scope Definition Presentation
Bring structure and clarity to your planning process with a layout designed to define every stage of your project. Perfect for outlining goals, deliverables, and timelines, this presentation keeps information clear and organized. Fully compatible with PowerPoint, Keynote, and Google Slides for easy customization and professional results.


5 slides
USA Economy Infographics
The U.S. economy has a significant impact on the global economy and serves as a benchmark for economic performance. These vertical infographics are the perfect tool to present your key facts, statistics, and trends to help the audience understand the economic landscape of the country. The visually appealing design included, coupled with concise and relevant information, helps to effectively communicate the complexities of the economy. Whether used for educational purposes or as a reference tool, these templates provides a comprehensive overview of the USA economy and its key components. Fully compatible with Powerpoint, Keynote, and Google Slides.


6 slides
PESTEL Framework Breakdown Presentation
Kickstart your strategic thinking with a bold, colorful layout that makes external business factors easy to understand at a glance. This presentation breaks complex influences into clear, structured sections, helping teams analyze trends and plan with confidence. Fully editable and compatible with PowerPoint, Keynote, and Google Slides.


6 slides
Startup Investors Pitch Deck Presentation
Inspire confidence and spark investor interest with the Startup Investor Pitch Deck Presentation. Featuring a creative visual of a rocket launching from a piggy bank, this slide is ideal for illustrating funding momentum, business growth, or financial milestones. Each section allows space to highlight critical investment points such as traction, market opportunity, financials, and team highlights. Fully customizable in PowerPoint, Keynote, or Google Slides, this pitch-ready layout is perfect for entrepreneurs, startup founders, and innovation teams aiming to deliver a memorable and professional presentation.