


Features
- 5 Unique slides
- Fully editable and easy to edit in Microsoft Powerpoint, Keynote and Google Slides
- 16:9 widescreen layout
- Clean and professional designs
- Export to JPG, PDF or send by email


Do you have any questions?
Recommend


6 slides
Data-Driven Decision Making Presentation
Showcase your data-to-action process with this clean, step-by-step layout. Ideal for illustrating analytics workflows, this template features five connected stages with modern icons and clear labeling. Perfect for business, tech, or strategy presentations. Fully editable in Canva, PowerPoint, and Google Slides to match your branding and communication needs.


26 slides
Soren Presentation Template
Soren is a cool, clean, simple easy to use template. This beautiful template is great for all types of businesses and creative projects. The colors are bold and simple to capture the audience needs. Soren is a multipurpose theme that can be used to capture the attention of your clients in a friendly, unique way. This template is a minimalistic design to attract your customers. The simple text, charts and tables make it easy to customize this template to match your brand. Whether you’re in need of a business presentation, newsletter or even social media posts – Soren is the perfect fit for you.


10 slides
Marketing Funnel Diagram Presentation
Optimize your sales strategy with this Marketing Funnel Diagram template. Ideal for visualizing customer journeys, lead conversion, and sales processes, this design is fully editable to fit your business needs. Customize colors, text, and icons easily. Compatible with PowerPoint, Keynote, and Google Slides for seamless presentations and collaboration.


7 slides
Summary Infographic
This collection of summary slides is expertly crafted to provide concise and clear overviews of complex information, making it ideal for concluding presentations, meetings, or reports. Each slide features a distinctive design with a strong focus on structure and readability, employing a balanced use of space and typography to highlight key points effectively. The slides utilize varied layouts, including bullet points, diagrams, and flowcharts, allowing for the presentation of summary data in a visually appealing and easily digestible format. These elements are crucial for summarizing the results of discussions, outlining project statuses, or presenting conclusions and next steps in a professional setting. Color coding and iconography are strategically used to categorize information and emphasize important metrics or conclusions, aiding in quick comprehension. This set is invaluable for professionals looking to present executive summaries, project outcomes, or strategic recommendations clearly and effectively, ensuring audiences grasp the essential takeaways without getting lost in details.


6 slides
Product and Service Benefits Presentation
Highlight the unique value of your offerings with this Product and Service Benefits Presentation. Designed for clarity and impact, this visual layout allows you to break down six key features or advantages side-by-side. Perfect for product launches, sales decks, or service comparisons. Easily customizable in PowerPoint, Keynote, and Google Slides — ideal for marketers, sales teams, and consultants.


5 slides
Operational Planning in 5 Key Steps Presentation
Present your operational roadmap with this dynamic 5-step arrow diagram. Each line represents a strategic input streamlined toward a unified goal. Ideal for workflows, business processes, or implementation plans. Fully editable in PowerPoint, Keynote, and Google Slides—perfect for team planning, operations meetings, and project execution strategies.


4 slides
Modern Geometric Shapes
Present your ideas with clean, minimal, and visually striking 3D shapes. This layout uses a sequence of geometric figures—cube, cone, and sphere—to represent step-by-step flows or abstract concepts. Ideal for design, architecture, education, or tech topics. Fully editable in PowerPoint, Keynote, and Google Slides.

21 slides
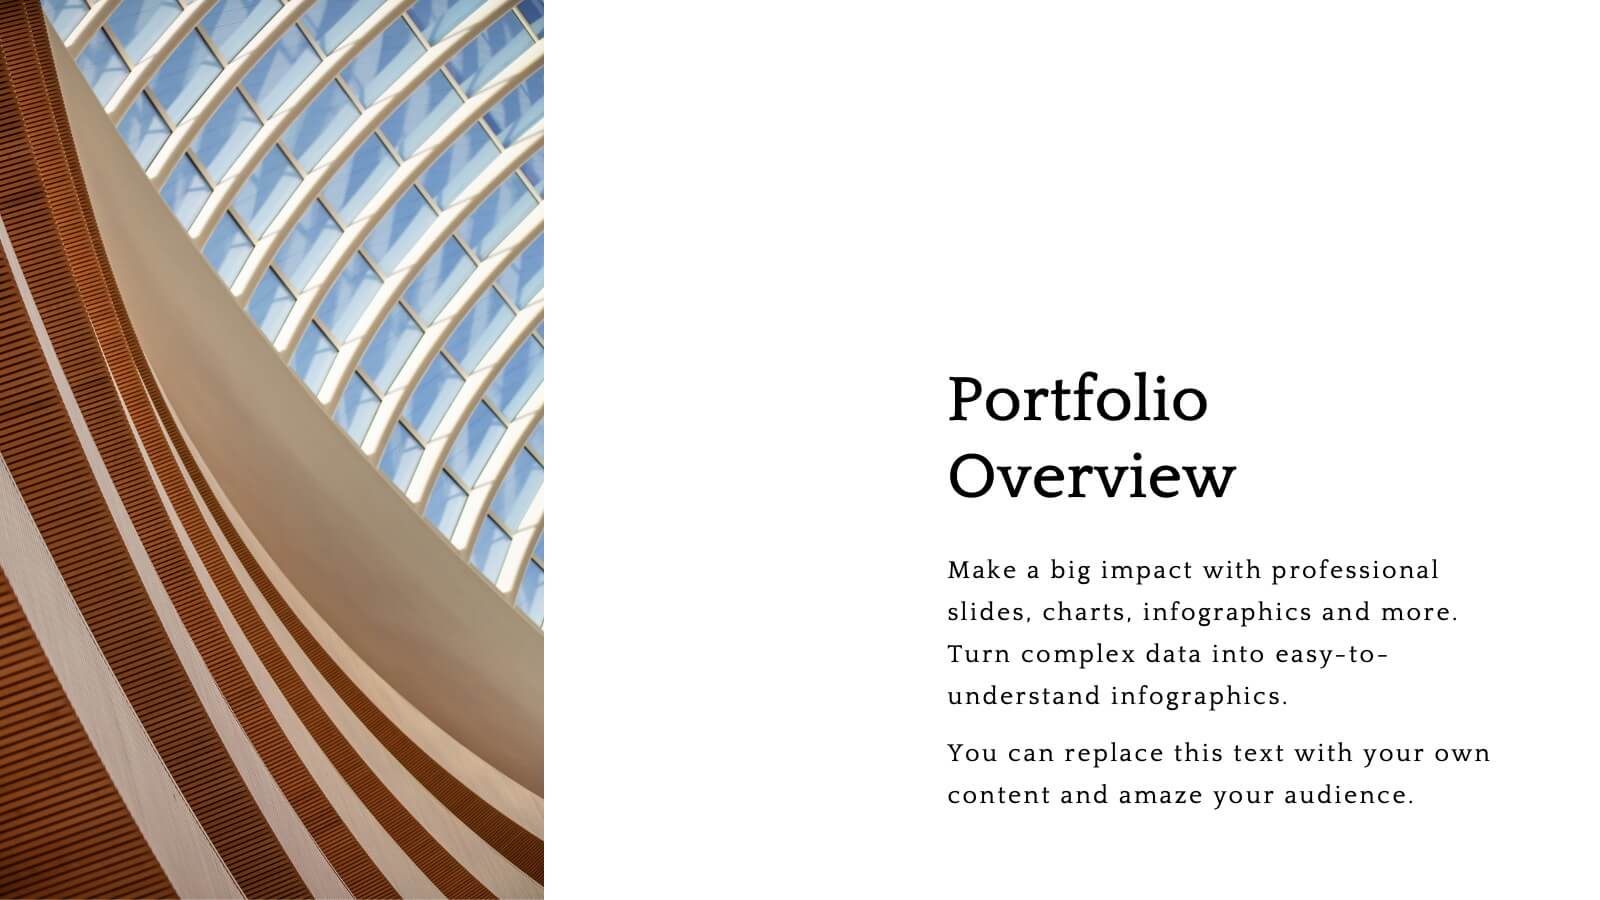
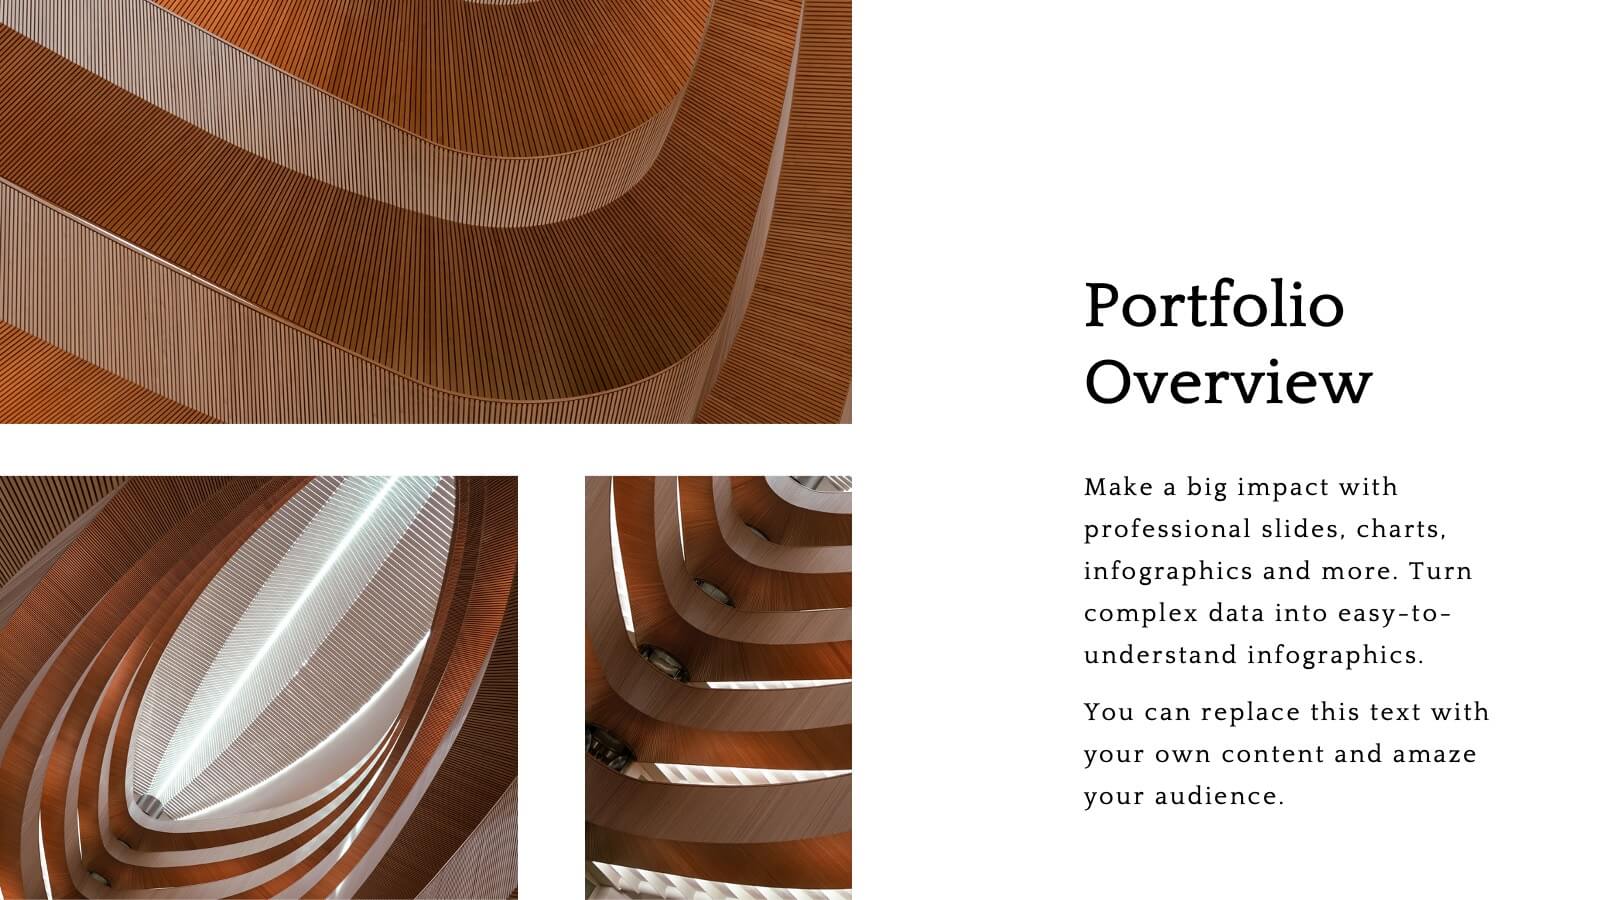
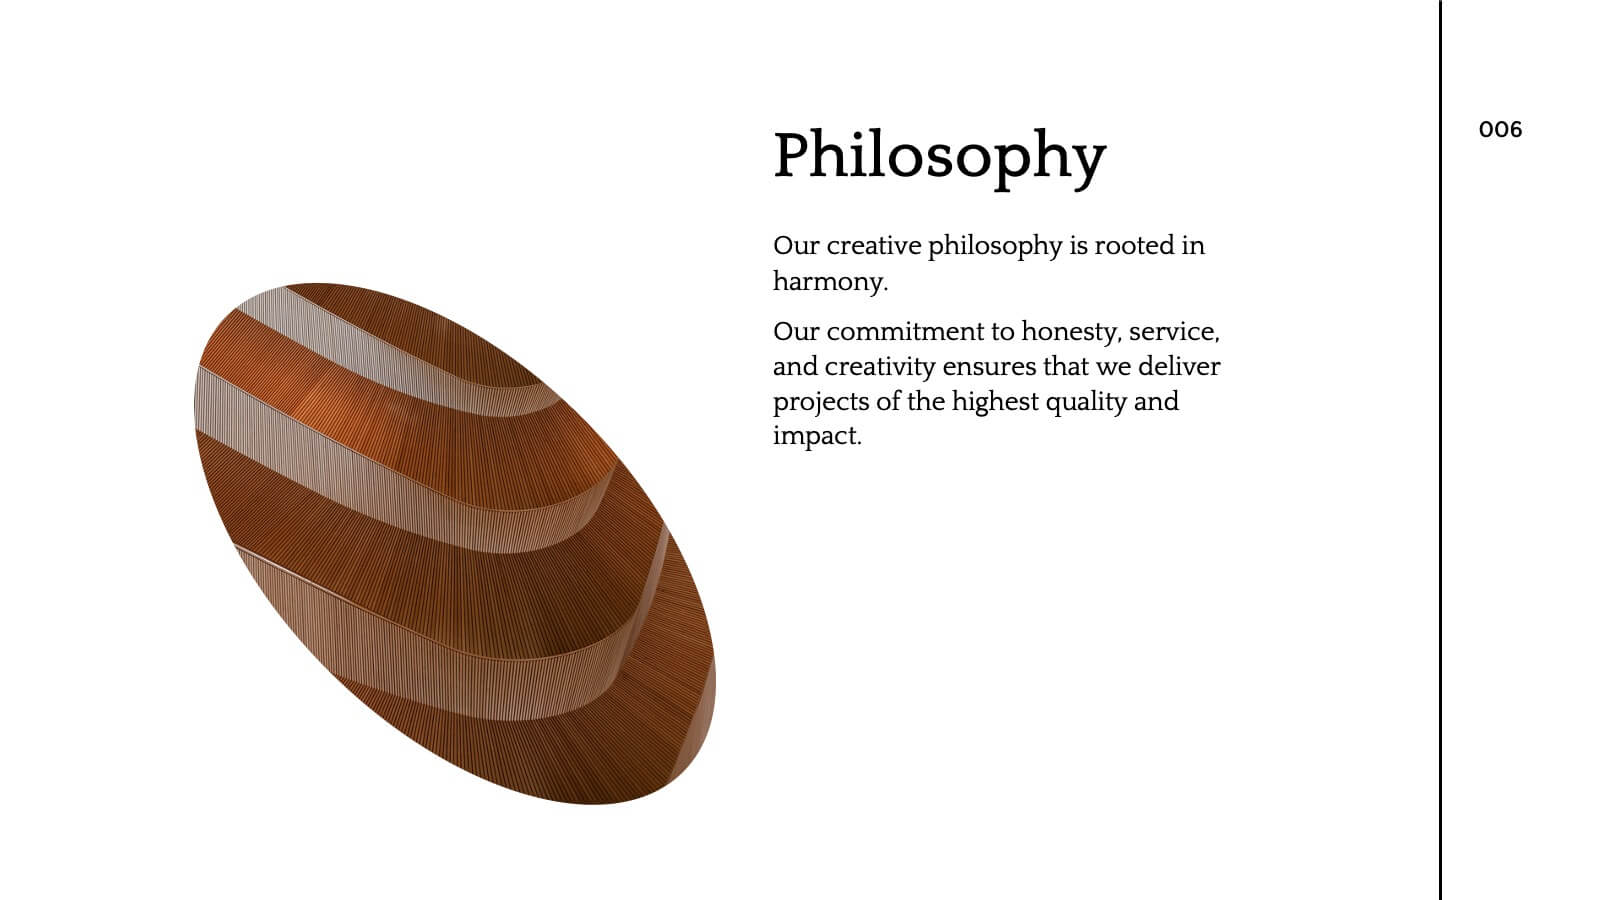
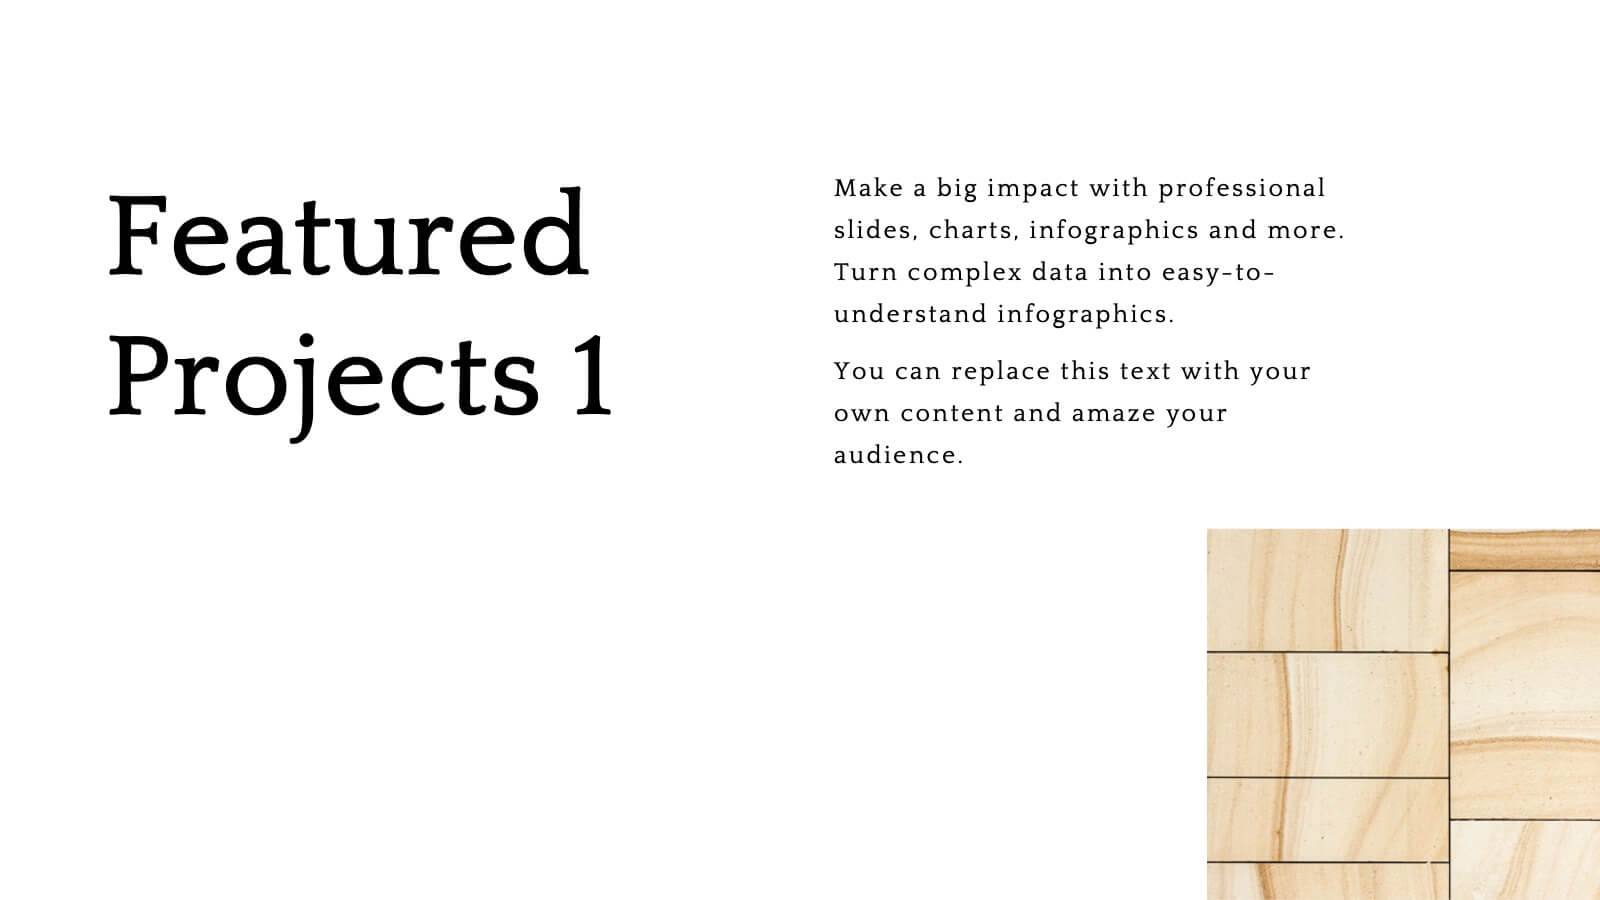
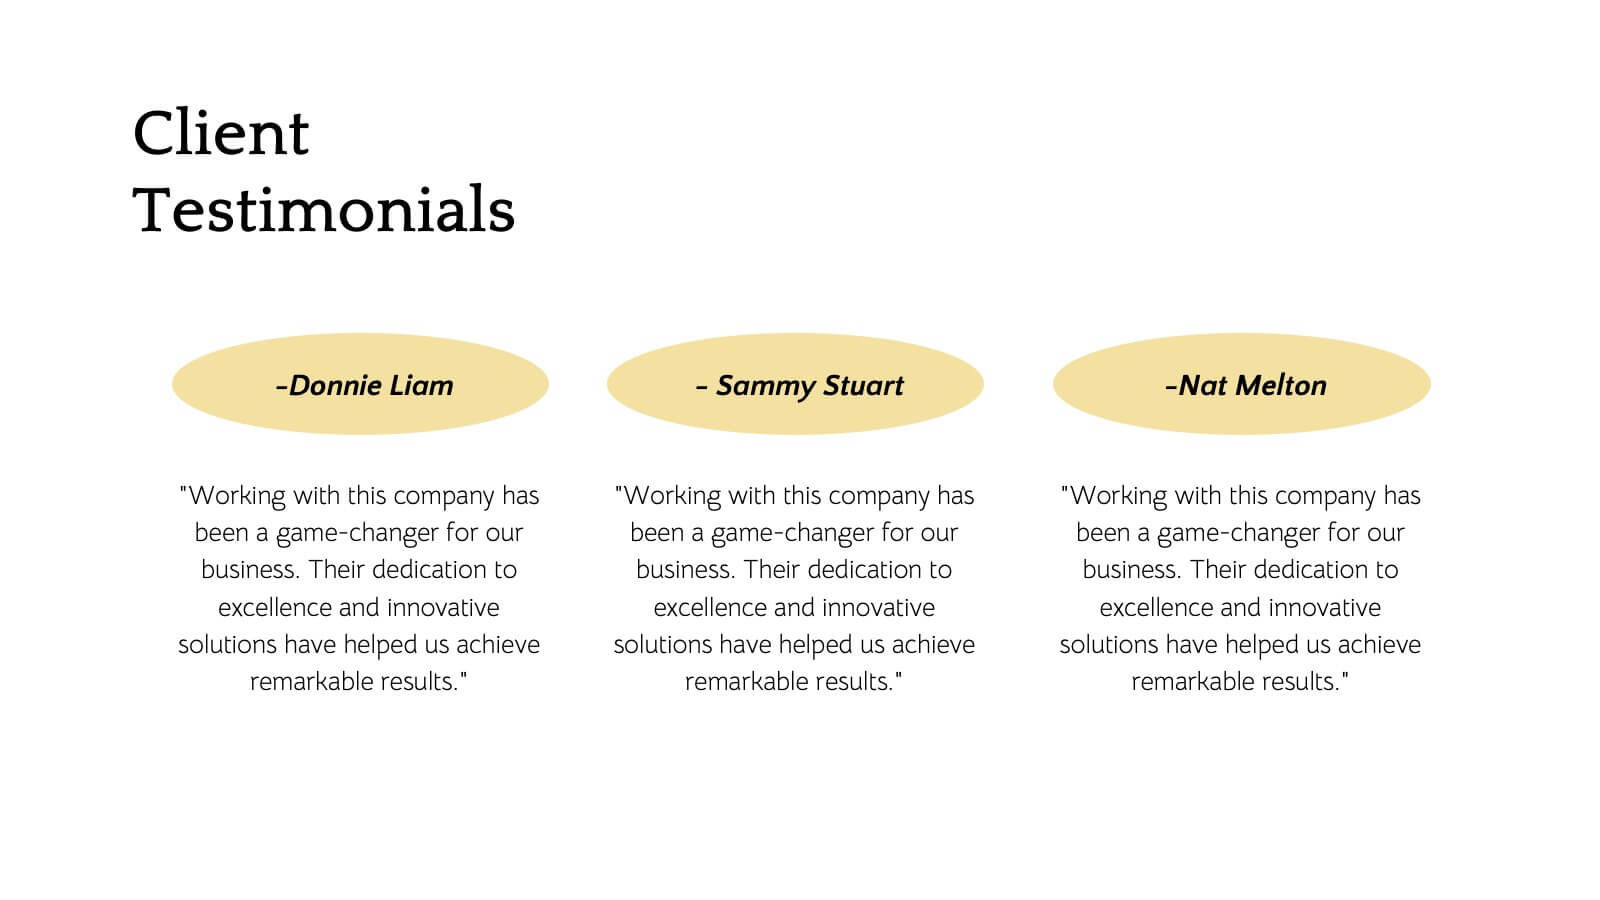
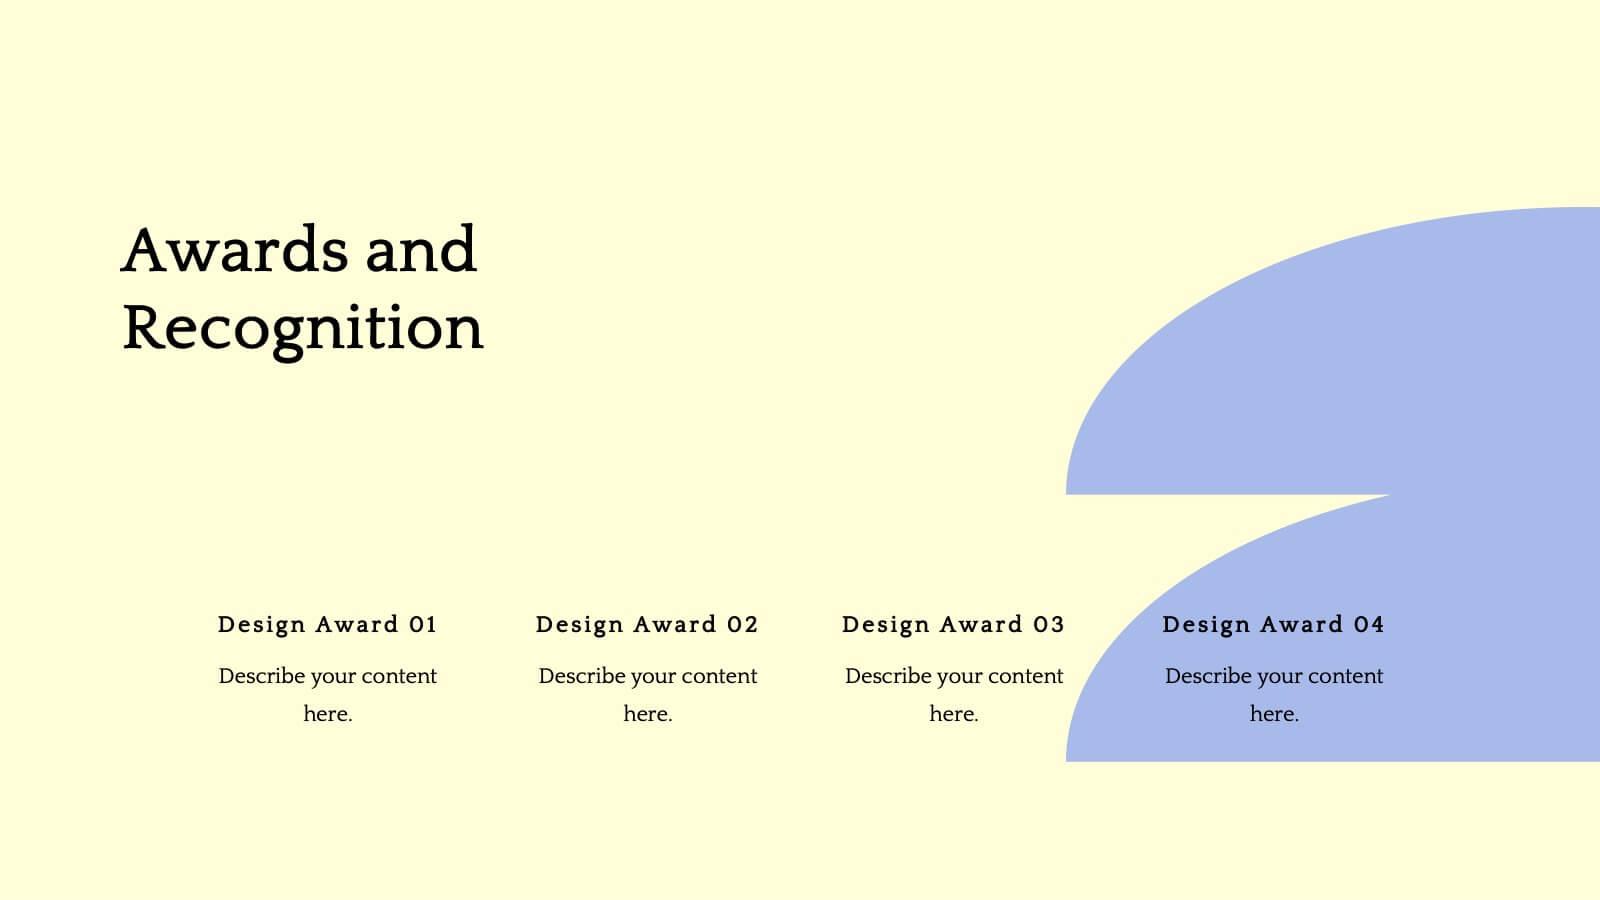
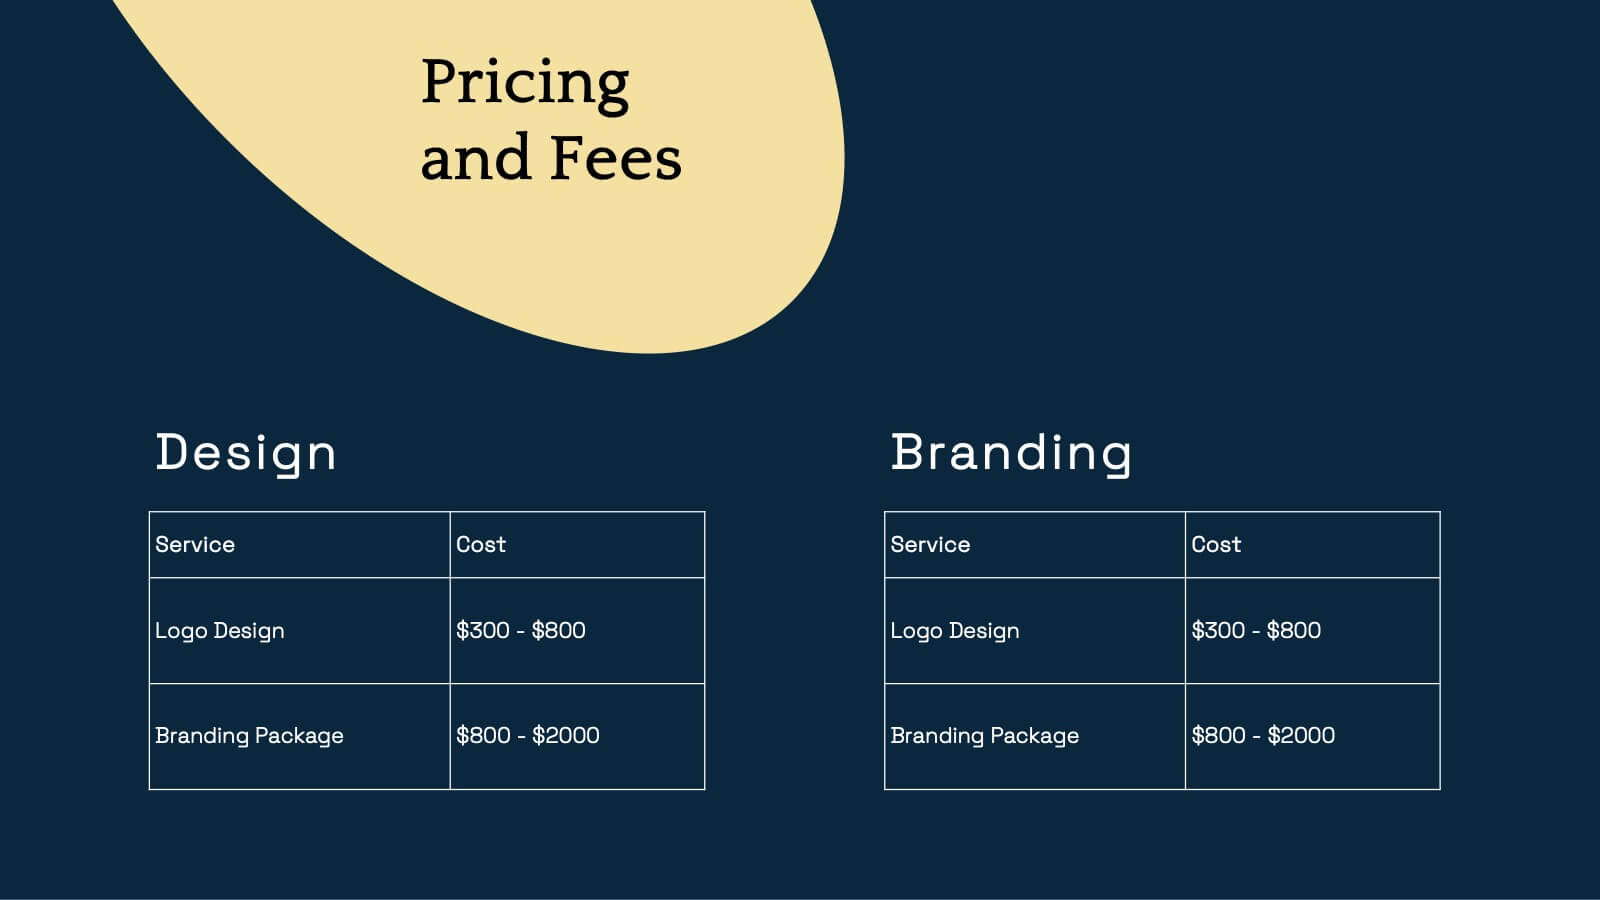
Flare Creative Portfolio Presentation
Showcase your creative work with this elegant portfolio template! Perfect for highlighting projects, client testimonials, and services offered. Ideal for artists, designers, and creatives aiming to impress clients and collaborators. Compatible with PowerPoint, Keynote, and Google Slides, this template ensures your portfolio is clear, professional, and visually stunning. Make your work shine!


21 slides
Ironveil Annual Report Presentation
A professional annual report template for showcasing performance metrics, key highlights, financial summaries, and strategic initiatives. Includes sections for customer feedback, competitor insights, and future priorities. Fully customizable and ideal for business reviews. Compatible with PowerPoint, Keynote, and Google Slides for seamless presentation delivery.


5 slides
Numerical Highlights in Strategy Presentation
Present key strategic milestones using this visually engaging curved-number layout. Designed to emphasize four sequential points, it's perfect for showcasing steps, achievements, or data-driven highlights. The bold numbering and layered hills guide the viewer naturally. Fully editable in Canva—ideal for business plans, growth summaries, or performance strategy visuals.


6 slides
Business Structure Outline Presentation
Visualize your company’s framework with this modern business structure slide. Perfect for showcasing team roles, departments, or organizational functions, it helps simplify complex relationships into a clear overview. Easily editable in Canva, PowerPoint, and Google Slides—ideal for presentations, planning sessions, or onboarding new employees with a professional, easy-to-follow design.


8 slides
Winning Strategies for Professional Success Presentation
Showcase your top performers, strategic milestones, or ranked insights with this podium-style template. Featuring vibrant visuals and structured layout, it’s ideal for performance reviews, leadership presentations, and competitive analysis. Fully editable in PowerPoint, Keynote, and Google Slides—perfect for professional success stories, rankings, and progress highlights.


21 slides
Goldenshadow Professional Portfolio Showcase Presentation
A refined portfolio presentation template crafted to highlight professional achievements and expertise. Showcase featured projects, collaborations, and client testimonials with a sleek, modern design. Includes sections for services offered, awards, pricing, and contact information. Fully customizable and compatible with PowerPoint, Keynote, and Google Slides for impactful portfolio presentations.


7 slides
Harvey Ball Infographics Presentation Template
Featuring our Harvey Ball Infographic template, this is best used for presenting data from a variety of sources in an interactive way, showing charts and graphs, with the main point highlighted by using a bullet-pointed list at the bottom of the slide. This presentation template was designed to help you put your data into a visual representation that will capture the attention of your audience. This is great for business presentations and data visualizations, it is simple to create a professional looking presentations that will showcase your data in the most effective way possible.


21 slides
Zephyrkin Product Roadmap Presentation
Outline your product’s journey with this roadmap template, covering essential elements like target market, customer pain points, competitive analysis, and marketing strategy. Showcase your product's features, unique value proposition, and development process. Ideal for PowerPoint, Keynote, and Google Slides, this template supports professional product presentations.


5 slides
Patient Care and Hospital Management Presentation
Communicate critical aspects of Patient Care and Hospital Management with this structured presentation template. Featuring a unique IV-drip-inspired design, this layout visually represents the flow of healthcare processes, making it ideal for hospitals, medical institutions, and healthcare professionals. Use it to outline treatment protocols, patient management strategies, and operational workflows. Fully editable and compatible with PowerPoint, Keynote, and Google Slides for seamless customization.


6 slides
Stakeholder Analysis Chart Infographic
Stakeholder analysis is a process used by organizations to identify and assess the interests, concerns, expectations, and potential impact of various individuals, groups, or entities that have a stake in a particular project, decision, or initiative. The goal of this infographic is to better understand the perspectives and needs of different stakeholders and to use this information to inform decision-making and project planning. This template summarizes the importance of stakeholder analysis in project management or organizational decision-making. This compatible with Powerpoint, Keynote, and Google Slides.