


Features
- 7 Unique slides
- Fully editable and easy to edit in Microsoft Powerpoint, Keynote and Google Slides
- 16:9 widescreen layout
- Clean and professional designs
- Export to JPG, PDF or send by email


Do you have any questions?
Recommend


6 slides
Real Estate and Building Development Presentation
Present key insights into the real estate market with the Real Estate and Building Development template. Designed for property investors and urban planners, this visual framework highlights financial trends, project phases, and market analysis. Fully customizable and compatible with PowerPoint, Keynote, and Google Slides for seamless presentation delivery.


7 slides
Financial Health and Budget Planning Presentation
Present your budgeting journey with clarity using the Financial Health and Budget Planning Presentation. This slide features a horizontal flow diagram with six editable steps—perfect for outlining savings strategies, expense tracking, or financial goals. Each icon-based block helps highlight key actions. Fully customizable in PowerPoint, Canva, and Google Slides.


4 slides
3-Tier Hierarchical Pyramid Breakdown
Simplify your strategy presentation with the 3-Tier Hierarchical Pyramid Breakdown Presentation. This clear and modern slide features a three-level pyramid with horizontal progress bars and percentage indicators—perfect for visualizing goals, KPIs, or organizational layers. Each tier includes editable text boxes for quick customization. Works seamlessly in PowerPoint, Keynote, and Google Slides.


4 slides
Personal and Business Insurance Plans
Clearly present your insurance tiers with this easy-to-read comparison layout. Ideal for showcasing plan options for individuals, families, and businesses, this template highlights pricing, benefits, and coverage icons side-by-side. Clean and professional, it’s fully editable in PowerPoint, Keynote, and Google Slides.


6 slides
Mission Goals Infographic
These professionally designed slide templates are tailored to help you articulate your organization's mission goals with clarity and impact. Each slide is structured to emphasize the strategic objectives that guide your operations, making them ideal for communicating with stakeholders, teams, and external partners. Featuring a variety of layouts that include real-life imagery and concise text areas, these templates not only convey your goals but also illustrate the values that underpin your mission. They are perfect for enhancing corporate presentations, annual meetings, or internal strategy discussions, providing a visual and textual guide to what drives your organization forward. Customizable for various communication needs, these templates can be adapted to highlight specific mission goals or to align with different thematic elements of your presentations. They are an essential tool for organizations aiming to foster a unified understanding of their mission and to inspire alignment and action among all stakeholders.


21 slides
Runewood Marketing Proposal Template Presentation
The Marketing Proposal Presentation Template provides 21 slides covering core aspects like market presence, growth strategies, and financial highlights. Perfect for agencies and businesses to showcase their marketing strategies effectively. Fully customizable and compatible with PowerPoint, Keynote, and Google Slides.


6 slides
Structured Table of Content Layout Presentation
Organize your presentation with clarity using this Structured Table of Content Layout. Ideal for overviews, agendas, or segmented discussions, this template features clean typography, icons, and a photo section. Fully editable in PowerPoint, Keynote, and Google Slides—perfect for professional reports, project briefs, or pitch decks that need clear navigation.


5 slides
Advances in Technology Infographics
Advances in Technology have transformed the world in a number of ways and have had a significant impact on society. These Infographic templates are dynamic and visually appealing tools for showcasing the latest advancements in technology across various fields. Whether you're discussing breakthroughs in electric cars, robotics, biotechnology, or any other cutting-edge technology, this template has you covered. With its modern and sleek design, this template captures the essence of technological innovation. It features a range of customizable design elements enabling you to present data-driven information in a visually engaging way.


5 slides
Editable Mind Mapping Presentation
Clarify complex thoughts with the Editable Mind Mapping Presentation. This sleek template features a central profile design with five branching points to visualize ideas, processes, or strategies. It's perfect for brainstorming sessions, team collaboration, or project planning. Fully customizable and compatible with PowerPoint, Keynote, and Google Slides.


7 slides
Company Vision and Future Direction
Bring your company’s future into focus with this sleek, icon-led layout designed to showcase strategic goals, values, and long-term vision. Perfect for leadership presentations, investor updates, or team briefings, this slide turns abstract direction into a clear path forward. Fully compatible with PowerPoint, Keynote, and Google Slides.


7 slides
World Maps Medical Security Infographic
Introducing our world map medical security infographic, a template designed to spotlight global medical security concerns and solutions. With a pristine white backdrop punctuated by shades of blue, this infographic offers a tranquil yet informative ambiance, reminiscent of the medical field. Embedded within are custom graphics of the world map, tailor-made to highlight regions based on their medical security levels, accompanied by relevant icons that represent various aspects of healthcare protection and risks. It’s compatibility with platforms such as PowerPoint, Keynote, and Google Slides ensures seamless presentations across various devices and audiences.


5 slides
Human Capital Planning Overview Presentation
Streamline workforce strategies with the Human Capital Planning Overview Presentation. This structured template helps visualize talent development, succession planning, and HR workflows in clear, step-by-step layouts. Perfect for HR leaders, consultants, and executives. Fully editable in PowerPoint, Keynote, and Google Slides for seamless customization to match your team or organization.


5 slides
E-Learning and Digital Education Trends Presentation
Stay ahead in the digital learning space with the E-Learning and Digital Education Trends Presentation template. Designed for educators, trainers, and e-learning professionals, this modern and insightful layout highlights key trends, innovative tools, and strategies in online education. With fully customizable elements, you can tailor the slides to your audience’s needs. Compatible with PowerPoint, Keynote, and Google Slides for a seamless presentation experience.


5 slides
Purpose-Driven Mission and Values Presentation
Present your organization’s core purpose and guiding principles with this Purpose-Driven Mission and Values presentation. This clean, flag-style layout is perfect for showcasing five key pillars such as integrity, collaboration, or innovation. Easily customizable in Canva, PowerPoint, or Google Slides to align with your brand.


4 slides
Butterfly Graph for Diverging Metrics Presentation
Easily compare opposing values with the Butterfly Graph for Diverging Metrics Presentation. Ideal for visualizing split opinions, pros vs. cons, or pre- and post-metrics across multiple categories. The clean, mirrored layout helps audiences grasp key differences at a glance. Compatible with PowerPoint, Google Slides, Canva, and Keynote.


6 slides
Strategy Planning with Business Model Canvas Presentation
Streamline your strategy planning with this Business Model Canvas template. Designed to help entrepreneurs, business owners, and teams outline key business elements, this slide organizes essential components like value propositions, customer segments, revenue streams, and cost structures. Fully editable in PowerPoint, Keynote, and Google Slides, allowing seamless customization to match your branding and business needs.


21 slides
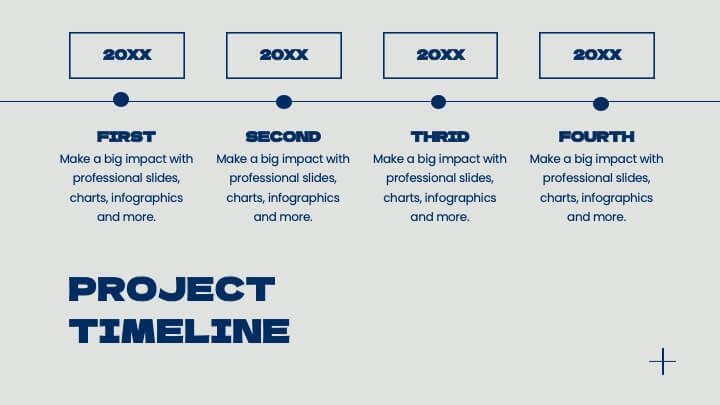
Minoan Project Timeline Presentation
Step back in time with this beautifully crafted Minoan-inspired presentation, perfect for outlining your project timeline! With an elegant design and clear structure, this template helps you showcase key milestones, deadlines, and deliverables in a visually stunning way. Keep your project on track. Compatible with PowerPoint, Keynote, and Google Slides.