


Features
- 6 Unique slides
- Fully editable and easy to edit in Microsoft Powerpoint, Keynote and Google Slides
- 16:9 widescreen layout
- Clean and professional designs
- Export to JPG, PDF or send by email


Do you have any questions?
Recommend


5 slides
Advances in Technology Infographics
Advances in Technology have transformed the world in a number of ways and have had a significant impact on society. These Infographic templates are dynamic and visually appealing tools for showcasing the latest advancements in technology across various fields. Whether you're discussing breakthroughs in electric cars, robotics, biotechnology, or any other cutting-edge technology, this template has you covered. With its modern and sleek design, this template captures the essence of technological innovation. It features a range of customizable design elements enabling you to present data-driven information in a visually engaging way.


26 slides
Blockchain for Businesses Presentation
Navigate the world of decentralized technology with our Blockchain for Businesses presentation template, compatible with PowerPoint, Keynote, and Google Slides. Tailored for business leaders, tech entrepreneurs, and financial experts, this template is a gateway to understanding blockchain's impact on the corporate landscape. Our template demystifies blockchain, presenting its core concepts and applications in business, from enhancing security to streamlining transactions. It provides a visual narrative to explain how blockchain can be a game-changer in various industries by fostering transparency, efficiency, and trust. With customizable diagrams, charts, and case studies, you can illustrate the practical benefits of blockchain integration in business operations. This template is SEO-optimized to reach audiences interested in leveraging blockchain technology for competitive advantage. Use our template to educate your audience about the strategic implementation of blockchain and position your business at the forefront of technological innovation.


6 slides
Property Investment Analysis Presentation
Evaluate Property Investment Analysis with this insightful presentation template. Perfect for real estate investors, financial analysts, and property managers, it features key factors, risk assessments, and investment opportunities in a visually structured format. Fully editable and compatible with PowerPoint, Keynote, and Google Slides for seamless customization.


5 slides
Secure Cloud Storage and Access Presentation
Highlight your data protection strategy with the Secure Cloud Storage and Access presentation slide. Featuring a central cloud shield icon with five connected callouts, it’s perfect for illustrating encryption methods, access protocols, or compliance points. Fully editable in PowerPoint, Keynote, and Google Slides.


4 slides
Agile Workflow Presentation
Bring energy and motion to your process overview with a clean, loop-based flow that makes each stage easy to follow. This presentation is designed to clarify steps, illustrate iterations, and support clear decision-making for any project. Fully customizable and compatible with PowerPoint, Keynote, and Google Slides.


7 slides
AIDA Marketing Model Infographic Presentation
The AIDA chart is a marketing and sales tool that represents the four stages a consumer goes through during the purchasing process: Attention, Interest, Desire, and Action. This template is designed to give your audience an overview of the four step sales process, while also explaining what they can expect in depth. It features a visual aid, professional design and a clear layout. Put together an infographic based on the AIDA model and use it to create your own marketing material. Simple to use, customize, and present. This template can be downloaded in Powerpoint, Keynote or Google Slides.


2 slides
Minimalist Cover Page Design Presentation
A clean, modern visual instantly sets the tone, giving your audience a polished start before your message even begins. This presentation introduces your content with a bold, minimalist layout that feels intentional and professional. Perfect for business, creative, or academic use. Fully compatible with PowerPoint, Keynote, and Google Slides.


6 slides
South America Language Map Infographics
South America is located in the Western Hemisphere and is known for its diverse landscapes, cultures, and countries. This infographic template can provide a visual representation of the countries and key information about the continent's geography, culture, economy, and more. This template is designed to help your audience gain insights into the diverse and rich continent, making it a valuable tool for educational, promotional, and informative purposes. This map infographic can be shared on websites, social media platforms, presentations, and marketing materials targeting audiences interested in South America.


8 slides
Benefits Table Template
Optimize your presentation of complex options with our "Benefits Table Template." Designed to clearly distinguish between different plans, this template enables you to showcase Plan A, Plan B, and Plan C with ease. Each column is distinctively colored and detailed to ensure your audience can grasp the variances in benefits at a glance. Ideal for comparing packages, costs, or strategic choices in a corporate setting, this template helps clarify decision-making processes. Compatible with PowerPoint, Keynote, and Google Slides, it is an invaluable tool for business analysts, sales teams, and marketers aiming to communicate effectively with their stakeholders.


21 slides
Duskflare Corporate Strategy Proposal Presentation
Present your corporate strategy effectively with this comprehensive template, featuring sections on market trends, SWOT analysis, strategic initiatives, and risk management. Designed for clarity and impact, it’s ideal for outlining high-level goals and action plans. Compatible with PowerPoint, Keynote, and Google Slides for seamless presentations.


6 slides
Market Expansion Strategy with Asia Map Presentation
Explore new business frontiers with the Market Expansion Strategy with Asia Map template, your strategic platform for analyzing and expanding market presence across Asia. This presentation is designed to guide businesses through the complexities of Asian market landscapes. Featuring an integrated Asia map and designated spaces for in-depth insights, this template is ideal for corporate strategists and market analysts. It supports PowerPoint, Keynote and Google Slides for versatile presentation options.


4 slides
Construction Project Planning
Streamline your workflow and improve clarity with this vibrant project planning wheel designed for construction professionals. This slide helps visualize key phases—such as planning, team coordination, and logistics—using color-coded segments and editable icons. Perfect for architects, contractors, and project managers. Fully customizable in PowerPoint, Keynote, and Google Slides.


6 slides
Company Profile Insights Infographic
This set of templates is designed to convey critical company insights through a visually engaging presentation, ideal for showcasing a company’s core strengths and operational highlights. Each layout provides a structured approach to display key data points and insights that are vital to understanding the company's market position and strategic direction. The templates feature a variety of elements, such as statistical displays, financial summaries, and operational benchmarks, that provide a comprehensive snapshot of company performance. By integrating graphical representations like bar charts, pie charts, and progress indicators, these templates make complex data accessible and easily understandable. The color schemes and design elements can be customized to align with company branding, ensuring a cohesive look throughout the presentation. These are excellent tools for annual meetings, investor briefings, or internal reviews, enabling businesses to effectively communicate their achievements, identify trends in their operations, and guide strategic planning discussions. By utilizing these templates, companies can highlight their successes, areas for improvement, and future outlook in a clear and professional manner, fostering transparency and confidence among stakeholders.


4 slides
Enterprise IT Architecture Presentation
Visualize the foundation of your organization’s technology with this sleek, layered presentation. Designed to showcase system hierarchies, integration processes, and strategic frameworks, it simplifies complex IT concepts through a clear, structured layout. Fully customizable and compatible with PowerPoint, Keynote, and Google Slides for effortless professional presentations.


6 slides
Basic Numbers Infographic
This Basic Numbers Infographic is a visual representation of numerical data or information using simple graphical elements. This infographic template is a straightforward way to convey statistics, facts, or comparisons to your audience in a clear and engaging manner. The infographic includes a clean and uncluttered design while effectively presenting the numerical information. The visual elements enhance understanding and make the infographic visually appealing to your audience. The icons, symbols, and simple illustrations enhance the appeal of the infographic. Compatible with Powerpoint, Keynote, and Google Slides.


20 slides
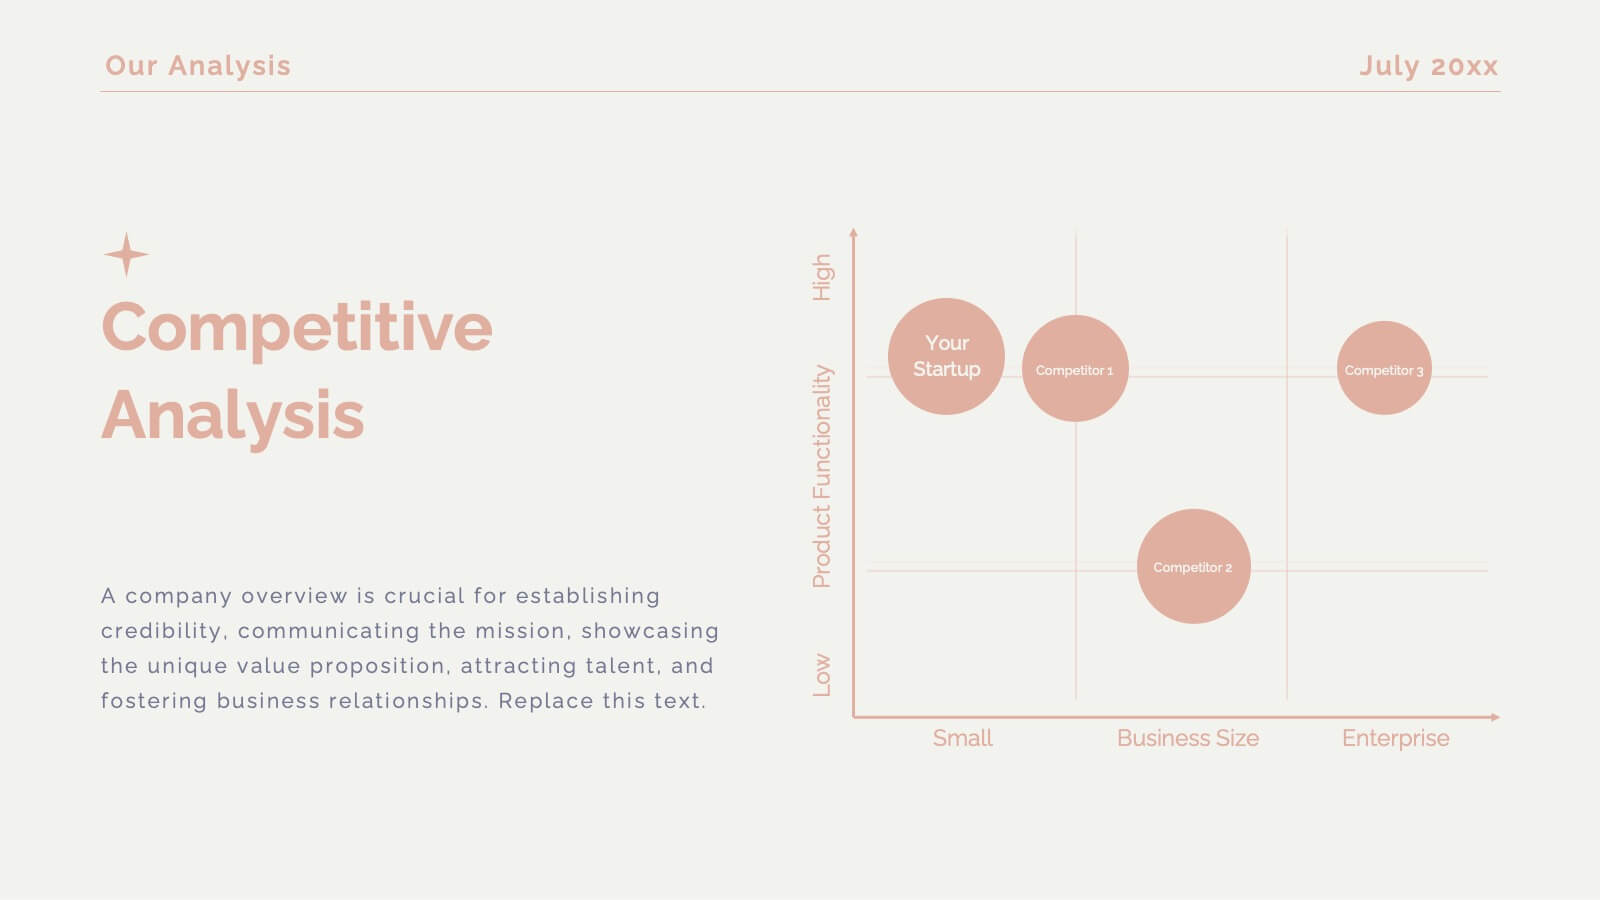
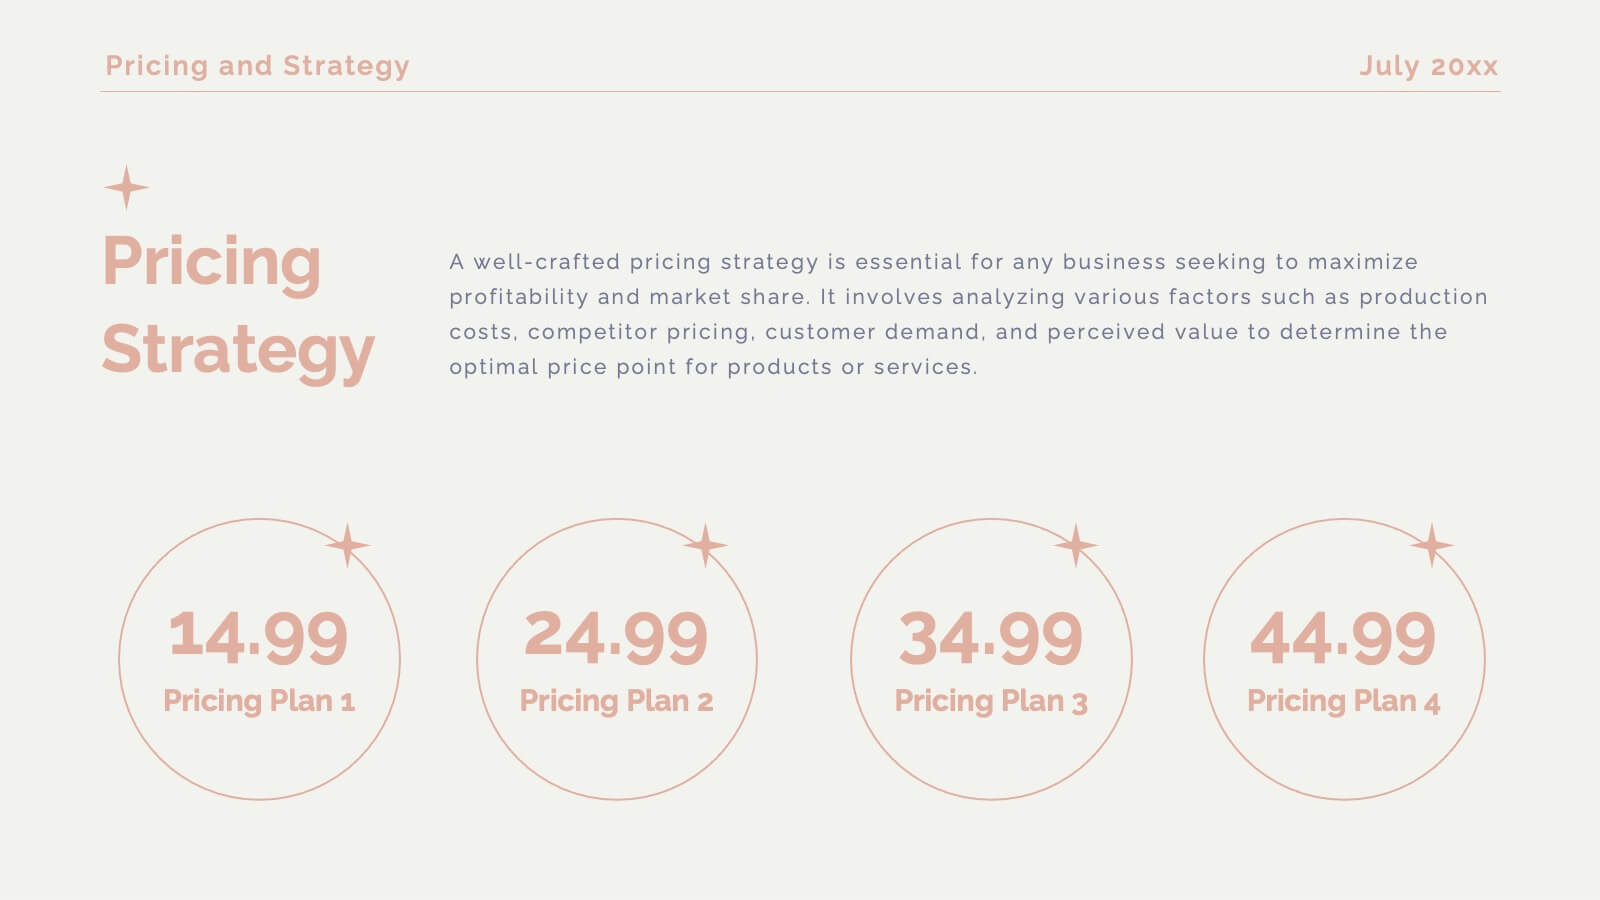
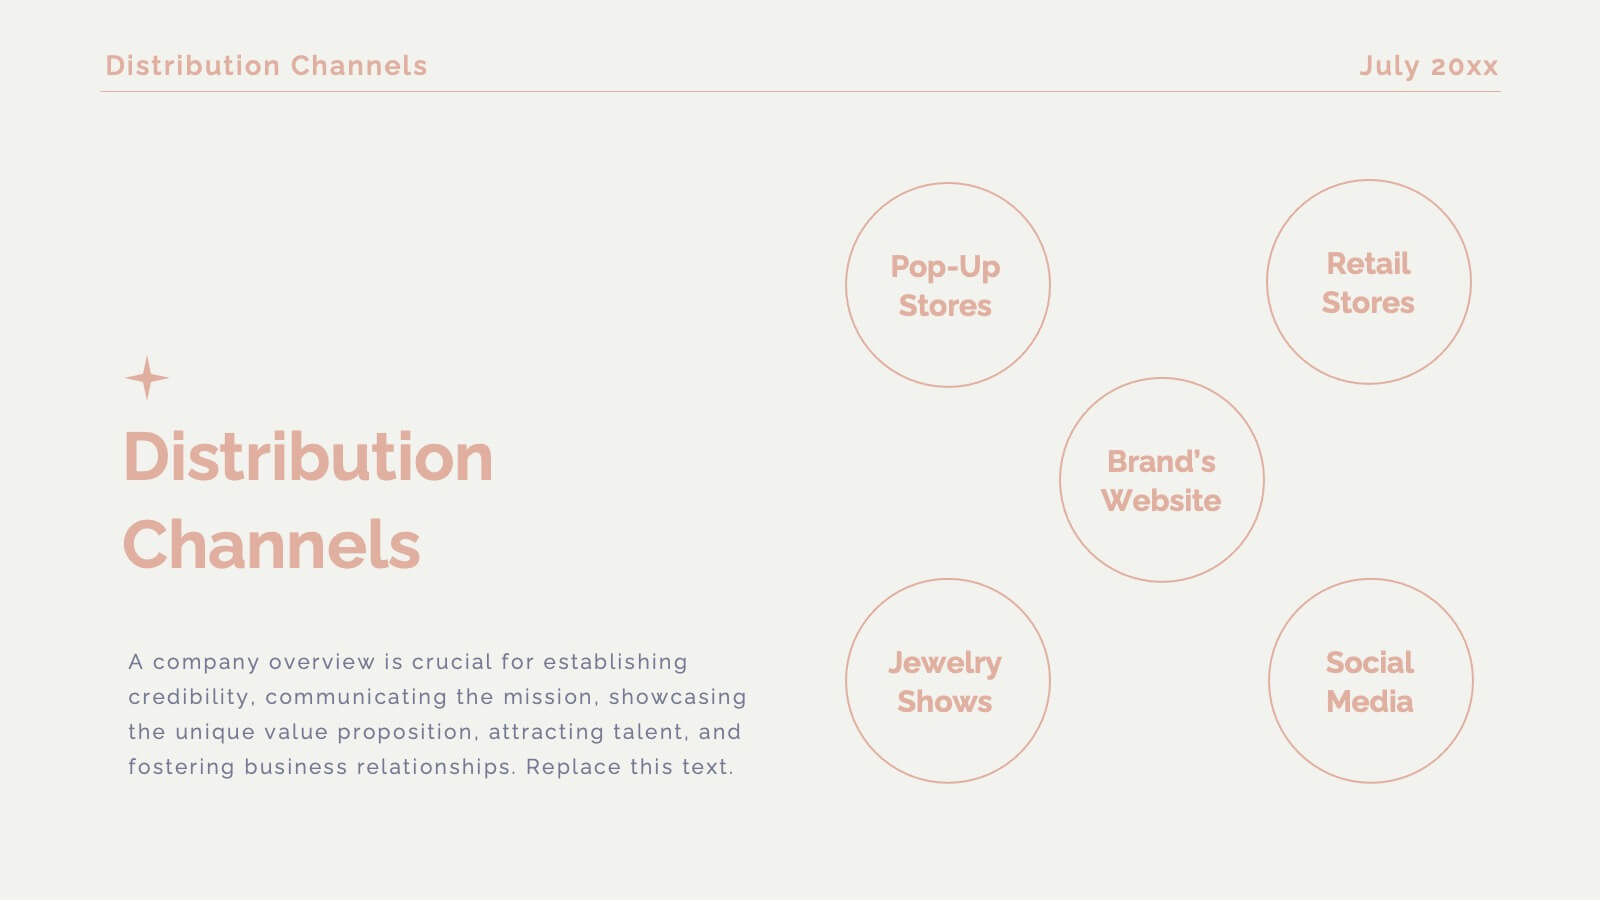
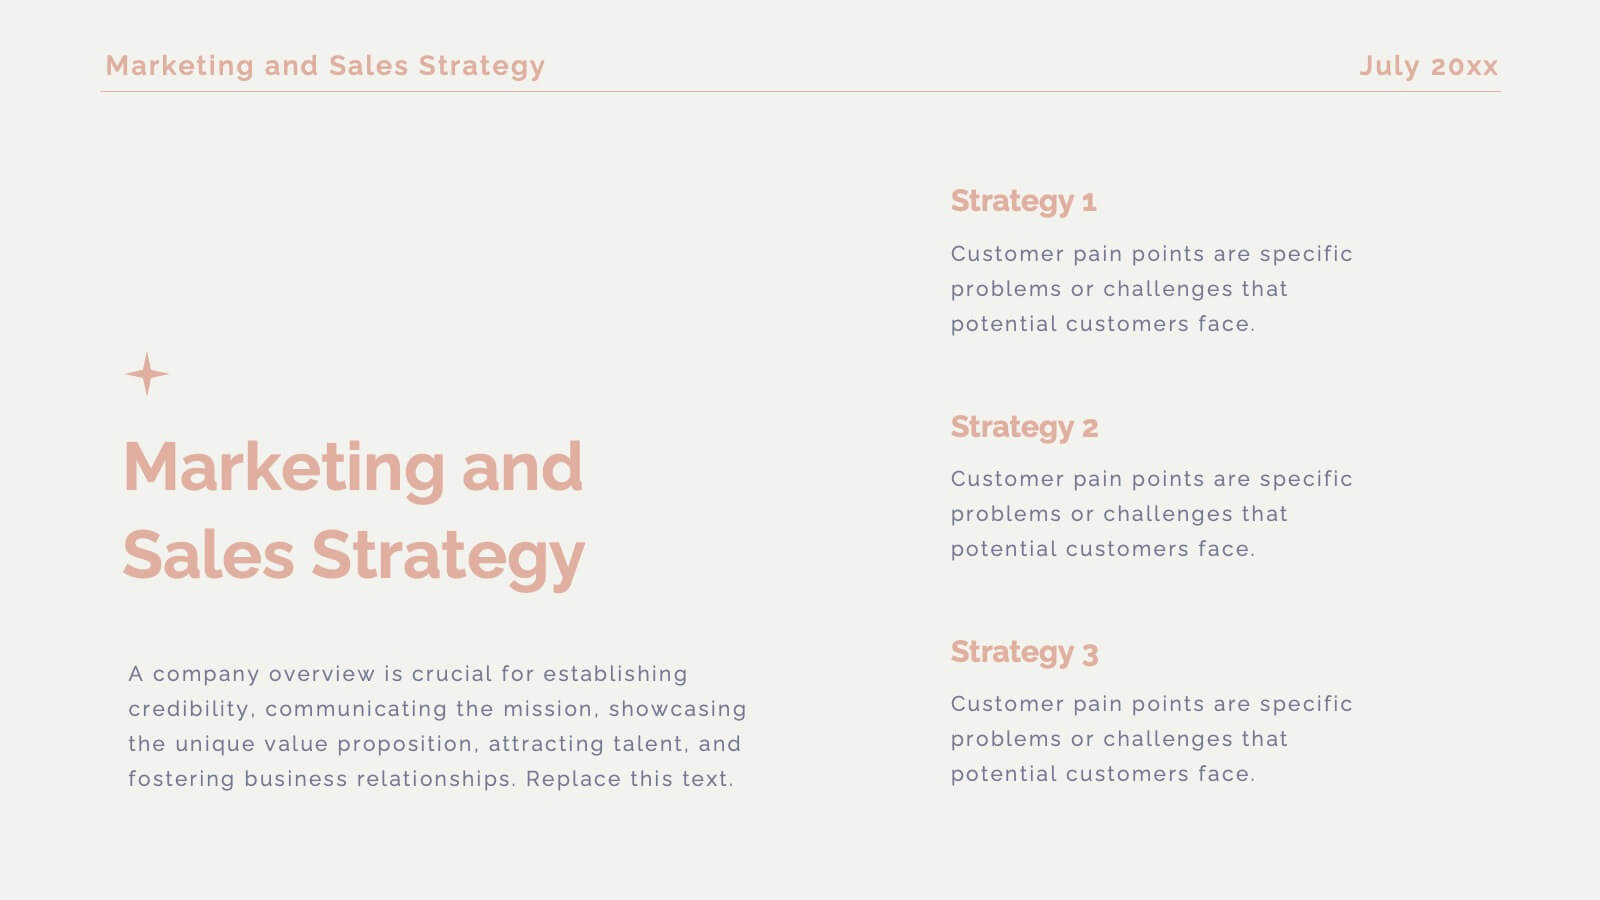
Legacy Product Launch Presentation
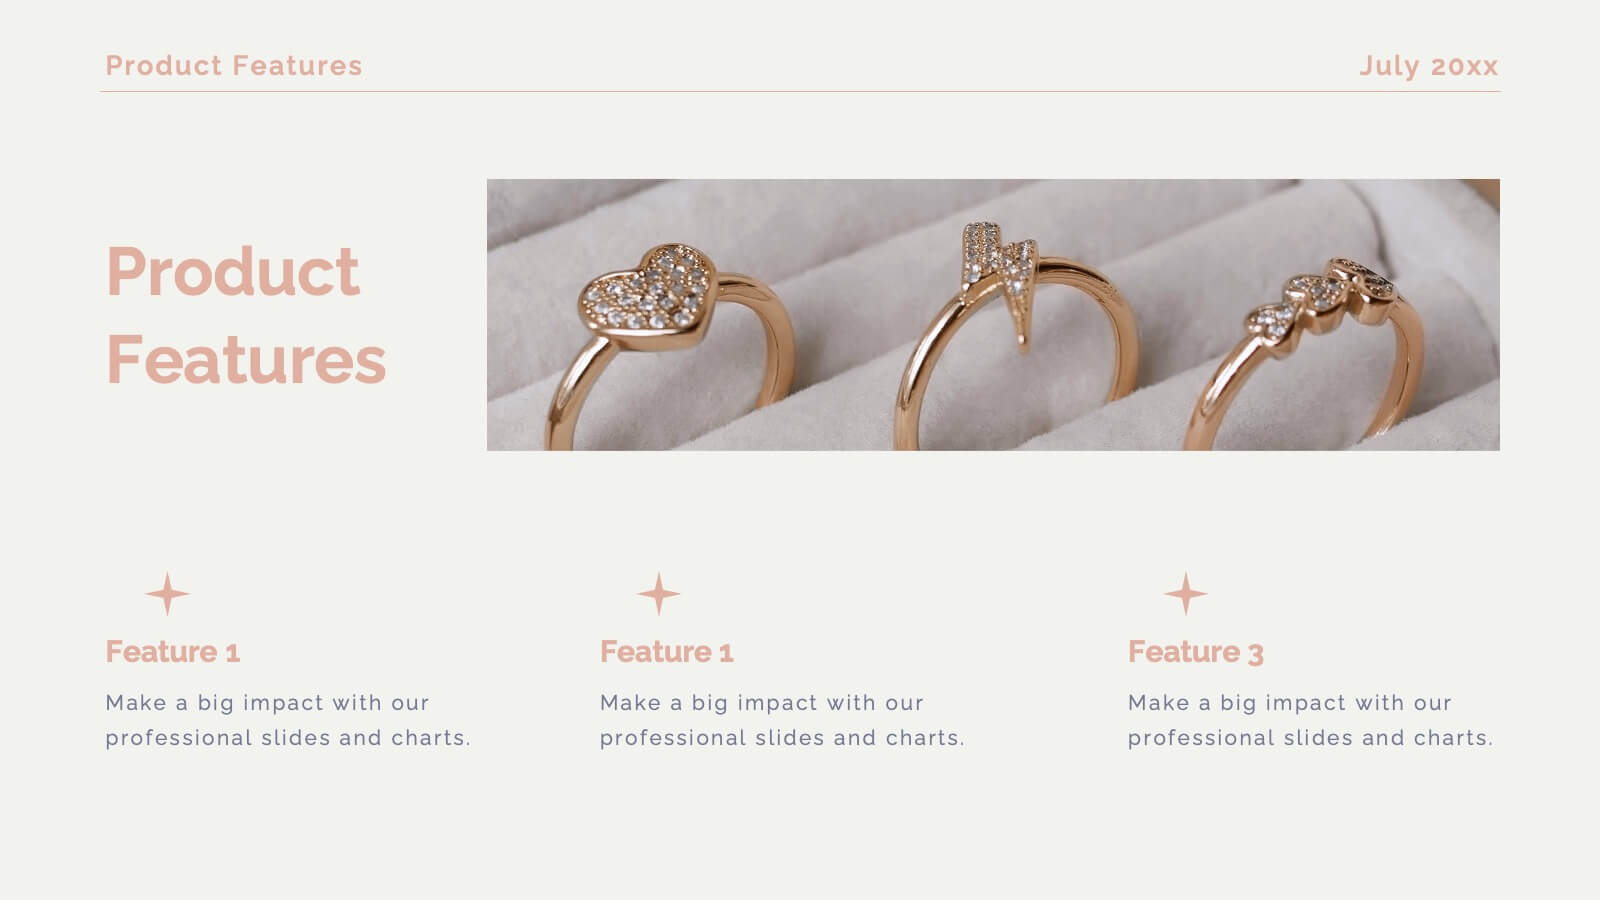
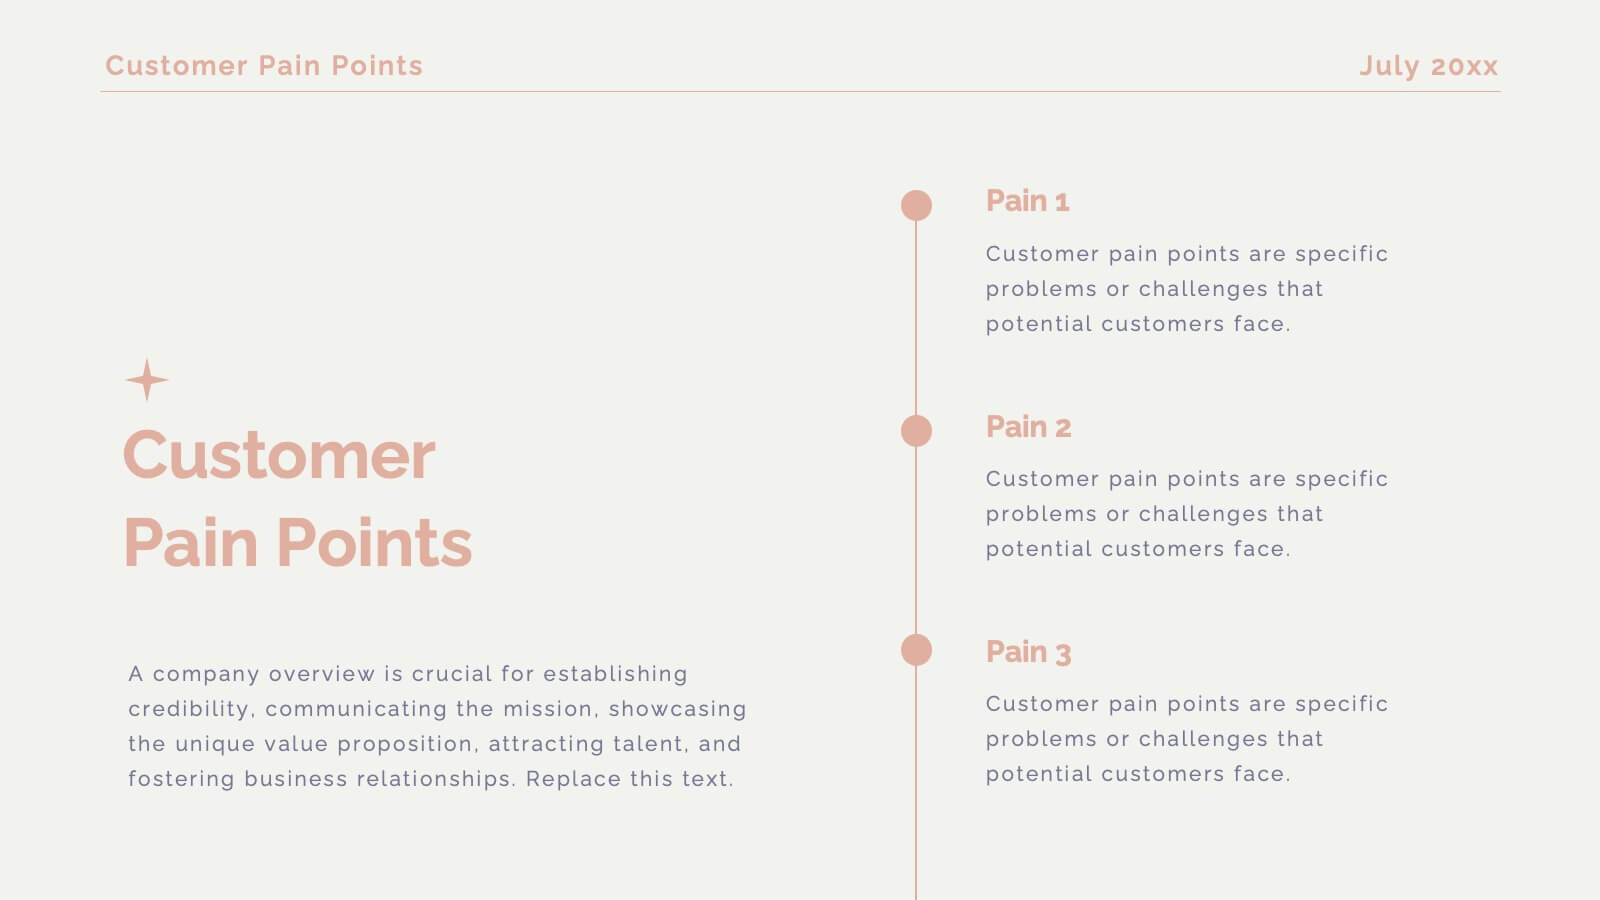
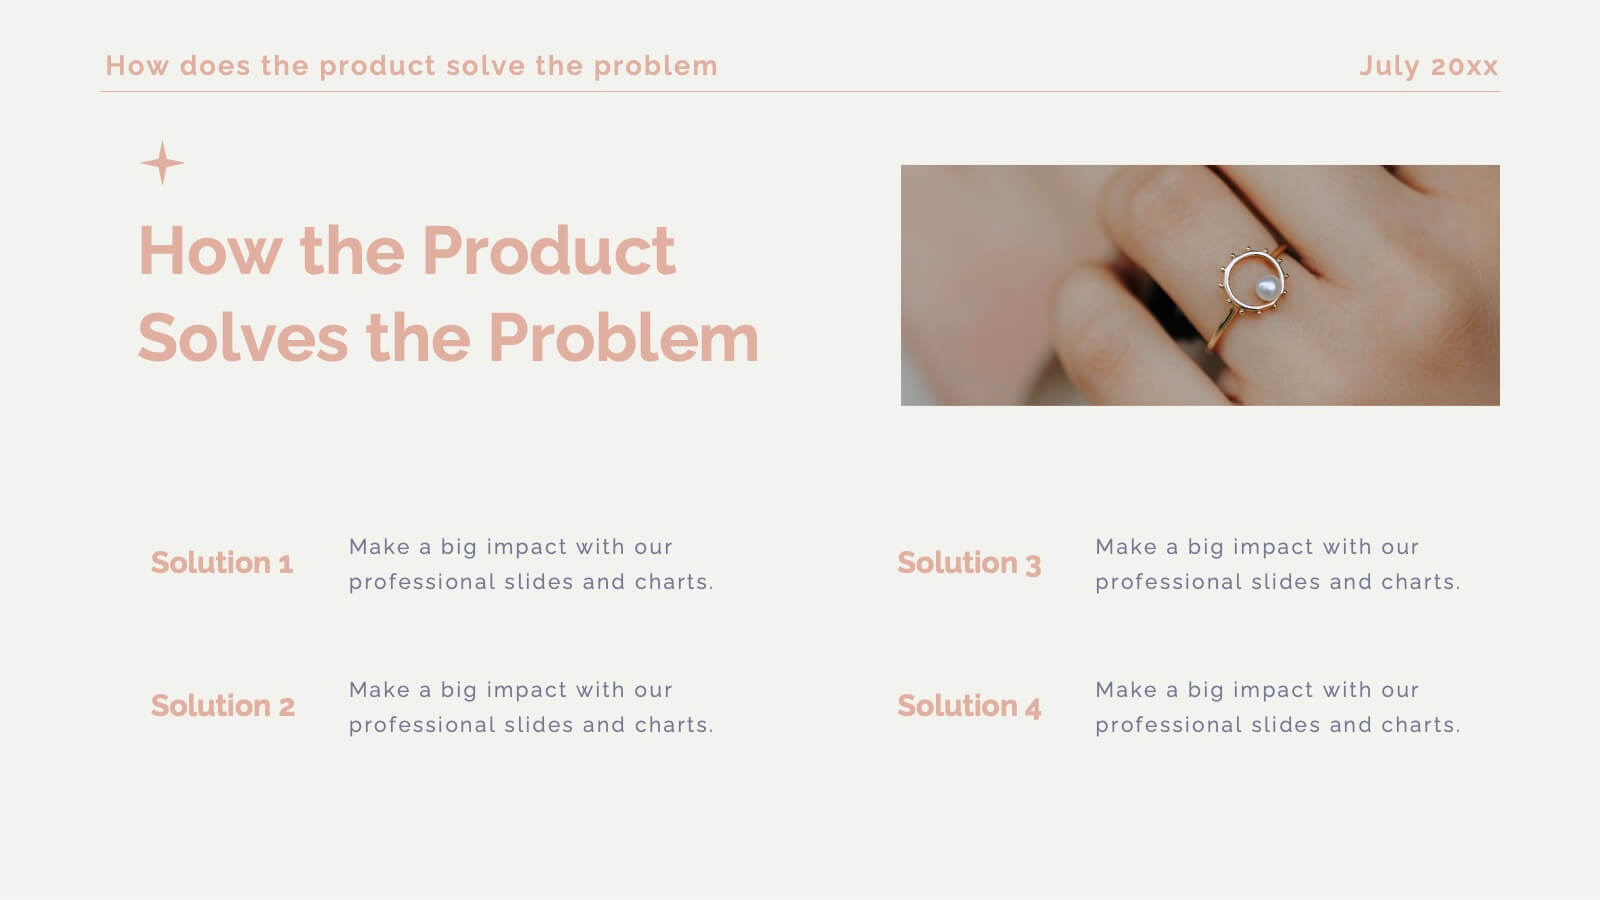
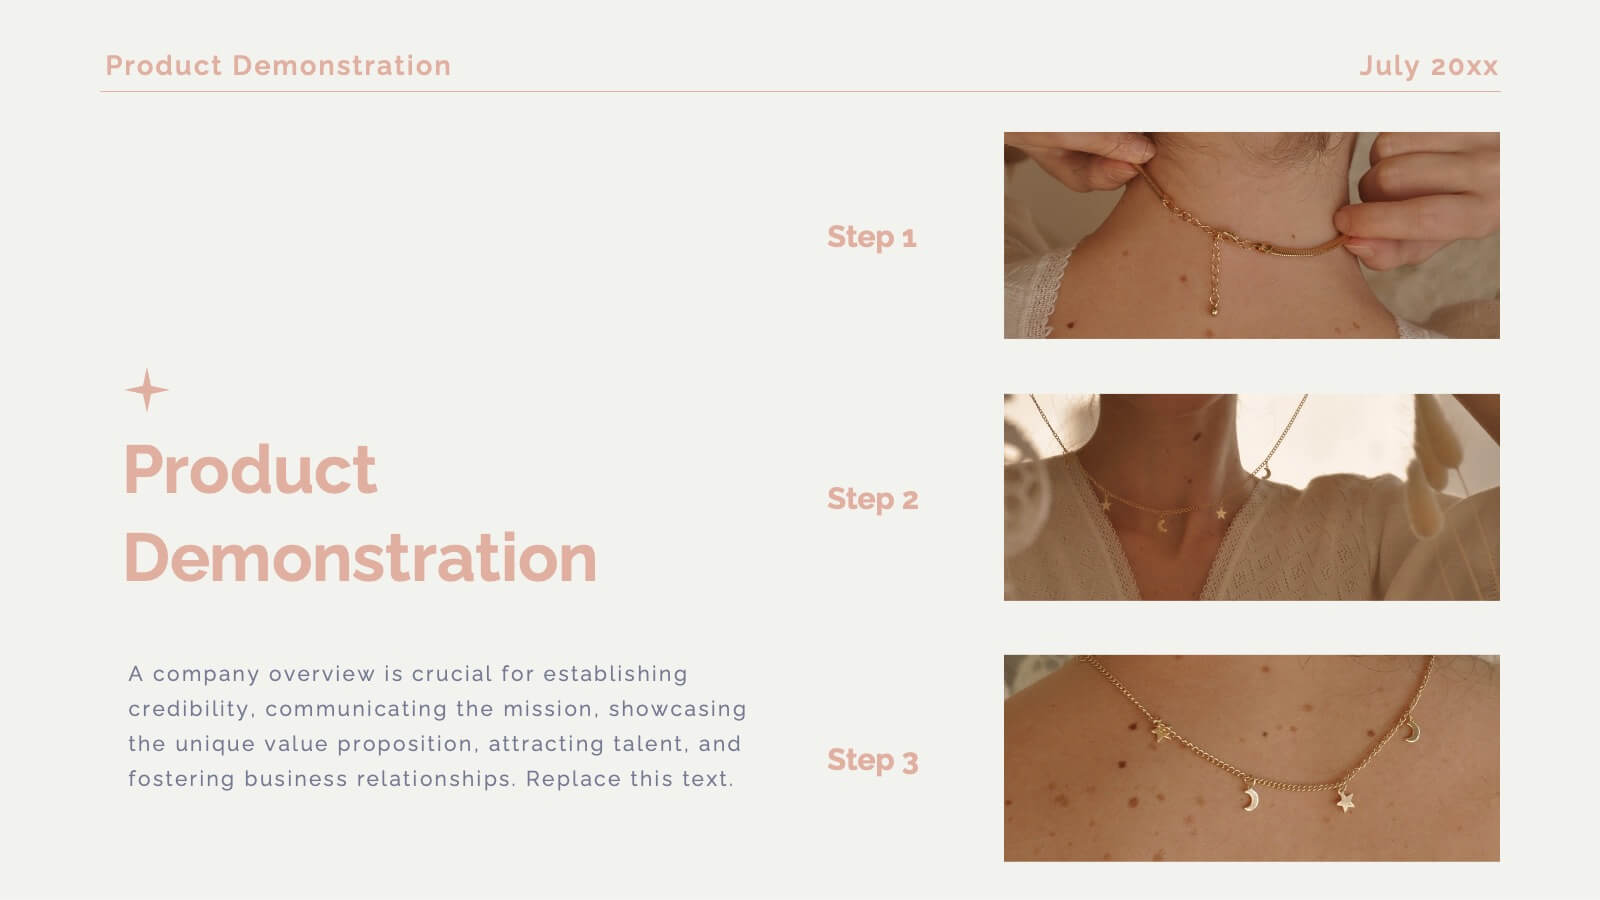
Get ready to unveil your product with a stunning and sophisticated launch template designed to captivate and convert! This template offers everything you need to present your product in the most compelling way possible, from an inviting welcome slide to an in-depth company overview that sets the stage for your brand’s story. The sleek design highlights key product features, unique selling propositions, and a thorough competitive analysis that positions your product as the market leader. With sections dedicated to customer pain points, solutions, and a powerful product demonstration, this template ensures your audience understands the value and impact of your offering. It also includes critical details like pricing strategy, distribution channels, and manufacturing processes, giving a full picture of your product’s journey from concept to market. Compatible with PowerPoint, Keynote, and Google Slides, this template is your ultimate tool for a successful product launch that leaves a lasting impression!


6 slides
Market Challenges and Competitive Solutions Presentation
Visually map out business hurdles and strategic responses with this sleek 6-step infographic layout. Perfect for showcasing pain points on one side and proposed solutions on the other, it's ideal for sales decks, strategy reports, or competitor analysis. Customize each icon, title, and section easily in PowerPoint, Keynote, or Google Slides.