


Features
- 4 Unique slides
- Fully editable and easy to edit in Microsoft Powerpoint, Keynote and Google Slides
- 16:9 widescreen layout
- Clean and professional designs
- Export to JPG, PDF or send by email


Do you have any questions?
Recommend


5 slides
Marketing Strategy Wheel Diagram Presentation
Visualize your marketing framework in a clear and engaging way with this Marketing Strategy Wheel Diagram. Designed to highlight key components like audience targeting, communication channels, and campaign goals, this circular format brings strategy to life. Fully customizable and compatible with PowerPoint, Keynote, and Google Slides. Ideal for marketers, agencies, and branding professionals.


4 slides
Task and Role Allocation Matrix
Clarify team responsibilities with this modern Task and Role Allocation Matrix. Easily visualize who is Responsible, Accountable, Contributing, and Informed for each task. Ideal for team leaders, HR planners, and project coordinators. Fully customizable in PowerPoint, Keynote, and Google Slides.
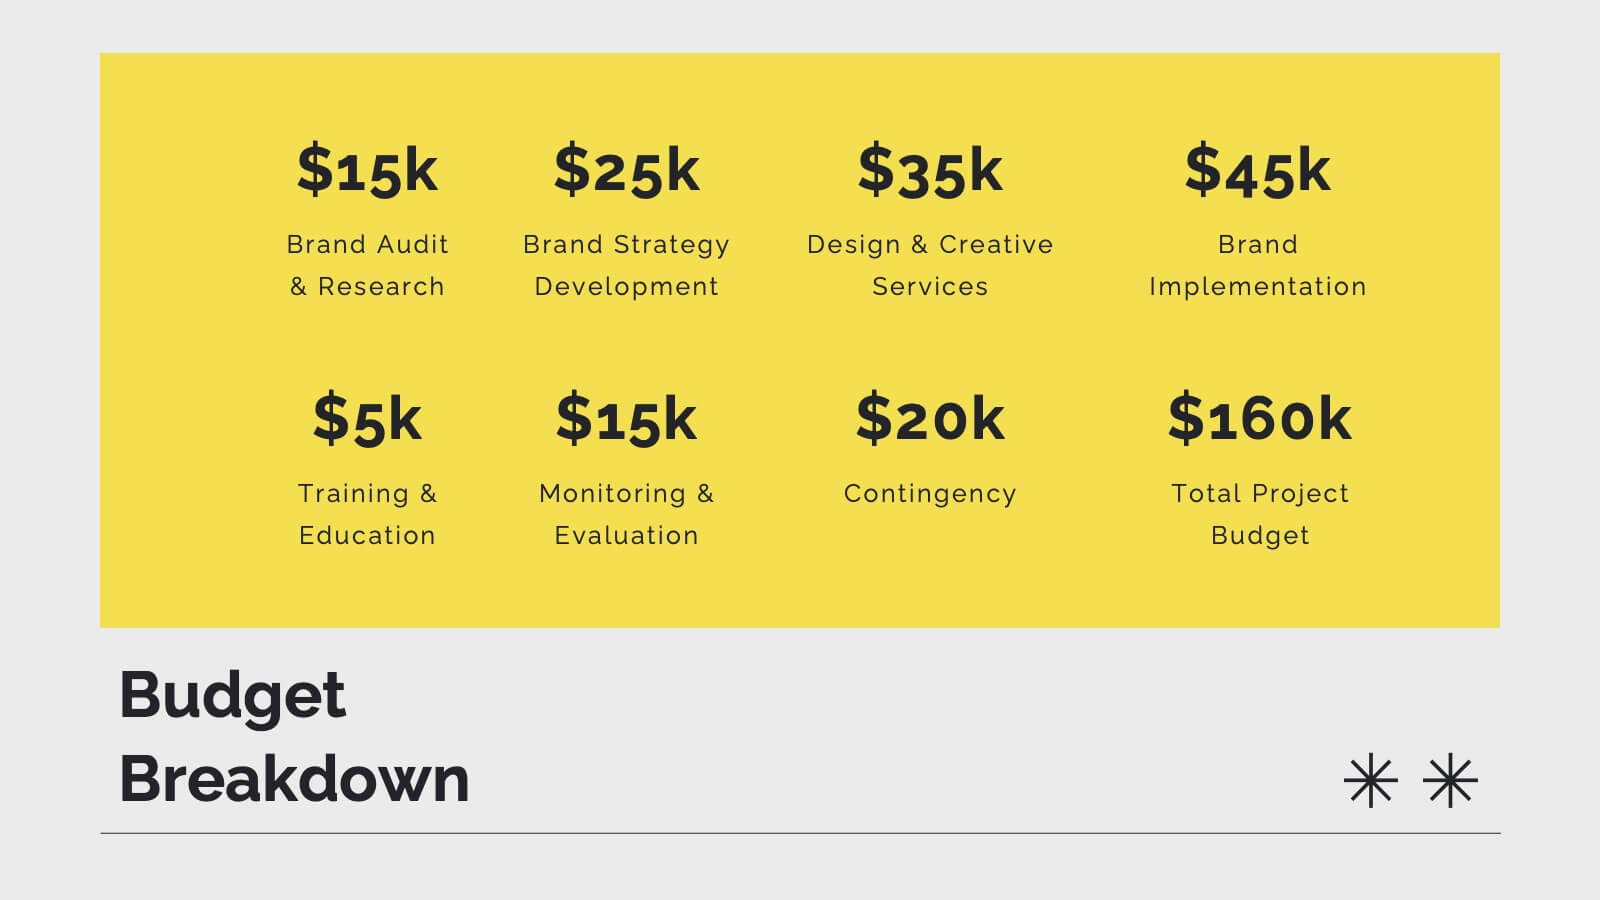
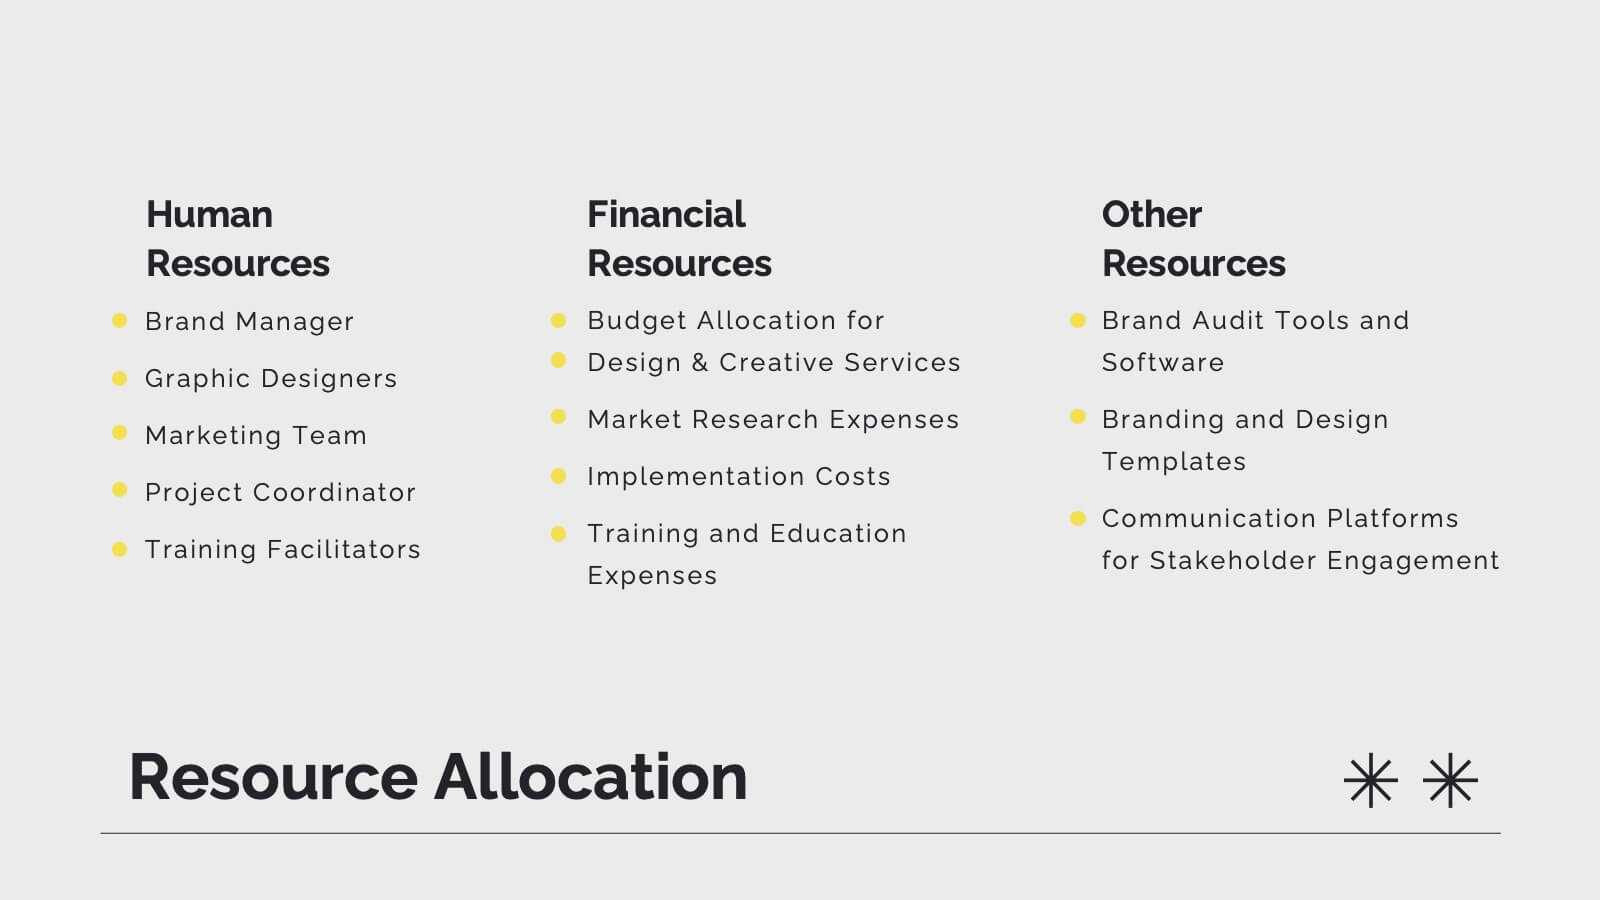

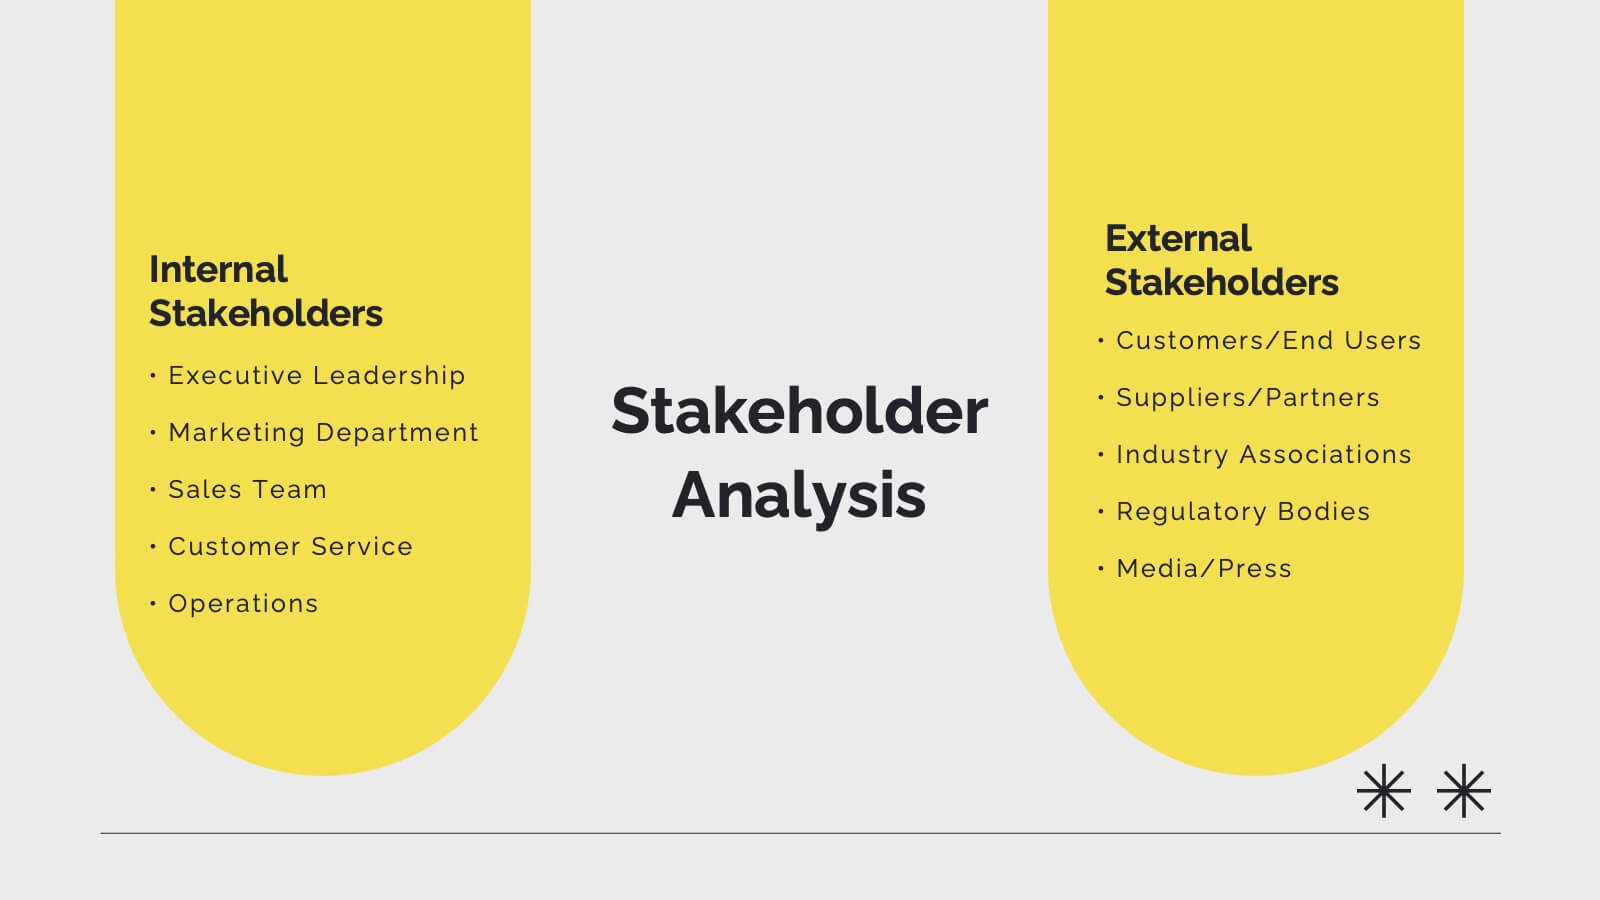


21 slides
Pulse Project Management Plan Presentation
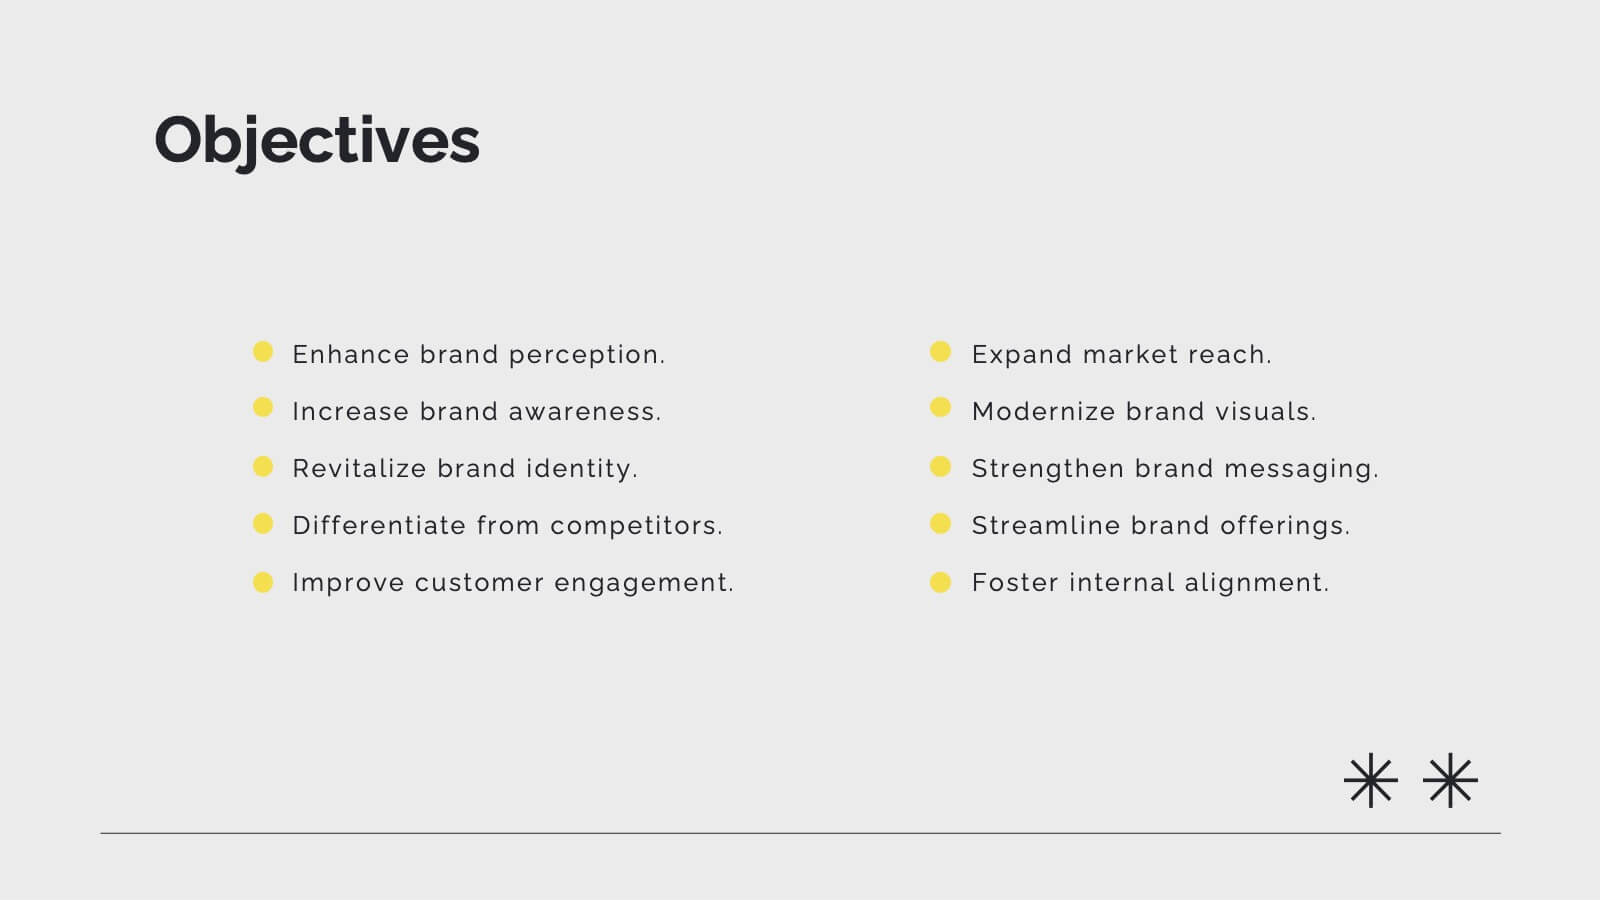
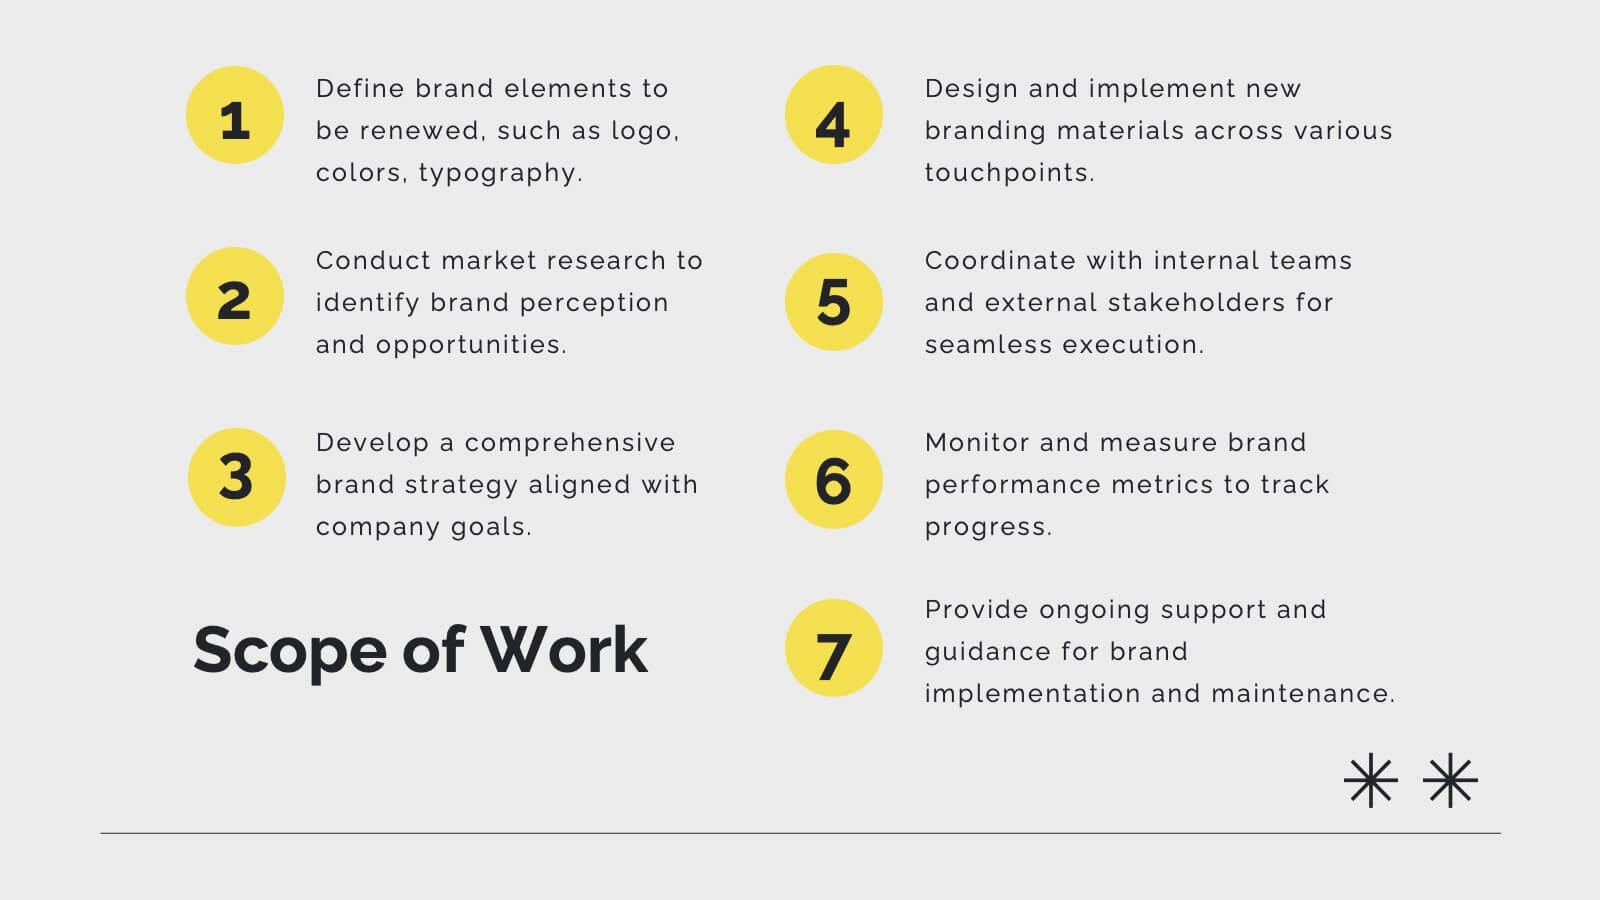
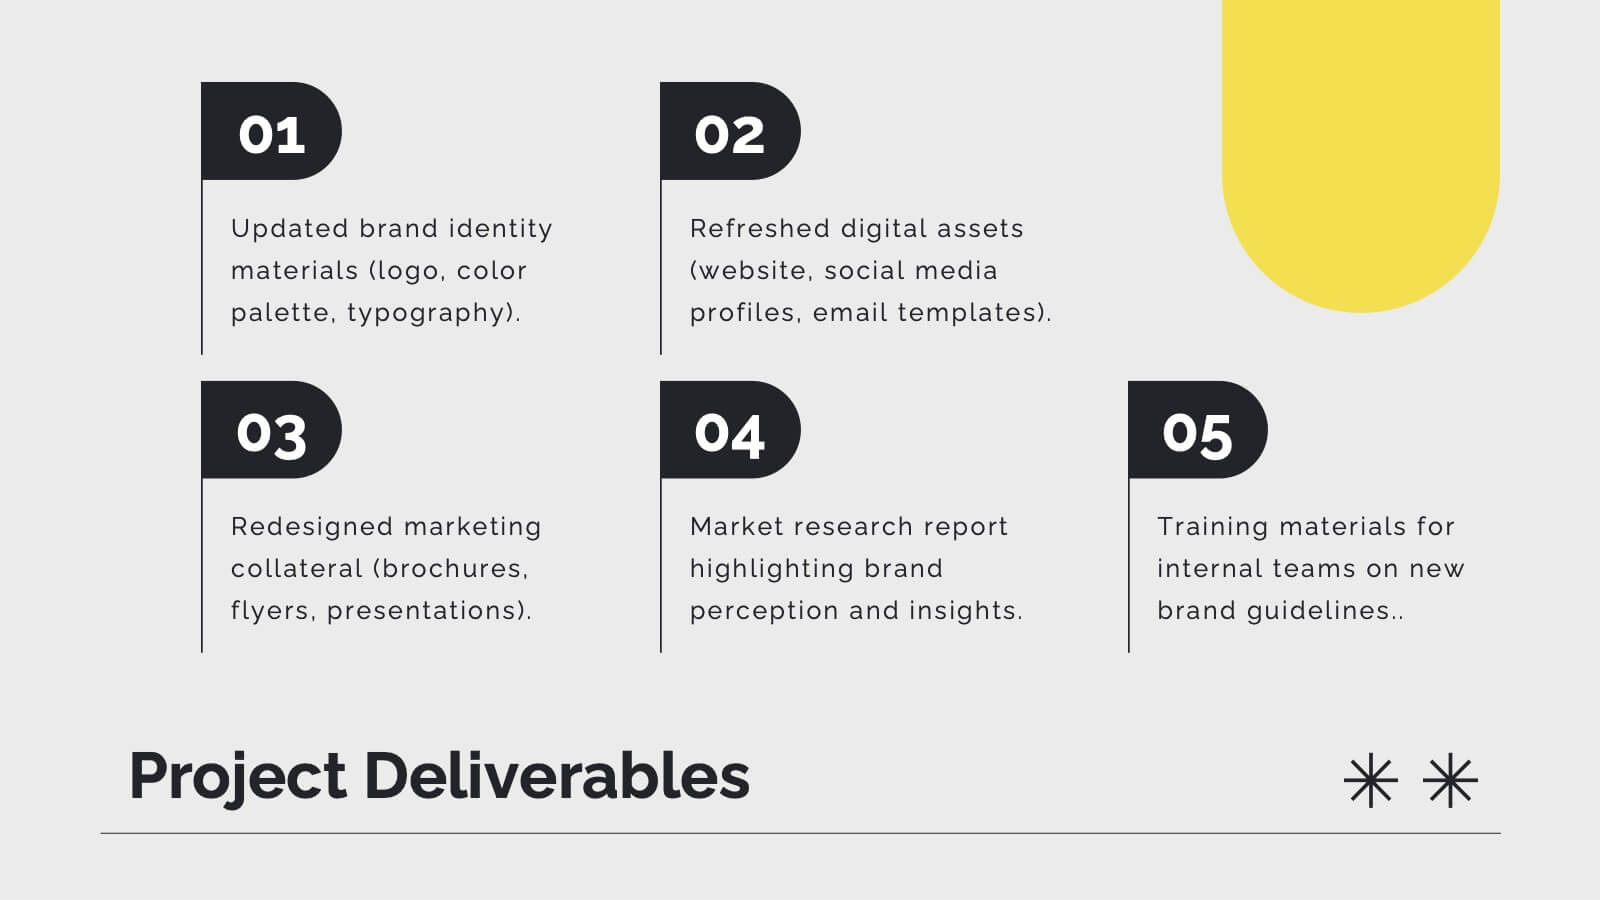
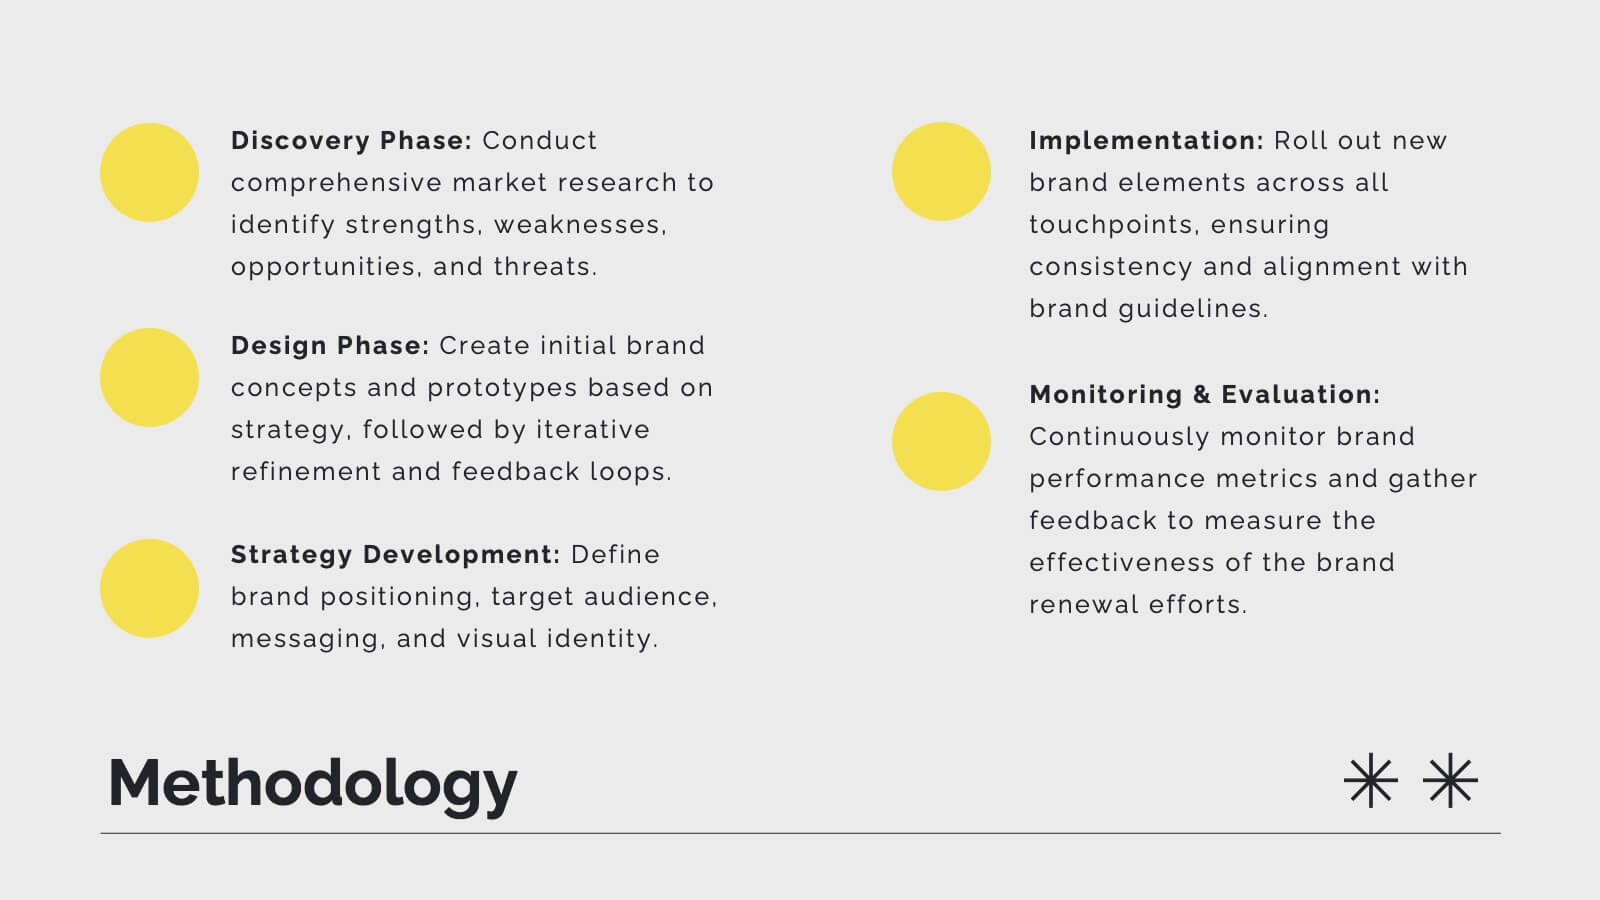
Streamline your project management with this vibrant template. It covers project overview, objectives, deliverables, methodology, timeline, budget, and risk management. Perfect for clear and engaging presentations. Compatible with PowerPoint, Keynote, and Google Slides for seamless customization.


8 slides
Environmental Impact Reporting Presentation
Showcase sustainability data with clarity using the Environmental Impact Reporting Presentation. Perfect for tracking plastic usage, waste trends, and eco-initiatives. The infographic-style visuals highlight four distinct data points with bold icons and labeled callouts. Fully editable in PowerPoint, Keynote, and Google Slides—ideal for ESG reports, audits, or environmental awareness campaigns.


26 slides
Simplified Home Decor Presentation
Bring a breath of fresh air to interior design with this elegant presentation template, perfect for unveiling the beauty of simplified home decor. The template's clean lines and soft color palette evoke the minimalist charm and serene ambiance of modern living spaces. Each slide offers a harmonious blend of imagery and text, showcasing tranquil interiors that speak volumes about the less-is-more philosophy. From showcasing key principles of minimalist design to offering tips on decluttering and organizing, this template guides viewers through the transformative process of creating a peaceful home environment. Infographics lend themselves to discussing color schemes, space functionality, and the impact of natural light, making this a comprehensive tool for interior designers, home organizers, or decor enthusiasts. Fully compatible with PowerPoint, Keynote, and Google Slides, this template is a canvas for creativity, ready to inspire and engage audiences in the art of living simply and stylishly.


3 slides
Agriculture Sector Insights Presentation
Bring data to life with a presentation that captures the essence of growth and sustainability. Ideal for showcasing trends, production metrics, or environmental insights, this design blends visual storytelling with professional clarity. Fully editable and compatible with PowerPoint, Keynote, and Google Slides for effortless customization and impactful delivery.


7 slides
Network Infographics Presentation Template
Networking is a great way to meet people in your same field and gain valuable information. It's a great way to meet and connect with other professionals, find out about job opportunities, and keep up with what's new in your field. This template is perfect for becoming informed on the benefits of networking. Networking is a powerful way to expand your circle of contacts and get in touch with people who can help you advance in your career. This template includes a helpful infographic that explains the standard process, visualizations and diagrams, providing you with a great starting point.
8 slides
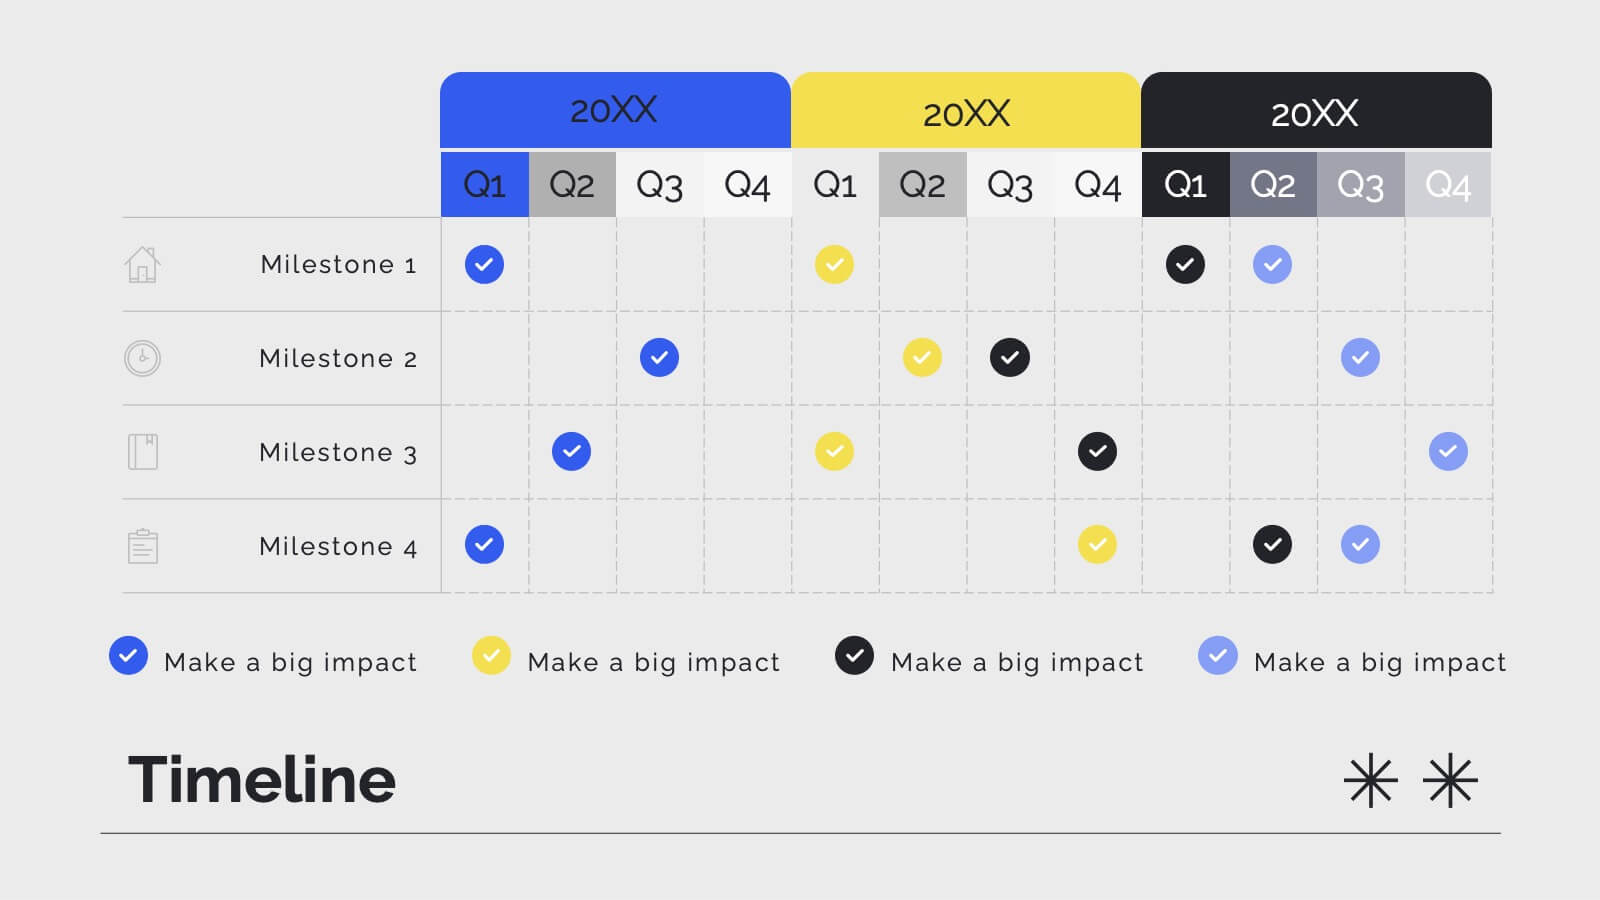
Key Project Milestone Tracker
Stay on top of progress with this streamlined Key Project Milestone Tracker. Designed to showcase up to eight critical milestones with corresponding years, this timeline helps visualize project phases and deadlines clearly. Fully editable in PowerPoint, Keynote, and Google Slides for easy customization.


12 slides
User Experience Journey Presentation
The "User Experience Journey Presentation" template offers a comprehensive visualization of the stages involved in user interaction with a product or service. This infographic template maps out each phase of the user experience journey, depicted in a sequence of steps marked from A to F, each stage highlighted with unique icons and a gradient color scheme enhancing visual appeal and understanding. Suitable for UX professionals, marketers, and product developers, this template aids in illustrating the process from initial contact to post-use evaluation, emphasizing key points at each stage. It is an invaluable tool for presentations aimed at enhancing customer satisfaction and optimizing user interaction strategies.


2 slides
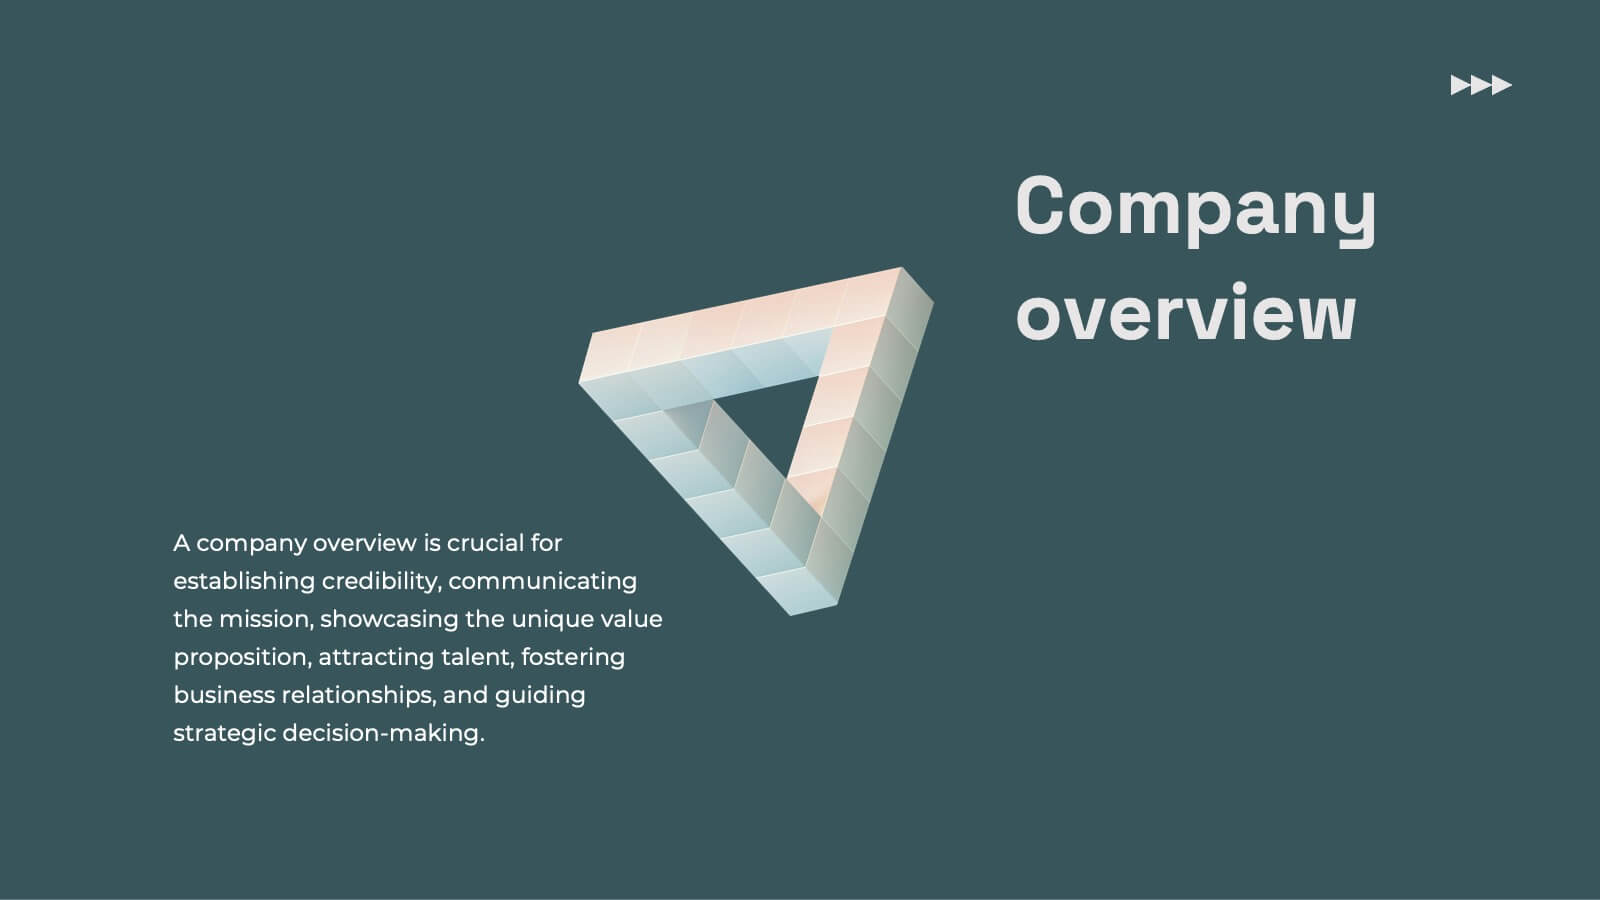
Opening Company Profile Introduction Presentation
Make a bold first impression with the Opening Company Profile Introduction Presentation — a sleek, modern design perfect for business overviews, team intros, or brand missions. Featuring clean typography and a purple accent shape that adds personality without distraction, this layout is ideal for concise, professional messaging. Fully editable and compatible with Canva, PowerPoint, Google Slides, and Keynote.


5 slides
Flow Chart for Decision Trees
Clarify complex decisions with the Flow Chart for Decision Trees Presentation. This layout uses a vertical tree design with branching logic paths, making it perfect for outlining strategic choices, workflows, or evaluation criteria. Featuring five customizable sections with icon support and placeholder text, this template works seamlessly in PowerPoint, Keynote, and Google Slides.


19 slides
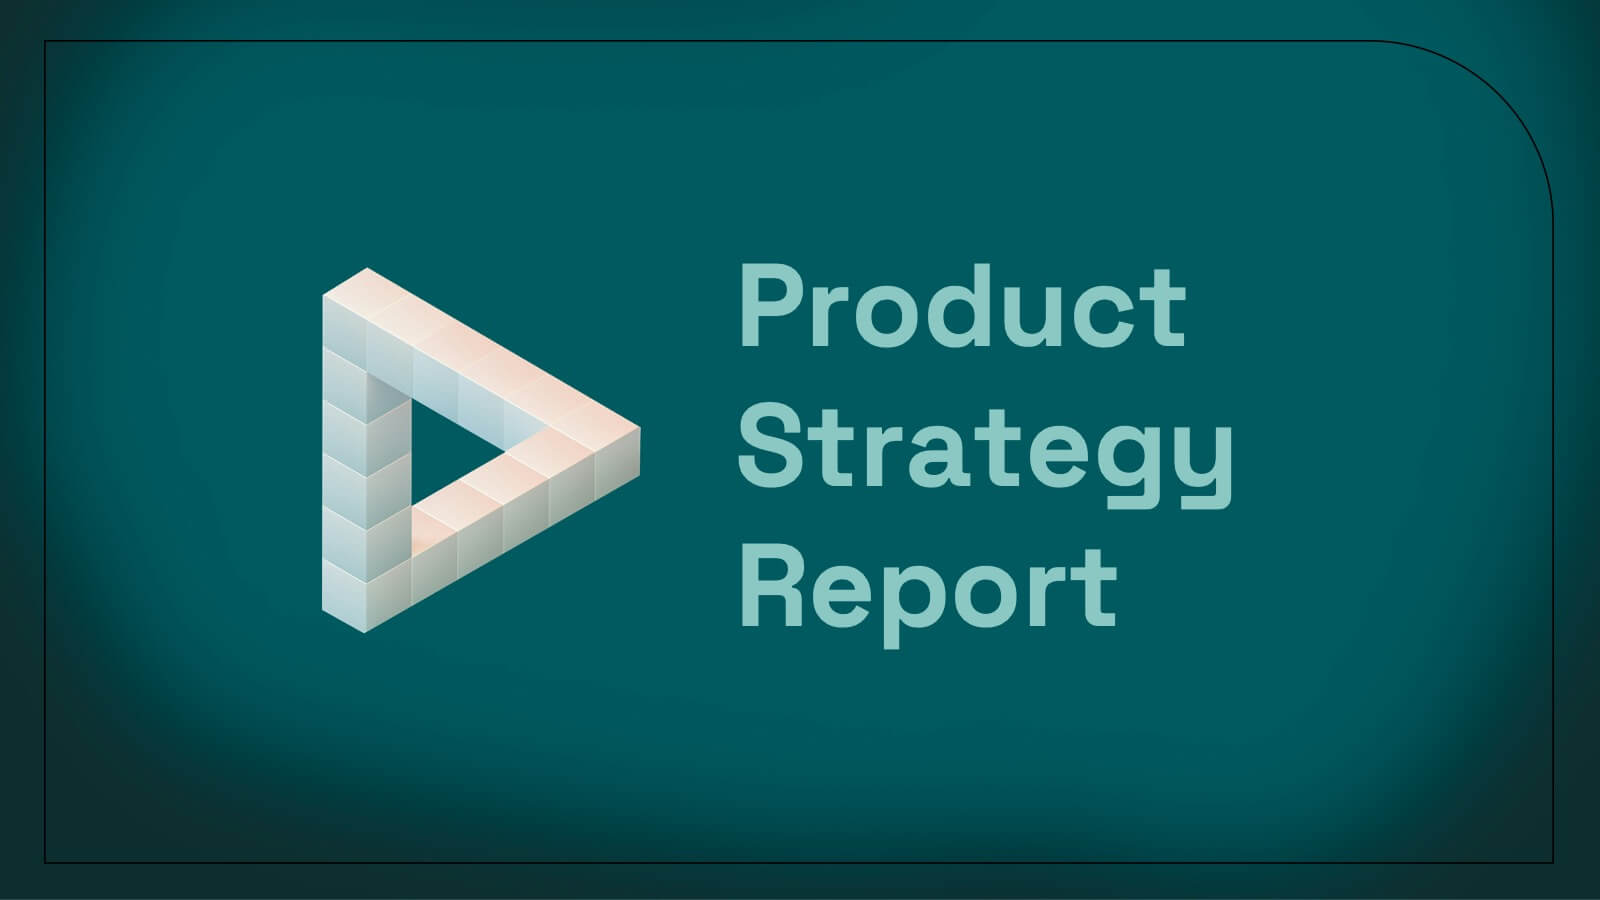
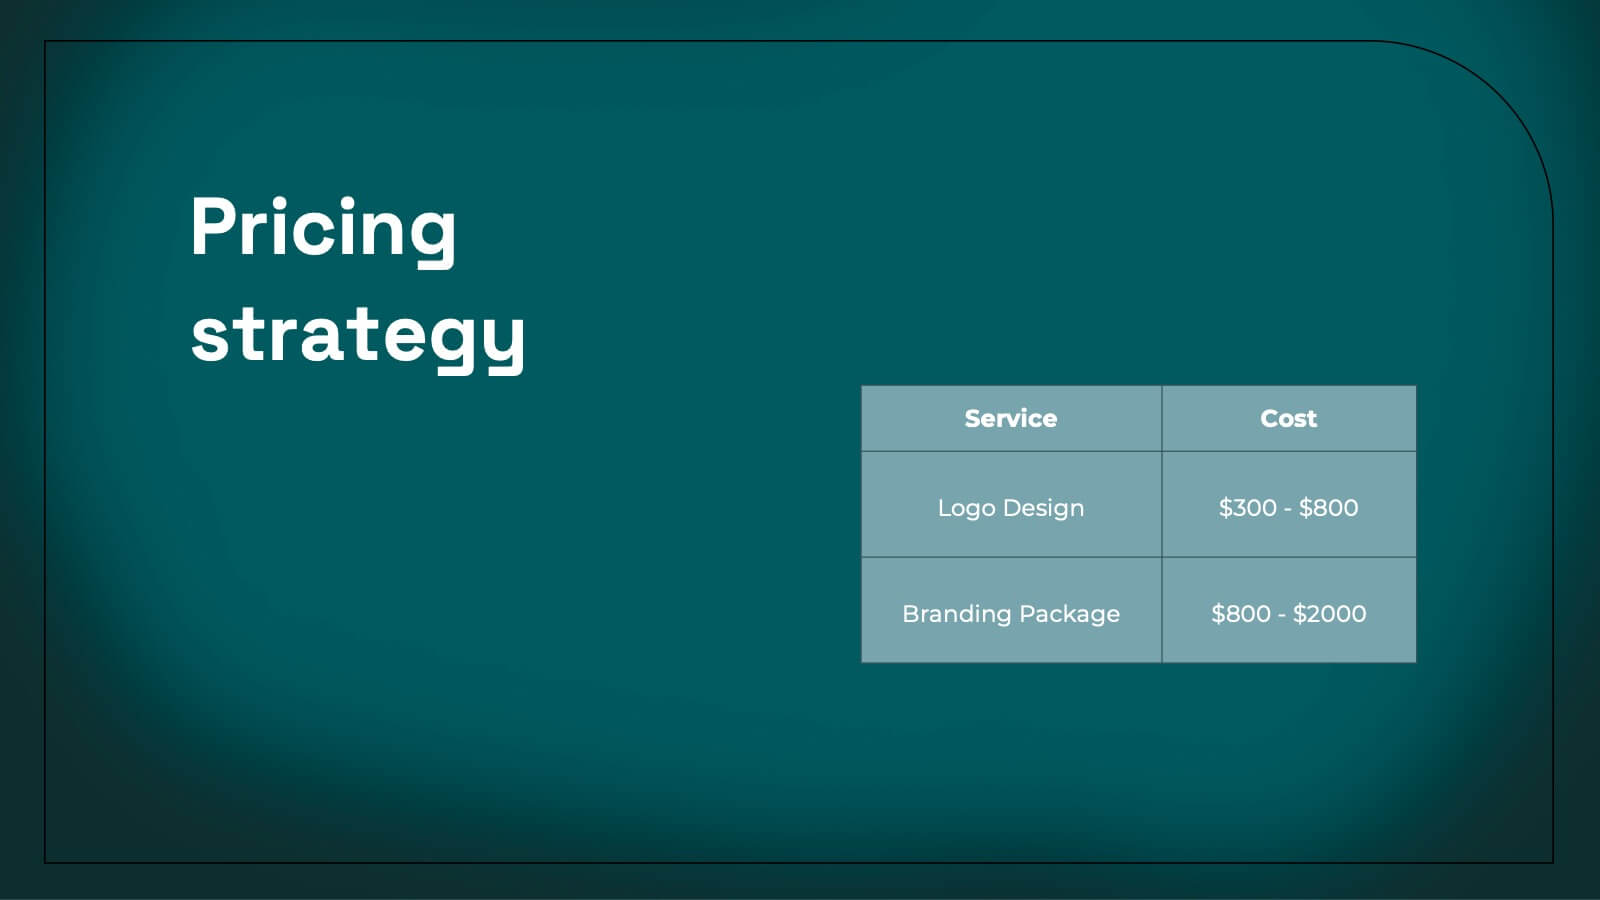
Kale Product Strategy Report Presentation
Unleash the power of your product with this bold and dynamic product strategy report template! Elevate your presentation with eye-catching designs that showcase product features, competitive analysis, and pricing strategies like never before. Captivate your audience from start to finish and leave a lasting impression. Fully compatible with PowerPoint, Keynote, and Google Slides!


6 slides
Blue Ocean Strategy Business Model
Capture new market spaces with this innovative Blue Ocean Strategy slide. Designed with a dynamic hourglass visual, it helps you showcase differentiation and low-cost strategies clearly. Perfect for business strategy sessions, growth planning, and innovation discussions. Fully editable in PowerPoint, Keynote, and Google Slides.


6 slides
Wellness Program and Health Strategy Presentation
Bring your strategy to life with this clean and creative visual! This presentation template uses a six-part flower design to help you showcase your wellness goals, health strategies, or program pillars with clarity and balance. It’s fully editable and works perfectly in PowerPoint, Keynote, and Google Slides for flexible customization.


4 slides
Strategic Takeaways and Final Points Presentation
Summarize key insights and final thoughts with this clean, icon-based layout. Ideal for wrapping up business reviews, strategy decks, or executive briefings, each section includes room for concise summaries and visuals. Easily customizable in PowerPoint, Keynote, and Google Slides to match your brand and presentation goals.


5 slides
Customer Satisfaction Survey Ratings Presentation
Present customer insights with clarity using this Customer Satisfaction Survey Ratings slide. Designed with a vertical timeline beside a thumbs-up icon, it’s perfect for showcasing key survey data, feedback percentages, or sentiment trends. Each rating step includes editable text and color-coded markers for easy comparison. Compatible with PowerPoint, Canva, and Google Slides.


8 slides
Marketing Plan and Audience Targeting Presentation
Visualize your audience segmentation strategy with the Marketing Plan and Audience Targeting Presentation. This bullseye diagram template highlights three key focus areas, making it ideal for showcasing market research, targeting tactics, or funnel stages. Fully editable in Canva, PowerPoint, Keynote, and Google Slides to match your branding and goals.