


Features
- 4 Unique slides
- Fully editable and easy to edit in Microsoft Powerpoint, Keynote and Google Slides
- 16:9 widescreen layout
- Clean and professional designs
- Export to JPG, PDF or send by email


Do you have any questions?
Recommend


20 slides
Elementra Marketing Proposal Presentation
Elevate your marketing initiatives with this professional and well-structured proposal template. Covering essential sections such as objectives, goals, budget breakdown, timeline, and pricing structure, this presentation helps you effectively communicate your strategy to stakeholders and clients. Its clean, modern design ensures clarity and engagement, making it ideal for pitching ideas and securing approvals. Fully customizable and compatible with PowerPoint, Keynote, and Google Slides.


7 slides
Sustainable Agriculture Infographic Presentation
An Agriculture Infographic presents information and data related to agriculture and the farming industry. This template is designed to cover a wide range of topics, including crop production, livestock farming, food processing, distribution, and sustainable agriculture practices. Use this infographic to provide information on the economic, social, and environmental impacts of agriculture, as well as to showcase new technologies and innovations in the farming industry. This infographic includes 7 slide layouts each with unique illustrations related to agriculture, charts, and diagrams.


34 slides
Founder Startup
A Founder Startup, is a newly established business venture that is typically founded by one or more individuals or groups with an innovative idea, concept, or product. This template is designed to help you create a professional and compelling presentation that showcases your startup and its founders in a impactful way. Compatible with PowerPoint, Keynote, and Google Slides. Included in this template are a variety of pre-designed slides that will help cover different aspects of your startup, such as team introduction, overview, vision and mission, product or service description, market analysis, financials, and more.


6 slides
Engagement Survey Results Infographics
Effectively communicate your engagement survey results with our Engagement Survey Results infographic template. This template is fully compatible with popular presentation software like PowerPoint, Keynote, and Google Slides, allowing you to easily customize it to illustrate and convey your survey findings. The Engagement Survey Results infographic template offers a visually engaging platform to present survey data, key findings, and insights related to employee or customer engagement. Whether you're an HR professional, manager, or business leader, this template provides a user-friendly canvas to create informative presentations and reports on engagement survey outcomes. Optimize your communication of survey results with this SEO-optimized Engagement Survey Results infographic template, thoughtfully designed for clarity and ease of use. Customize it to showcase survey methodology, response rates, visualizations of data, and action plans based on the findings, ensuring that your audience gains a comprehensive understanding of the survey results and their implications. Start crafting your personalized infographic today to effectively communicate engagement survey outcomes.


21 slides
Aetherial UX Research Report Presentation
A professional and modern template for UX research presentations. Highlight key elements such as user personas, journey mapping, wireframes, and testing processes. Includes slides for accessibility considerations, design systems, and feedback iteration. Fully customizable and compatible with PowerPoint, Keynote, and Google Slides to deliver impactful insights and research findings.


4 slides
Task Workflow and Process Automation Presentation
Streamline complex systems with the Task Workflow and Process Automation Presentation. This flowchart-based layout is perfect for visualizing step-by-step procedures, automation pipelines, or operational structures. Each phase is clearly separated, making it easy to track tasks, decisions, and outcomes. Ideal for IT, operations, or management teams. Fully editable in PowerPoint, Keynote, and Google Slides.


7 slides
Corporate Sustainability Management
Visualize your sustainability priorities with this hexagon-based framework slide, designed to highlight areas like environmental impact, health, welfare, and ethical governance. Ideal for CSR reporting, ESG strategy sessions, or internal sustainability initiatives. Easy to customize in PowerPoint, Keynote, and Google Slides.


4 slides
Project Responsibility Chart
Streamline team coordination with this Project Responsibility Chart. Clearly define who is Responsible, Accountable, Consulted, and Informed across key tasks. Ideal for project managers and team leads ensuring role clarity. Fully editable in PowerPoint, Keynote, and Google Slides.


4 slides
Marketing Campaign Action Plan Presentation
Drive impactful marketing results with the Marketing Campaign Action Plan presentation. This structured and visually engaging template helps you outline campaign objectives, key strategies, and execution steps in a clear, step-by-step format. Designed for marketers, strategists, and business teams, this fully editable slide ensures seamless planning and tracking of marketing initiatives. Compatible with PowerPoint, Keynote, and Google Slides.


21 slides
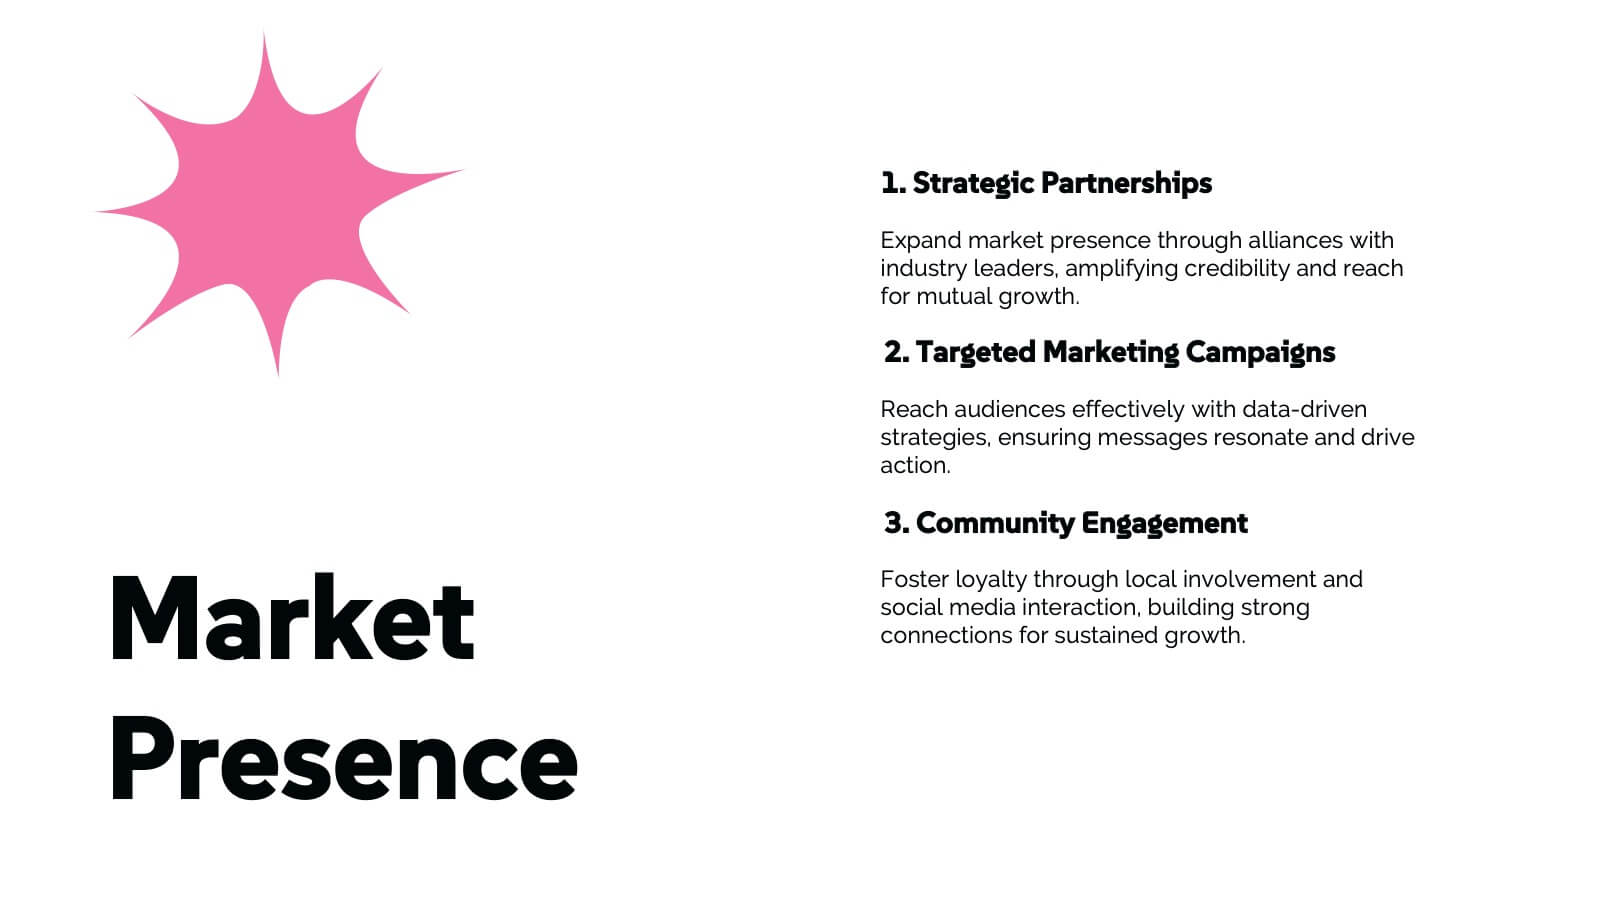
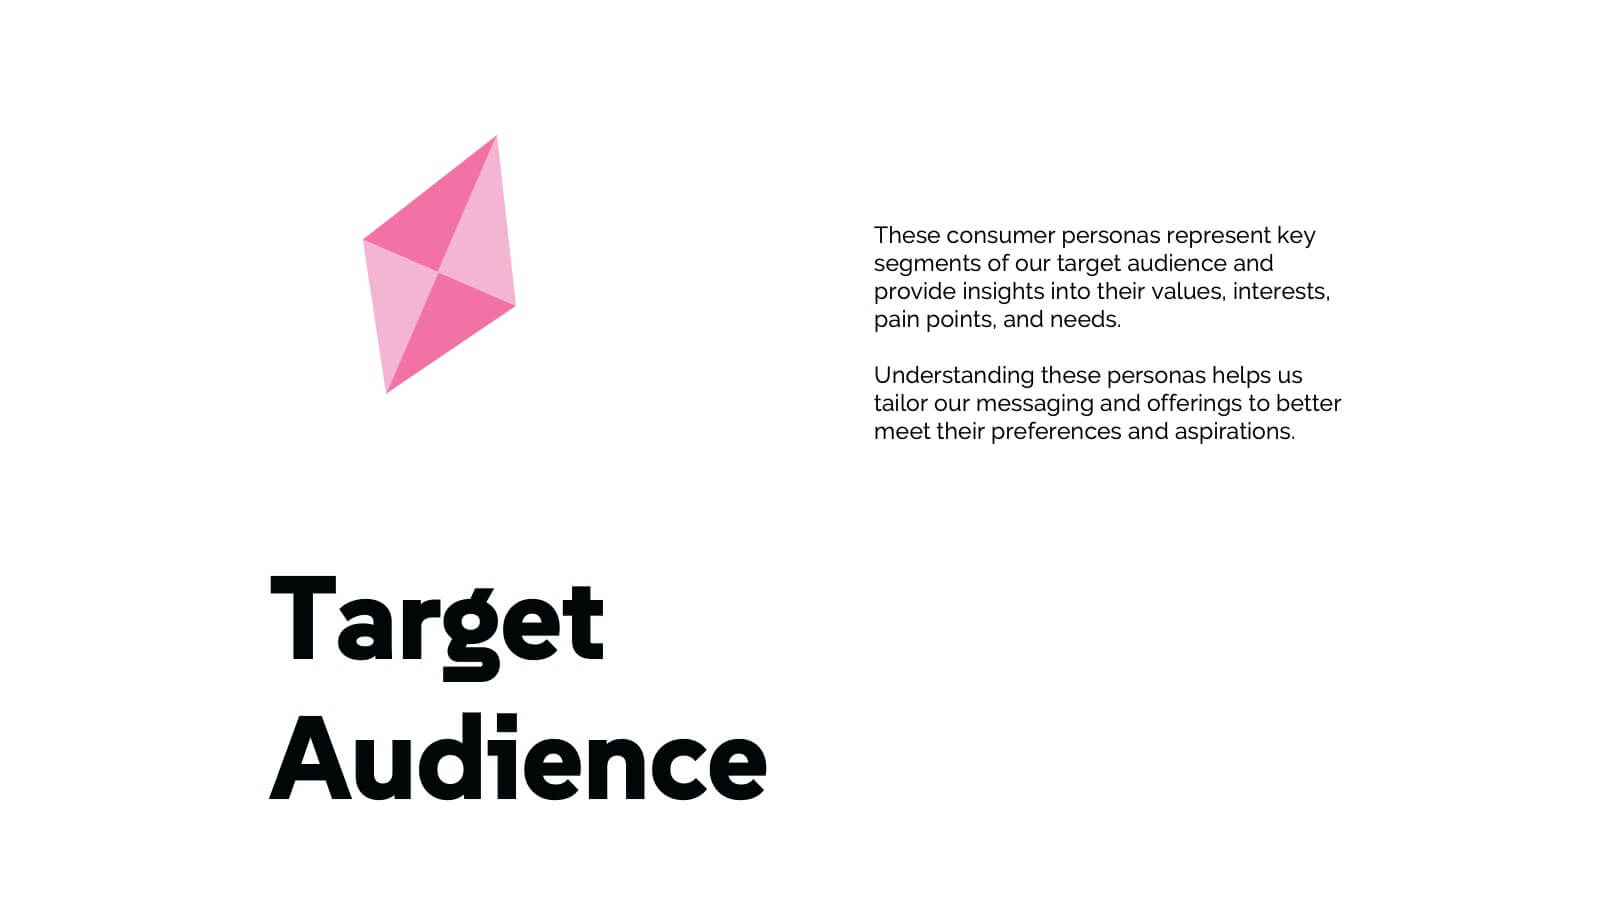
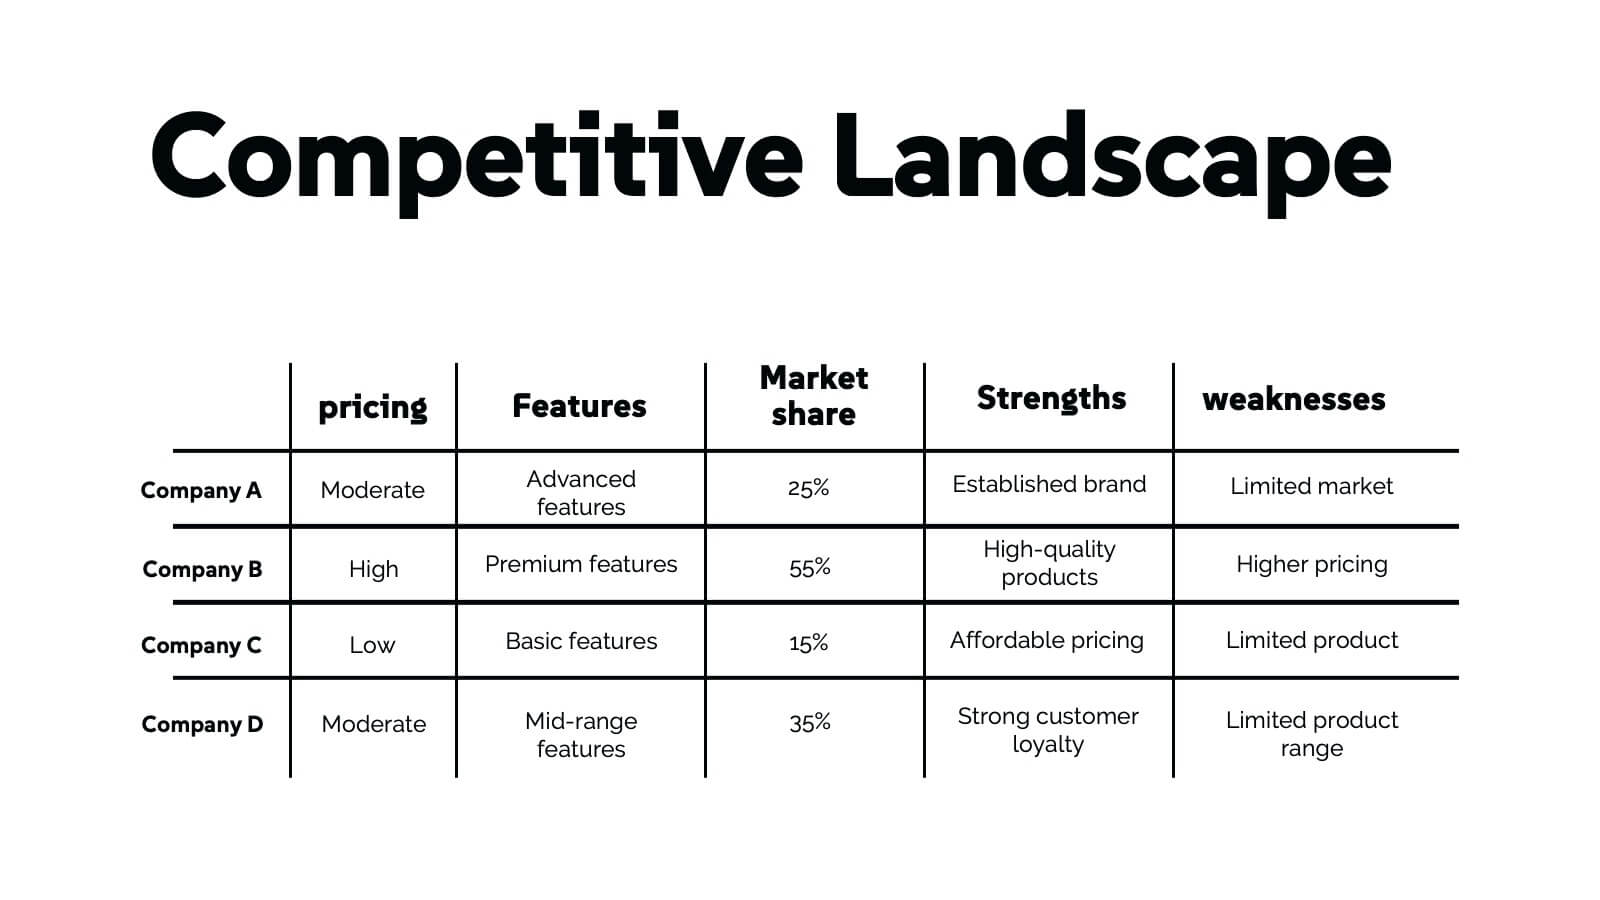
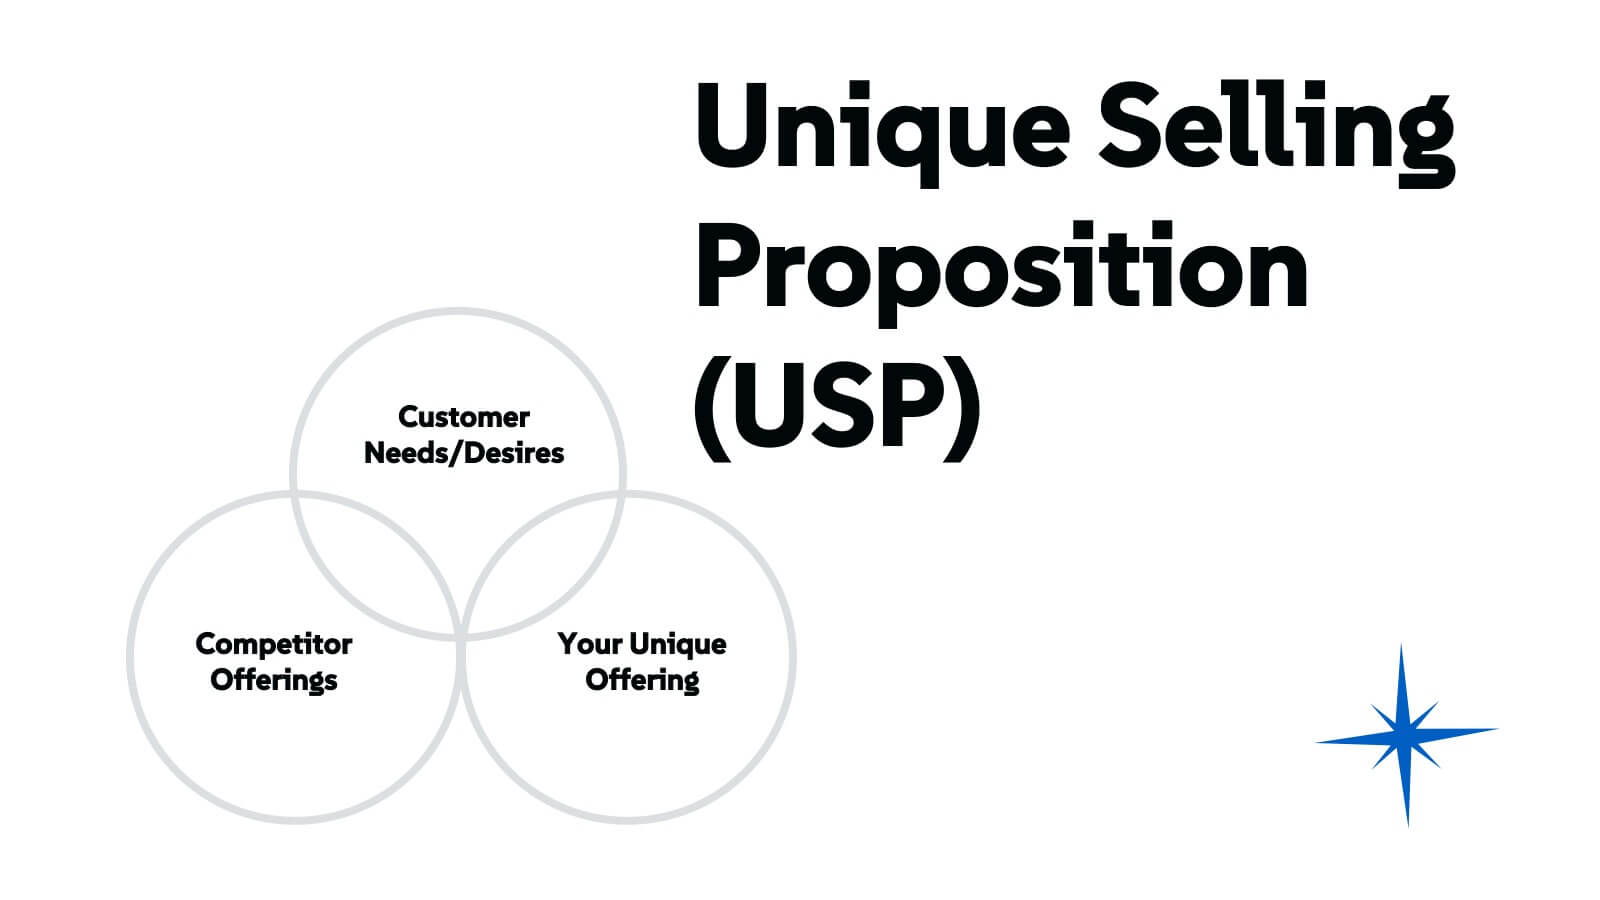
Chimera Marketing Campaign Presentation
Create a visually engaging digital marketing presentation with this modern template! Covering essential topics like company history, market presence, target audience, and competitive landscape, this template helps you showcase your marketing strategies effectively. Fully customizable, it works seamlessly with PowerPoint, Keynote, and Google Slides for professional presentations every time.


5 slides
Company Success Story Timeline Presentation
Highlight your journey with the Company Success Story Timeline Presentation. This modern, mountain-style layout helps you break down your company’s key milestones, phases, or achievements step by step. With five customizable stages and icons, it’s ideal for visual storytelling, growth metrics, or project retrospectives. Fully editable in Canva, PowerPoint, Keynote, and Google Slides.


6 slides
Innovative Treatments in Medical Practice Presentation
Showcase cutting-edge healthcare strategies with this creative medical infographic featuring a pressure gauge illustration. Ideal for presenting treatment timelines, research insights, or innovation pathways. Fully editable in PowerPoint, Keynote, and Google Slides, this design suits health startups, medical researchers, and professionals looking to communicate modern medical approaches with clarity.


5 slides
Gantt Chart Project Schedule Presentation
Bring structure to your project timeline with a clean, easy-to-read layout that maps tasks, durations, and progress at a glance. This presentation helps teams stay aligned, visualize schedules, and track milestones with clarity and precision. Fully compatible with PowerPoint, Keynote, and Google Slides.


6 slides
Training Jobs Infographics
Explore the dynamic field of Training Jobs with our customizable infographic template. This template is fully compatible with popular presentation software like PowerPoint, Keynote, and Google Slides, allowing you to effortlessly tailor it to highlight specific training job opportunities and information. The Training Jobs infographic template offers a versatile platform for presenting job trends, qualifications, and opportunities within the training industry. Whether you're an HR professional, a job seeker, or involved in talent development, this template provides a user-friendly canvas to create engaging presentations and informative materials. Elevate your understanding of Training Jobs with this SEO-optimized infographic template, designed for clarity and ease of use. Customize it to showcase job roles, required skills, and industry insights, helping both job seekers and employers navigate the training job landscape effectively. Start crafting your personalized infographic today to excel in the world of training employment!


4 slides
Break-Even Point Financial Analysis Presentation
Clearly define profitability with this break-even point financial analysis template. It visually maps costs, revenue, and profitability, helping businesses assess when they'll cover expenses and start making a profit. Perfect for financial forecasting and business planning. Fully customizable and compatible with PowerPoint, Keynote, and Google Slides for seamless editing and presentation.


6 slides
Aviation Safety and Efficiency Presentation
Take your audience to new heights with this modern aviation-themed infographic layout. Perfect for illustrating flight performance, safety systems, and operational improvements, it combines clarity with sleek visual flow to enhance understanding. Fully customizable and compatible with PowerPoint, Keynote, and Google Slides for effortless professional presentations.


5 slides
USA Demographic Map Presentation
Visualize regional insights effortlessly with this USA Demographic Map Presentation. Featuring editable color-coded state maps and matching infographic sections, this template is ideal for presenting population data, customer distribution, or market segmentation. Fully compatible with PowerPoint, Keynote, and Google Slides.