


Features
- 6 Unique slides
- Fully editable and easy to edit in Microsoft Powerpoint, Keynote and Google Slides
- 16:9 widescreen layout
- Clean and professional designs
- Export to JPG, PDF or send by email


Do you have any questions?
Recommend


3 slides
Introduction to Cryptocurrency Presentation
Step into the future of finance with this sleek, modern template designed to explain digital currencies in a simple, engaging way. Perfect for educators, startups, and analysts, it transforms complex ideas into clear visuals. Fully compatible with PowerPoint, Keynote, and Google Slides for effortless editing and professional presentations.


6 slides
Porter’s Value Chain Analysis Presentation
Give your strategy story a powerful lift with a clean visual layout that makes every activity in your organization feel connected and purposeful. This presentation explains primary and support processes in a way that helps teams identify strengths, gaps, and opportunities for improvement. Fully compatible with PowerPoint, Keynote, and Google Slides.


7 slides
Digital Marketing Infographic
Digital marketing refers to the use of digital channels, such as the internet, social media, search engines, email, and mobile devices, to promote products, services, and brands. This infographic showcases key concepts and strategies in the field of digital marketing. It is designed to help businesses and marketers effectively communicate and educate their audience about the various aspects of digital marketing. This template can be used to cover a wide range of digital marketing topics, including social media marketing, search engine optimization, content marketing, email marketing, paid advertising, analytics, and more.


4 slides
Virtual Learning Experience Design Presentation
Bring your online classroom ideas to life with this modern and visual-first design! This infographic presentation breaks down the key components of virtual learning experience design—perfect for mapping student touchpoints, engagement strategies, and content flow. Fully editable and easy to use in PowerPoint, Keynote, and Google Slides for fast customization.


21 slides
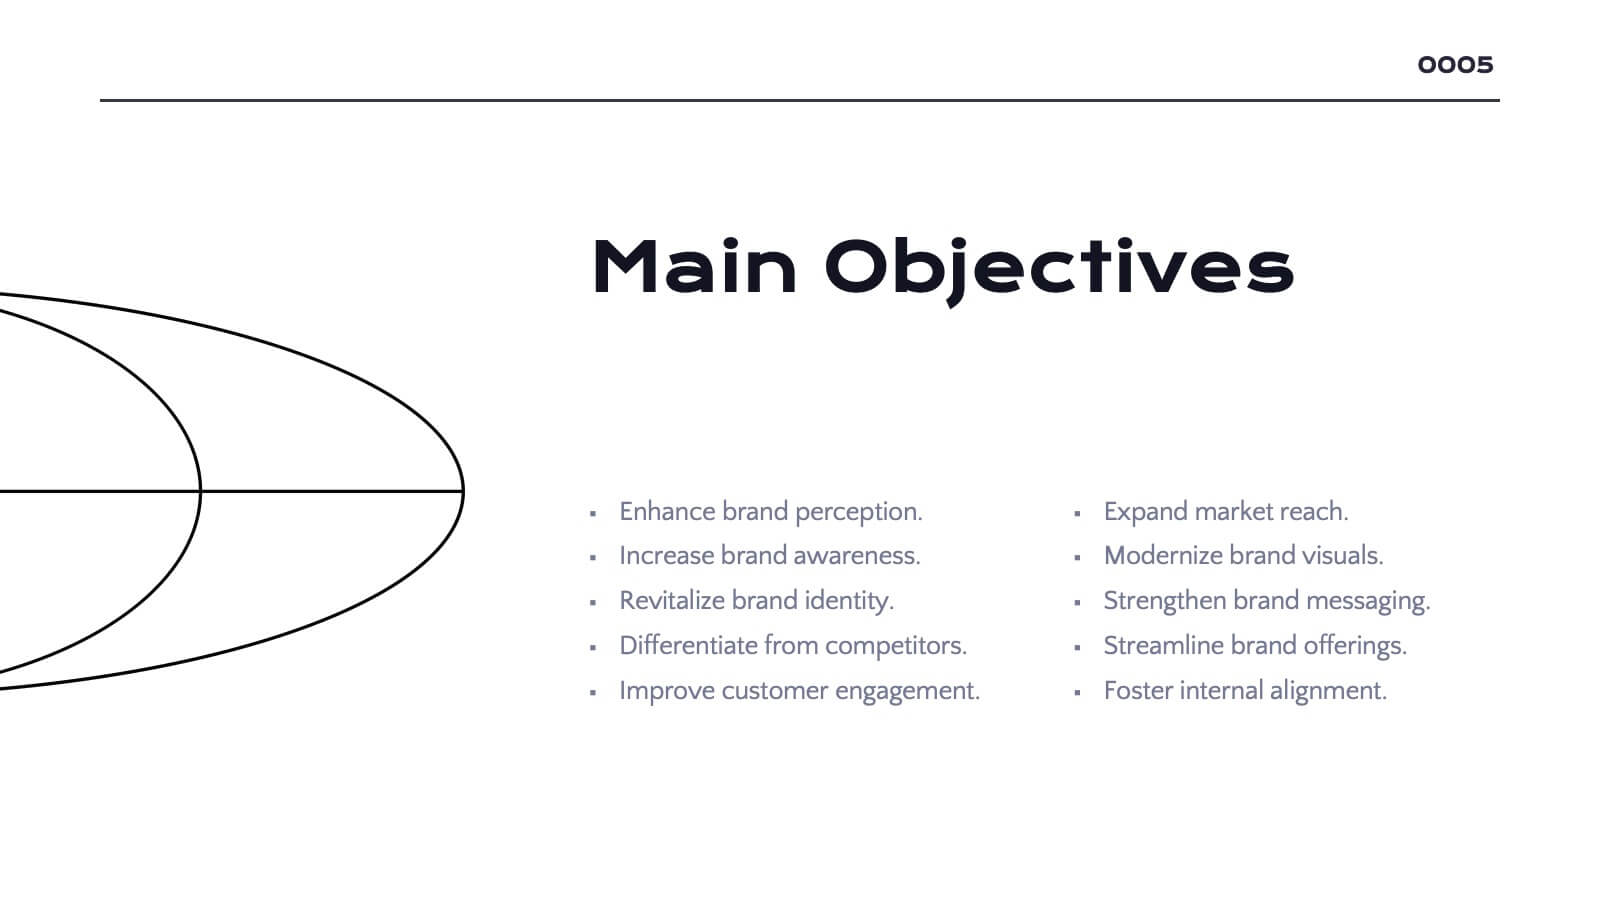
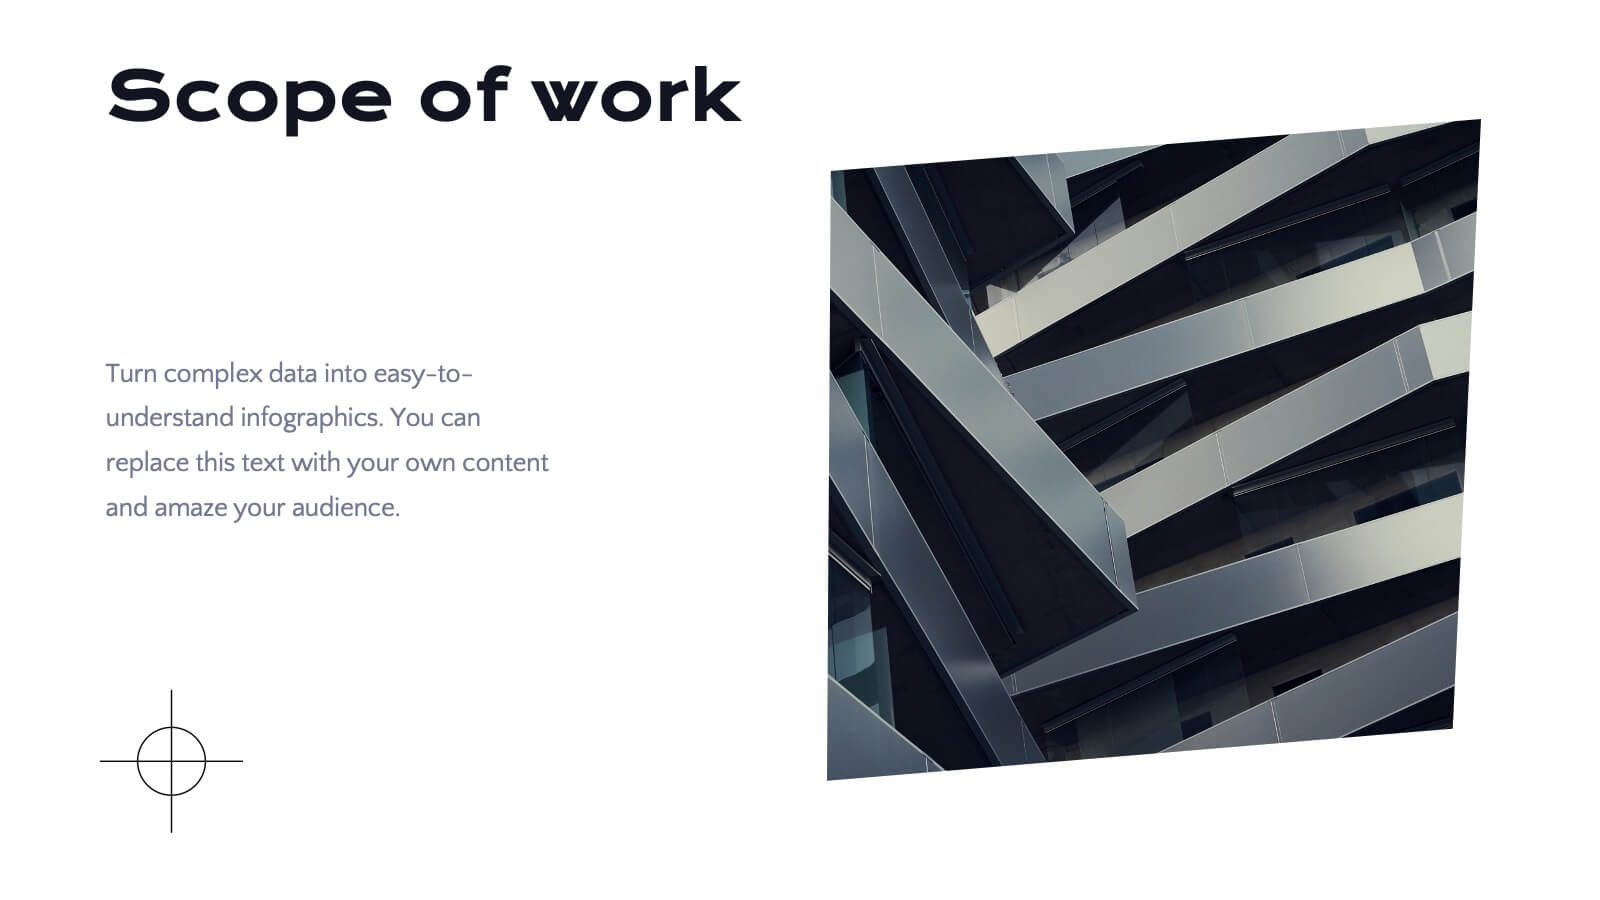
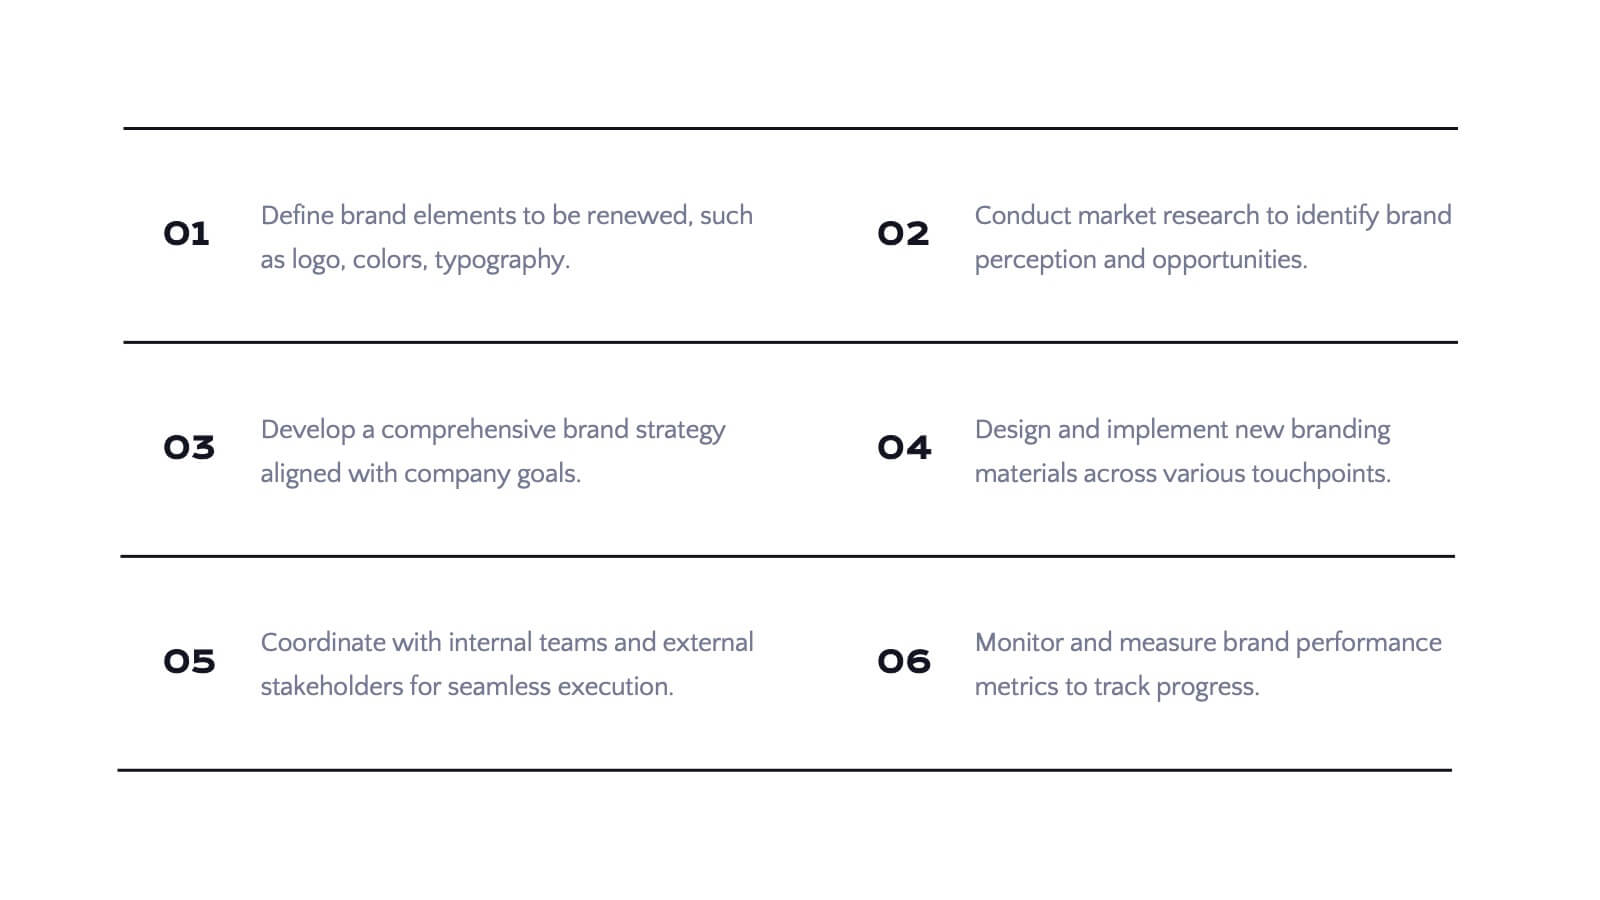
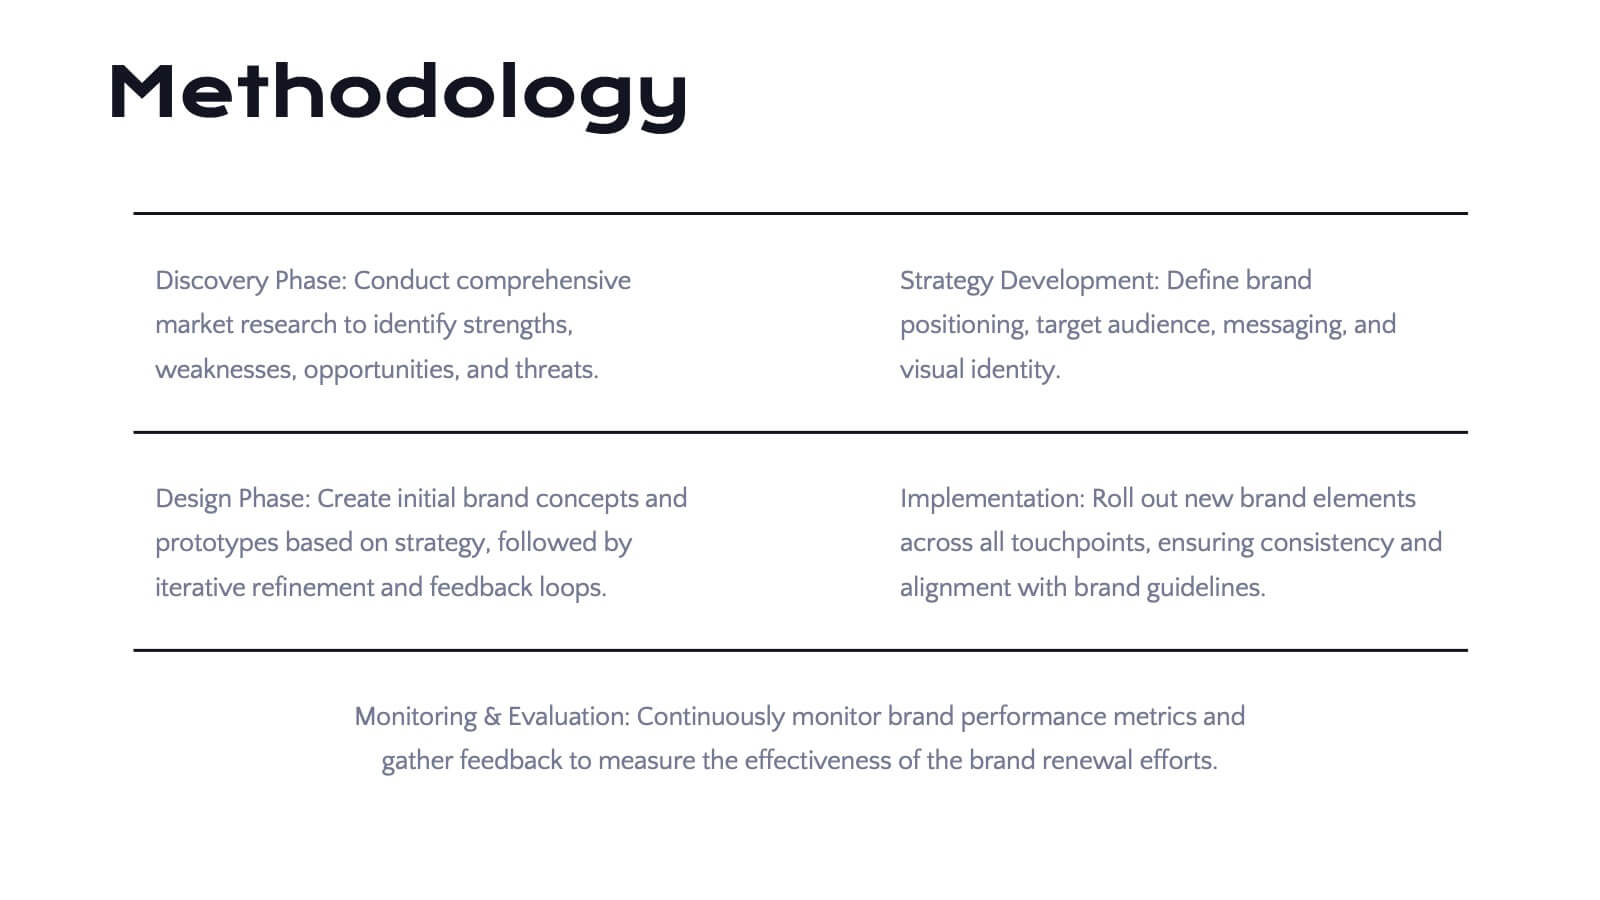
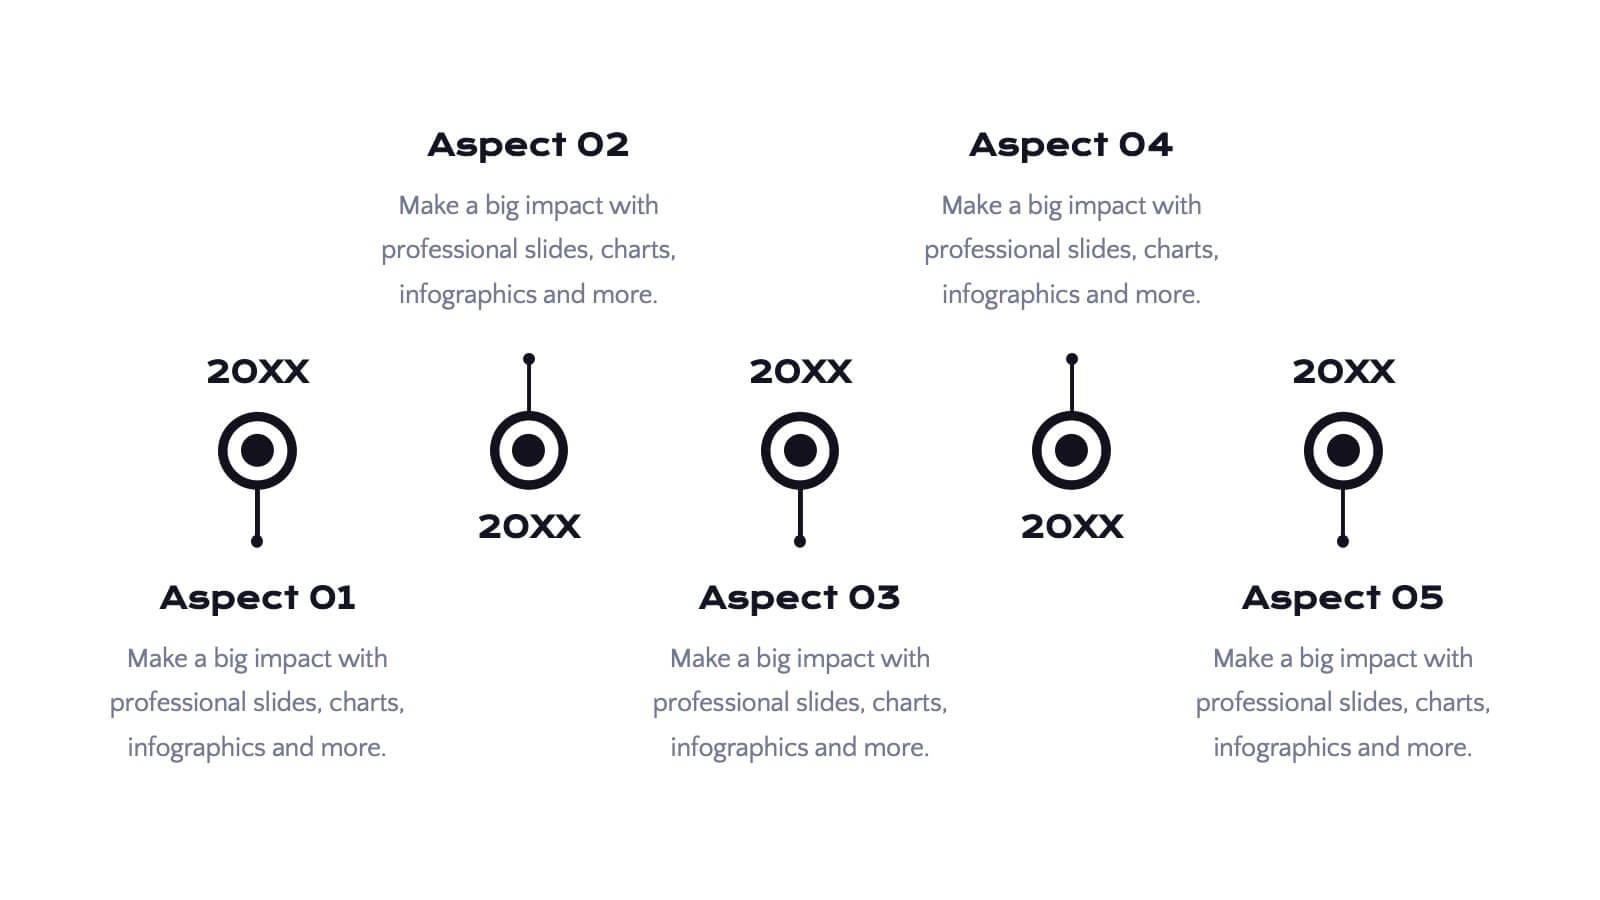
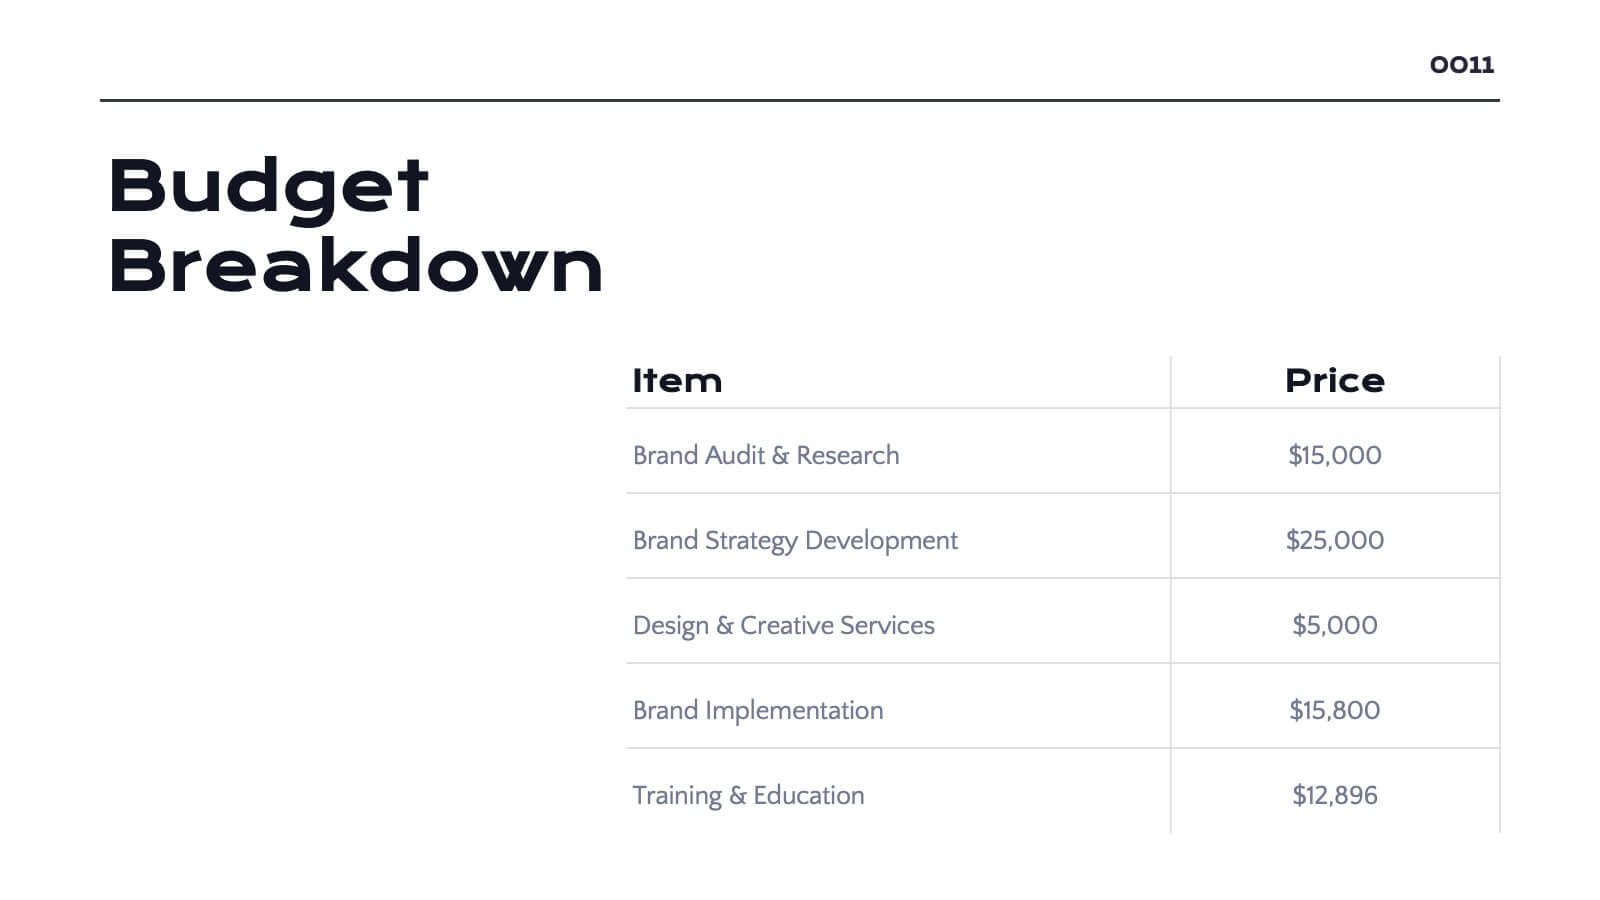
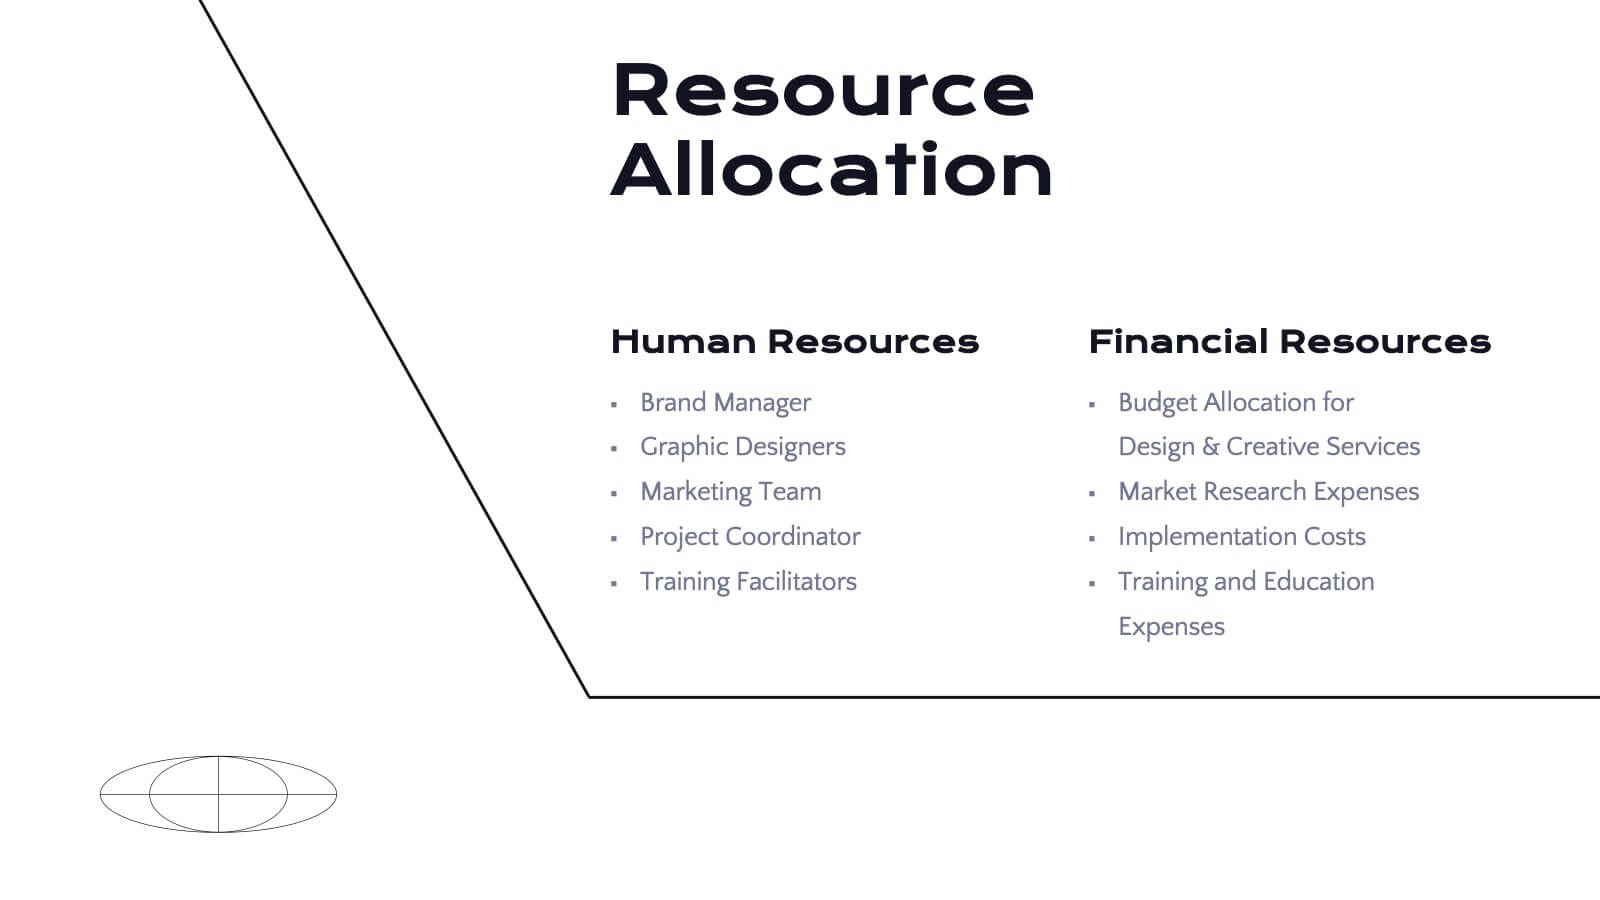
Radiance Detailed Project Execution Plan Presentation
Elevate your project execution presentations with this sleek template, covering everything from objectives to timelines and budget breakdowns. It's perfect for aligning your team and stakeholders. Compatible with PowerPoint, Keynote, and Google Slides, it ensures professionalism and clarity in showcasing your project plans.


5 slides
3-Level Concentric Diagram Presentation
Bring clarity and structure to your ideas with a clean, layered diagram design that simplifies complex concepts. Perfect for showcasing stages, hierarchies, or interconnected systems, it keeps your audience engaged with visual balance and flow. Fully compatible with PowerPoint, Keynote, and Google Slides for effortless customization and presentation flexibility.


5 slides
Website SEO Performance Analytics Presentation
Visualize your website’s performance data clearly and professionally with this structured SEO analytics slide. This template features a tiered layout with a central search bar icon and four vertically-aligned data sections—perfect for breaking down KPIs like traffic sources, bounce rates, keyword rankings, and conversion rates. Ideal for digital marketers, SEO analysts, and reporting presentations. Fully editable in PowerPoint, Keynote, and Google Slides.


4 slides
Workplace Collaboration and Team Scenes Presentation
Bring your teamwork story to life with this vibrant, arrow-based layout that guides the viewer through four clear steps. Perfect for visualizing collaboration strategies, team roles, or task flow, this template balances clean design with helpful icons. Easily customize it in PowerPoint, Keynote, or Google Slides for a polished presentation.


7 slides
Buyer Persona Guide Infographic
Elevate your marketing strategy with our Buyer Persona Guide Infographic Template, designed to distill complex customer data into stunning, easy-to-understand visual profiles. This template is a canvas for creativity, allowing marketers to paint detailed portraits of their ideal customers using a mix of vibrant colors, engaging layouts, and succinct text. Craft each persona with care, detailing demographics, preferences, behaviors, and needs, all laid out in an aesthetically pleasing format that makes data pop off the page. Whether you're presenting to stakeholders, guiding your content strategy, or training your sales team, these visuals serve as your roadmap to deeper customer connections. Fully customizable to reflect your brand's unique voice and style, this template adapts seamlessly to your needs, ensuring that every insight into your audience is not just informative but also visually captivating. It's an essential tool for anyone looking to enhance their understanding of their market and refine their approach to meet customer demands.


6 slides
Detailed Info Table with Metrics
Present complex insights with clarity using the Detailed Info Table with Metrics Presentation. Designed to showcase up to five key items or categories, this layout includes structured rows and multiple columns—perfect for comparing metrics, milestones, or KPIs across several dimensions. With bold numbering and clean typography, this editable slide works in PowerPoint, Keynote, and Google Slides.


5 slides
Mind and Brain Creativity Concept Diagram Presentation
Ignite fresh thinking with the Mind and Brain Creativity Concept Diagram Presentation—a smart and visually engaging template that maps out five core concepts around a central brain icon. Each idea is linked with intuitive visuals and labeled A through E, ideal for creative strategy, innovation pitches, or mental model breakdowns. Fully customizable in PowerPoint, Keynote, and Google Slides.


6 slides
Project Proposal Goals Infographic
Maximize the impact of your project proposals with this professional collection of templates, designed to outline your project goals and strategies with precision. Each template facilitates clear communication of project objectives, timelines, and the desired outcomes, making them essential for project managers, consultants, and business analysts. These slides are crafted with a clean, corporate design that uses a harmonious blend of blue tones, engaging charts, and concise content layouts. This ensures that key points are easily digestible and effectively conveyed to stakeholders. The structured format of these templates is ideal for detailing the scope of work, expected milestones, and resource allocation, supporting a comprehensive overview of your project plan. Customize these templates to align with your organization's branding and project specifics, enhancing your presentation and strengthening the proposal's persuasive power. Whether for internal briefings or external pitches, these slides are tailored to help you present a coherent and compelling case for your projects.


21 slides
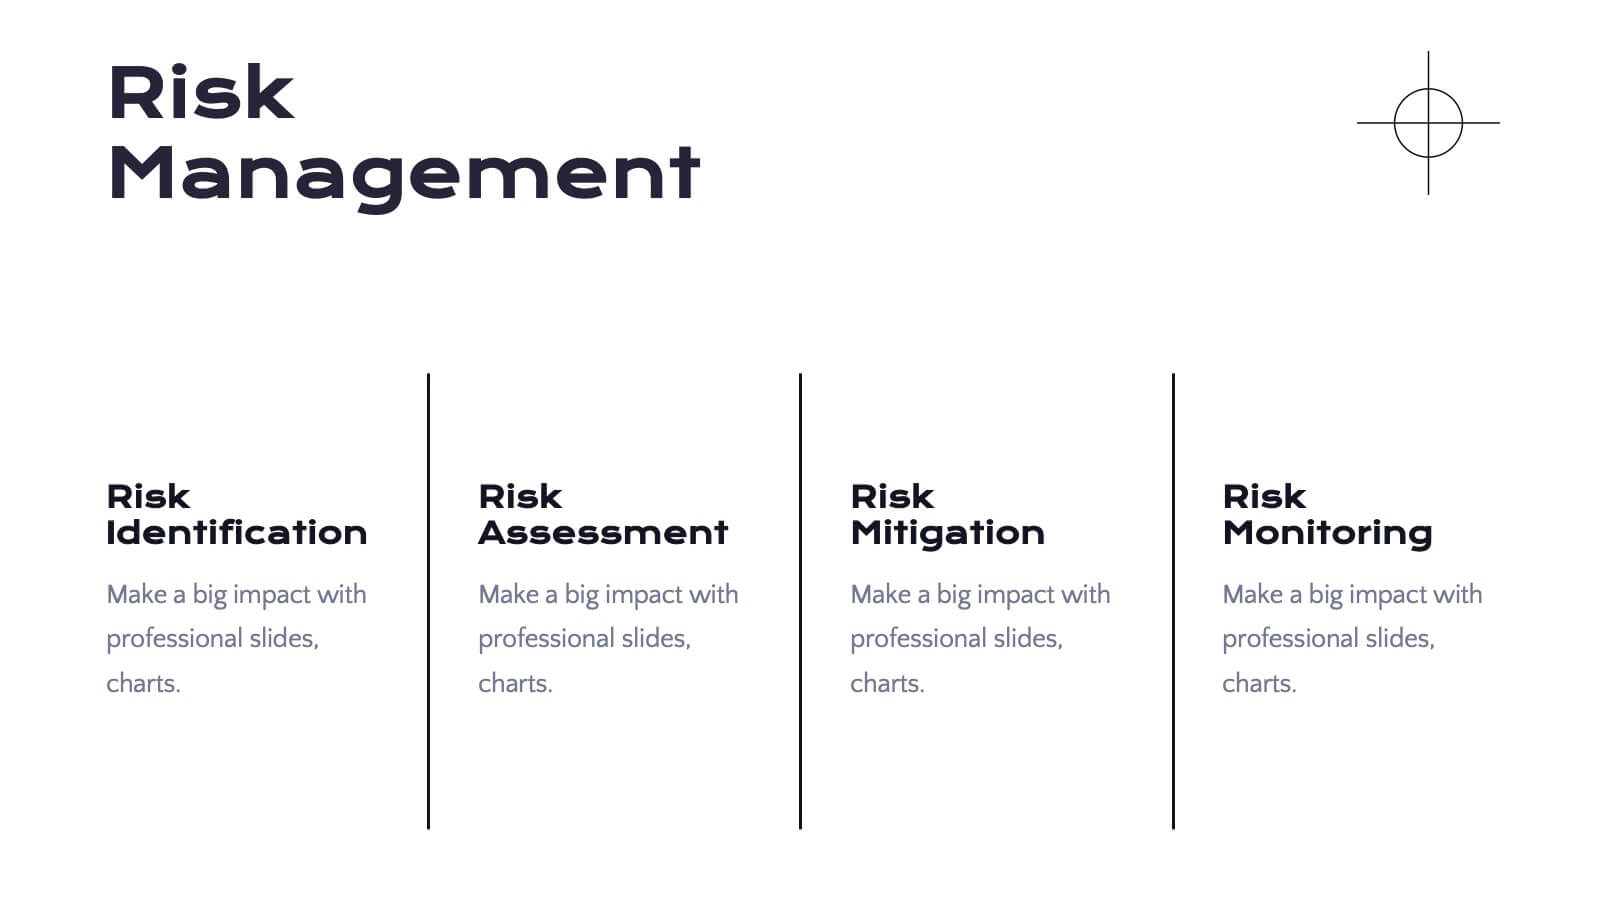
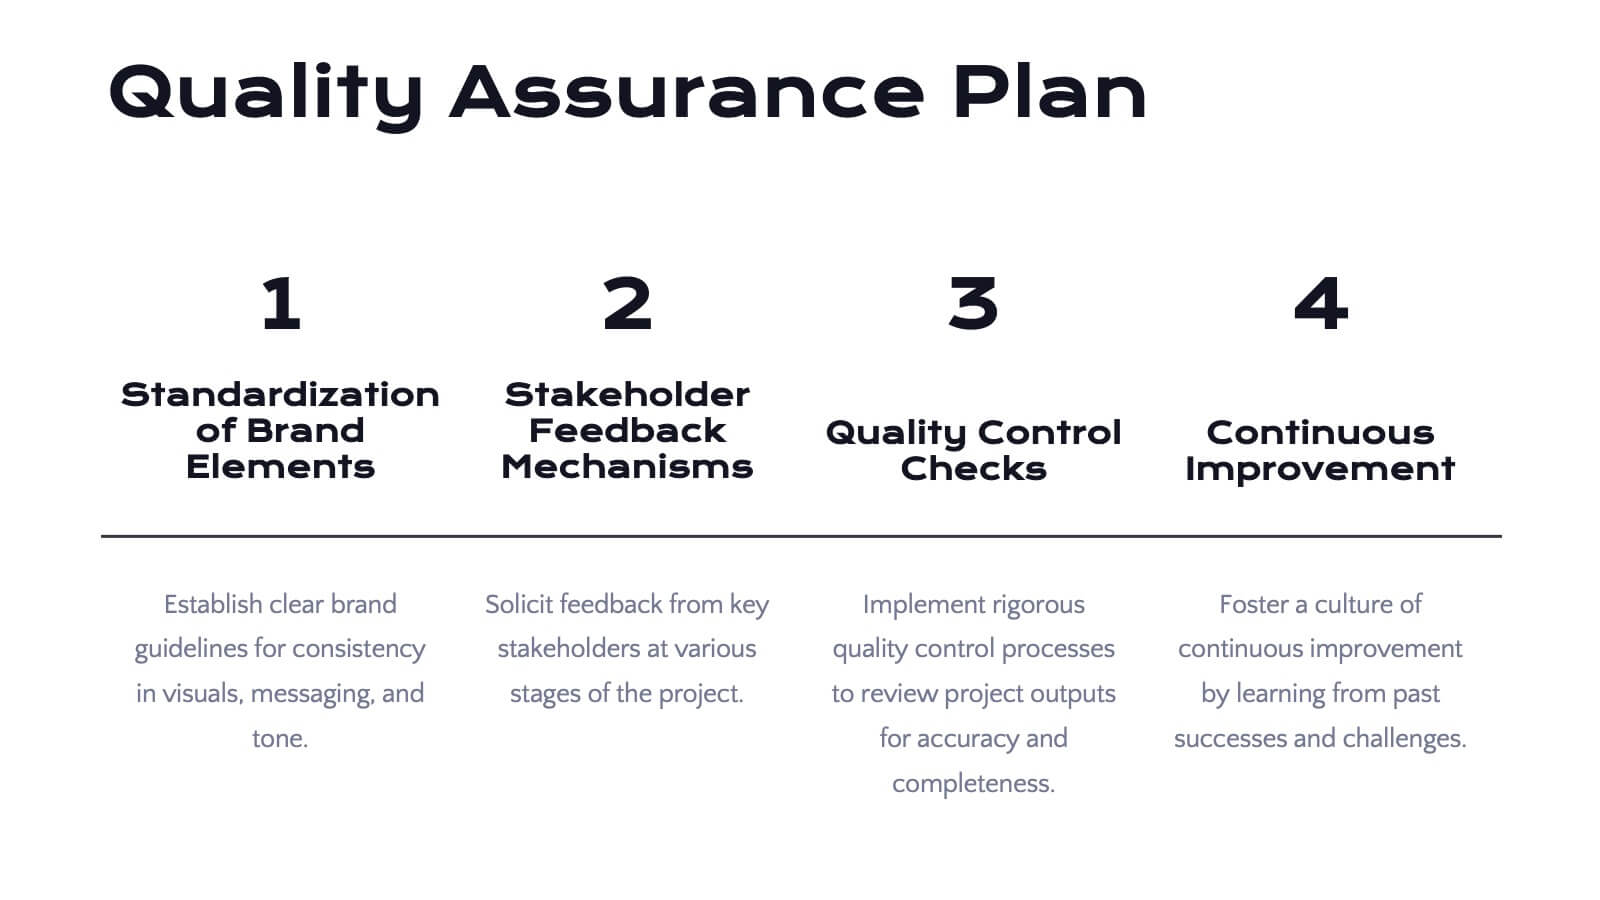
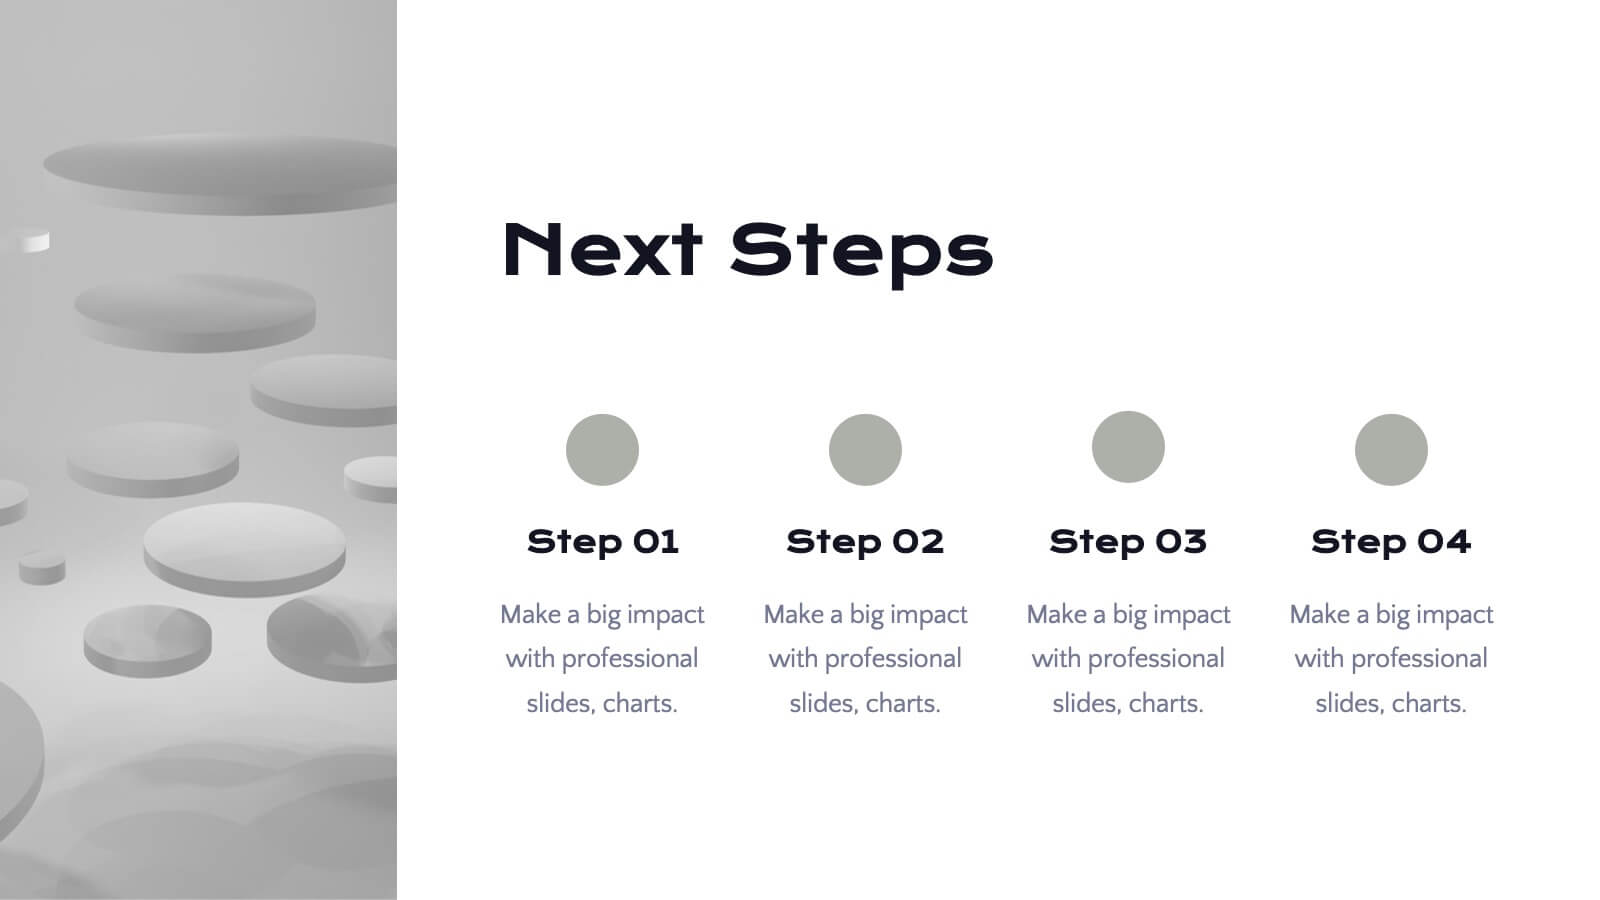
Illume Detailed Project Execution Plan Presentation
Get ready to wow your audience with this dynamic Project Execution Plan template! Bursting with sleek design, it transforms your project timelines, deliverables, and stakeholder analysis into a stunning visual journey. Keep everyone engaged while you showcase your strategy with flair and finesse. Perfect for PowerPoint, Keynote, and Google Slides!


4 slides
Progress Indicators with Harvey Visuals Presentation
Track multiple projects at a glance with the Progress Indicators with Harvey Visuals Presentation. This slide design uses Harvey balls and icons to clearly communicate status across key metrics such as schedule, budget, risk, and issues. Ideal for PMOs, stakeholder updates, or cross-functional reviews. Fully editable and compatible with PowerPoint, Keynote, and Google Slides.


6 slides
SEO Ads and Social Media Planning Presentation
Boost your online presence with the SEO, Ads, and Social Media Planning Presentation. This layout features engaging iconography and a central post mockup to highlight content strategy, paid advertising, engagement metrics, and platform-specific insights. Ideal for marketing teams and campaign proposals. Fully editable in PowerPoint, Keynote, and Google Slides.


20 slides
Fenrir Investor Pitch Presentation
Deliver a compelling and persuasive pitch with this sleek and professional investor pitch deck! It covers essential sections like problem and solution, market opportunity, business model, financials, and growth strategy to ensure your vision is clearly communicated. Ideal for startup fundraising or business presentations, this template is fully compatible with PowerPoint, Keynote, and Google Slides.


6 slides
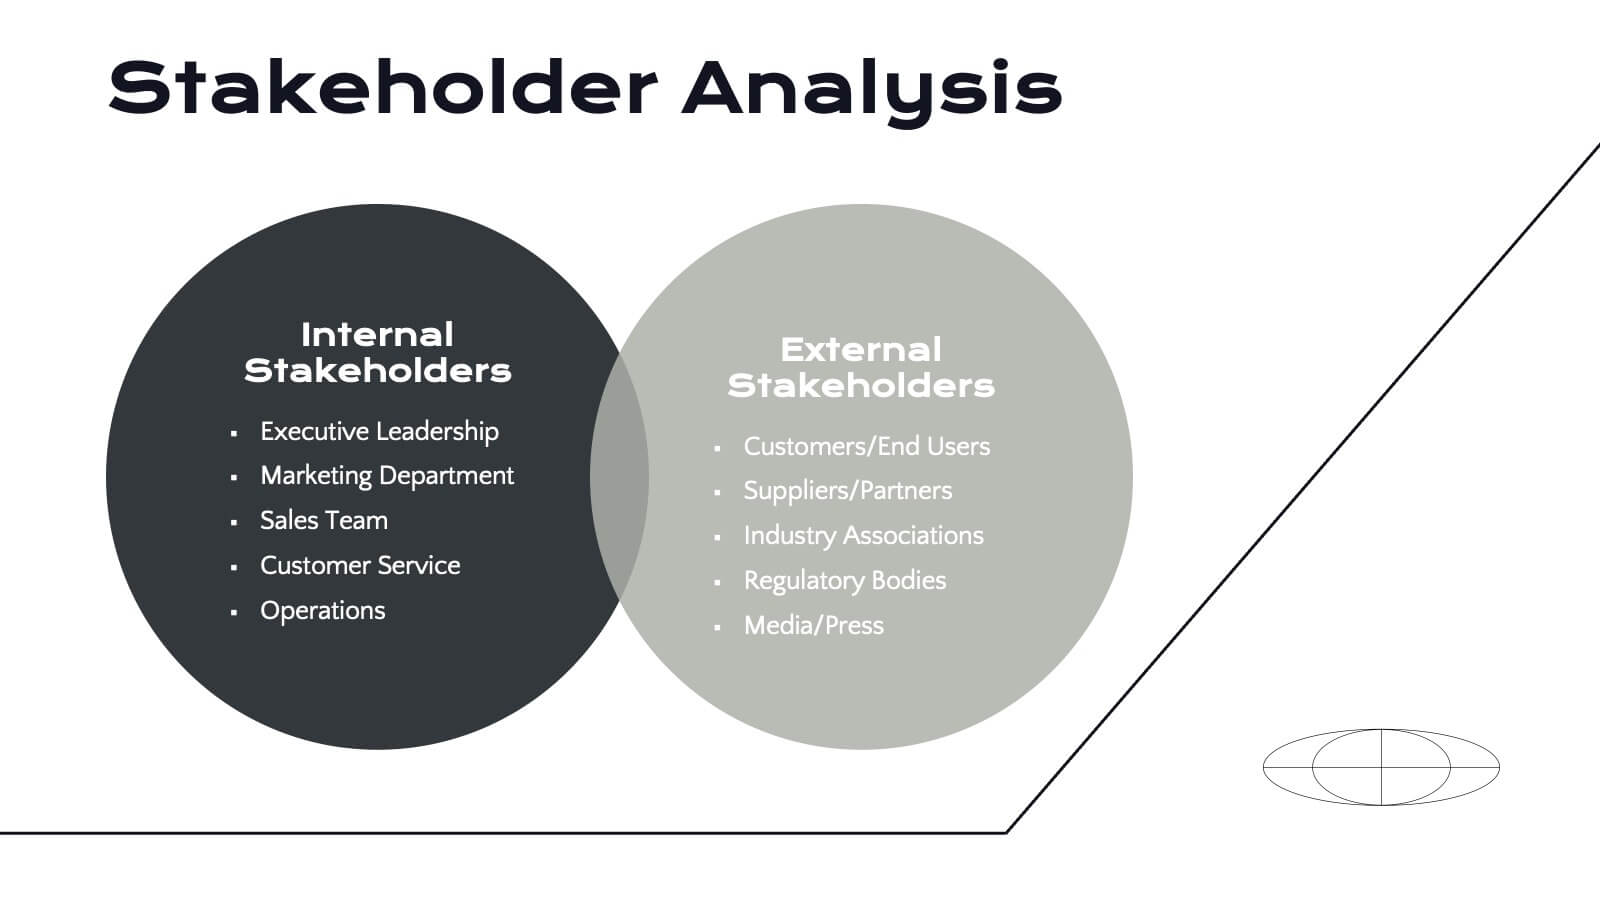
Three-Part Comparative Venn Layout Presentation
Showcase relationships, overlaps, and distinctions across three core elements with this elegant petal-style Venn layout. Perfect for comparing strategies, audiences, or product features. Each section includes customizable labels and icons. Fully editable in PowerPoint, Keynote, and Google Slides—ideal for business analysis, educational presentations, and marketing plans.