


Features
- 6 Unique slides
- Fully editable and easy to edit in Microsoft Powerpoint, Keynote and Google Slides
- 16:9 widescreen layout
- Clean and professional designs
- Export to JPG, PDF or send by email


Do you have any questions?
Recommend


7 slides
Short Term Goals Infographic Presentation
Short-term Goals are important because they provide a clear focus and direction for individuals or organizations to achieve their long-term objectives. Get started on your goals in no time with this template. It is professional, clean and has everything you need to create a presentation. It's a good choice for career advancement and pitches. This template is designed to help your audience visualize the impact of your goals. Use this template as a base to brainstorm your vision and objectives with your team. The goal-oriented design will bring awareness and create excitement about your goals.


5 slides
Aviation Industry Market Analysis
Break down key metrics in the aviation sector with this sleek, aircraft-themed layout. Ideal for highlighting five data points or insights, each icon aligns with a section of the airplane to reinforce structure and clarity. Perfect for presentations on industry trends, airline strategies, or market performance. Fully editable in PowerPoint, Keynote, and Google Slides.


4 slides
Corporate Finance and Expense Review Presentation
Visualize your company's financial structure with this Corporate Finance and Expense Review Presentation. Featuring a wallet-themed layout with three editable icons and text blocks, this slide helps you clearly present income sources, expenses, and budget allocations. Fully customizable in Canva, PowerPoint, and Google Slides.


8 slides
Startups Pitch Deck Presentation
Bring your idea to life with a bold, energetic layout designed to showcase vision, traction, and future potential. This presentation helps you communicate your business model, strategy, and key insights with clarity and confidence. Clean visuals and structured sections keep your message strong and compelling. Fully compatible with PowerPoint, Keynote, and Google Slides.


10 slides
Concentric Circles Business Model Presentation
Visualize Your Business Strategy with Clarity using this Concentric Circles Business Model Presentation template. This design helps you illustrate core business concepts, hierarchical structures, and strategic layers in a simple yet engaging format. Ideal for business planning, process optimization, and strategic growth presentations, this template makes complex relationships clear and easy to understand. Fully editable and available for PowerPoint, Keynote, and Google Slides.


21 slides
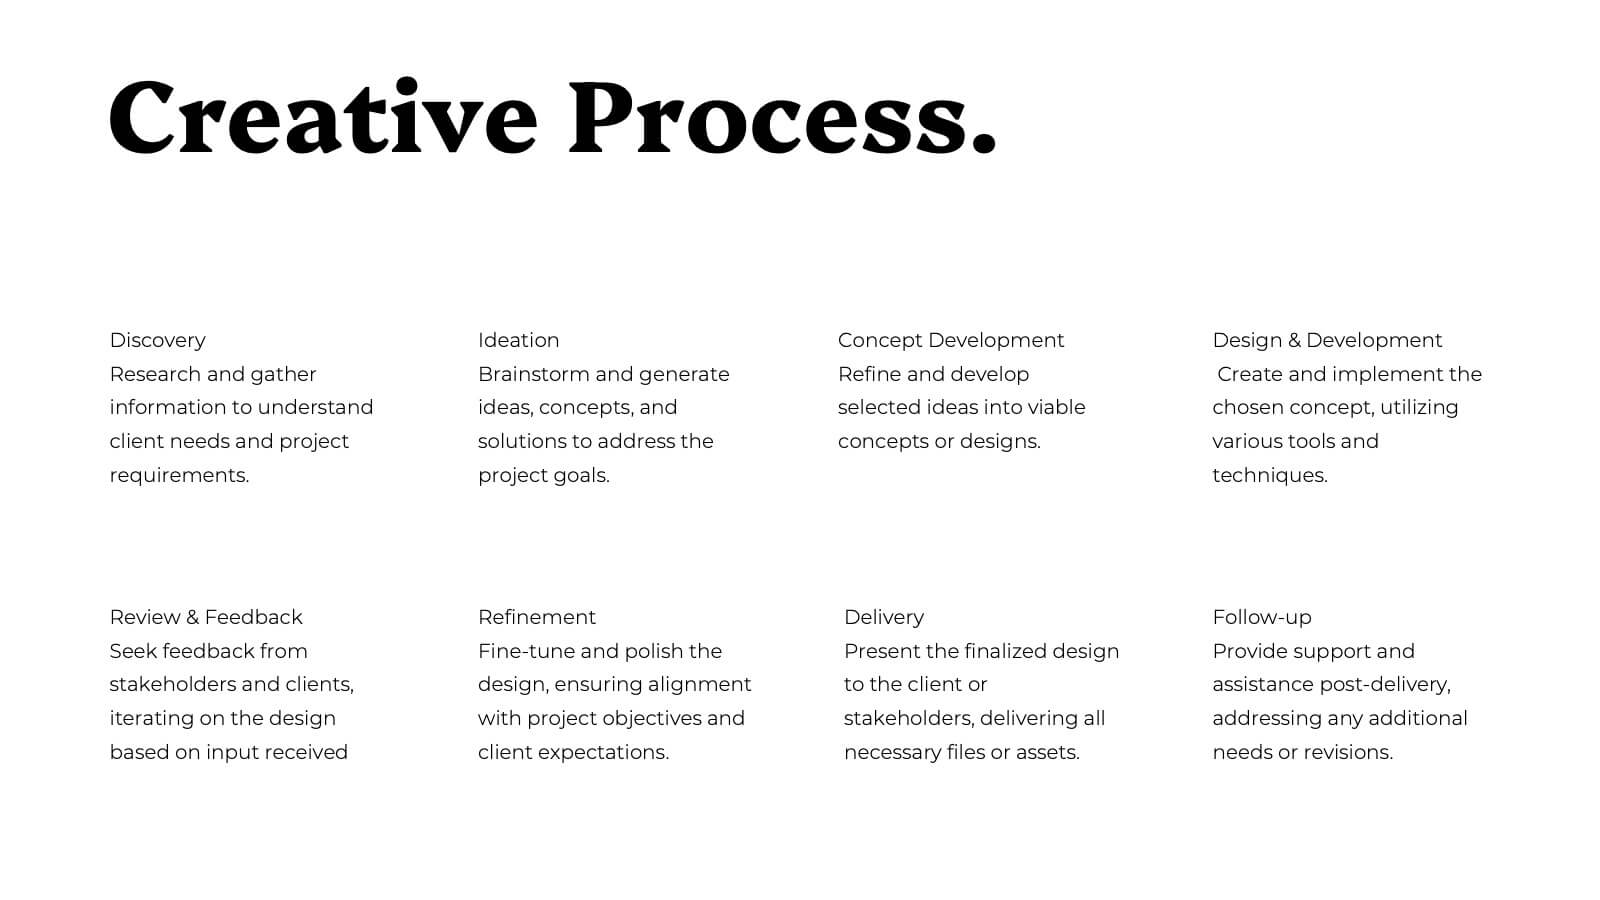
Arcadian Photography Portfolio Template Presentation
Showcase your best work with this sleek and stylish photography portfolio presentation template! It’s perfect for presenting your featured projects, creative process, and client testimonials in a visually stunning way. This template is fully customizable and offers a professional touch to your portfolio, making it ideal for both personal and client presentations. Compatible with PowerPoint, Keynote, and Google Slides.


12 slides
Investment Strategy Presentation
The "Investment Strategy Presentation" template is designed for effectively mapping out and displaying various investment strategies. It uses a multi-colored light bulb graphic, which symbolizes ideas and innovation in investment planning, making it visually appealing and easy to understand. Each segment of the light bulb is labeled with letters A through F, representing different aspects or phases of an investment strategy that can be tailored to specific objectives or points of discussion. This format helps in presenting complex financial data or strategies in a straightforward manner that can be easily grasped by audiences, making it an ideal choice for financial analysts, investors, or corporate strategy meetings.


5 slides
Performance Metrics and KPI Review Presentation
Visualize performance at a glance with the Performance Metrics and KPI Review presentation template. Featuring sleek gauge charts in various color schemes, this layout makes it easy to display progress, thresholds, and KPIs across categories. Customize each dial and label to reflect your own business metrics. Compatible with PowerPoint, Keynote, and Google Slides.


5 slides
Food Industry Trends Presentation
Stay ahead of the curve with this visual presentation designed to spotlight key developments in the food industry. Featuring a creative pie chart integrated with food icons and utensils, this layout is perfect for data storytelling, market insights, or trend analysis. Fully editable in PowerPoint, Keynote, and Google Slides.


8 slides
Directional Diagram with Progress Arrows Presentation
Showcase milestones, track development, or visualize progress with the Directional Diagram with Progress Arrows Presentation. This modern layout features arrow-based steps, making it ideal for roadmaps, process stages, or timeline breakdowns. Customize labels, icons, and colors to suit your message. Fully editable in PowerPoint, Google Slides, and Canva.


5 slides
4 Steps Travel Itinerary Slide Presentation
Plan every adventure with a slide that makes travel feel effortless and exciting. This presentation helps you map out destinations, activities, and budgets in four clear, intuitive steps—perfect for trip planning or presenting itinerary options. Designed for smooth customization and fully compatible with PowerPoint, Keynote, and Google Slides.


8 slides
Blue Ocean Strategy Business Model Presentation
Chart unexplored market territories with our Blue Ocean Strategy Business Model template! This dynamic presentation tool, designed to simplify complex business strategies, illustrates the pivotal elements of cost reduction and value innovation to unlock new buyer value. Compatible with PowerPoint, Keynote, and Google Slides, it's ideal for strategists aiming to create uncontested market spaces and make competition irrelevant. Perfect for workshops, business meetings, or strategy sessions.


8 slides
Winning Strategies for Professional Success Presentation
Showcase your top performers, strategic milestones, or ranked insights with this podium-style template. Featuring vibrant visuals and structured layout, it’s ideal for performance reviews, leadership presentations, and competitive analysis. Fully editable in PowerPoint, Keynote, and Google Slides—perfect for professional success stories, rankings, and progress highlights.


7 slides
Success Iceberg Infographic
Iceberg Infographic are visual guides to understanding the world of business. Ideal for anyone who wants to understand the basics of business, from what it is and how it works to why it matters. This template is easy to read, and can be used for everything from data visualization to teaching people how to use a new product. Give your audience a look at the most important parts of your business. The template is easy to use, and allows you to highlight your data. Fully customizable and compatible with Powerpoint, Keynote, and Google Slides. There are multiple color themes, fonts, and shapes to choose from, and endless combinations to make it truly yours.


8 slides
Product Showcase on Devices Presentation
Present your features in a sleek, mobile-first layout with the Product Showcase on Devices Presentation. This vertical slide design mimics a smartphone screen, making it ideal for displaying app features, service tiers, or digital tool highlights. Each section is clearly segmented, perfect for comparisons or step-by-step product walkthroughs. Fully editable in PowerPoint, Keynote, Canva, and Google Slides.


4 slides
Social Media Analytics Dashboard Presentation
Easily monitor and report on your content performance with the Social Media Analytics Dashboard Presentation. This sleek, modular layout combines key metrics like items, uploads, comments, and feeds with a vertical bar chart to visualize insights across platforms. Ideal for campaign reviews, stakeholder updates, or team reporting. Fully customizable in PowerPoint, Keynote, and Google Slides.


6 slides
Strategic Planning with PESTEL Presentation
Dive into comprehensive environmental scanning with our "Strategic Planning with PESTEL" presentation template. This layout meticulously breaks down Political, Economic, Social, Technological, Environmental, and Legal factors, enabling thorough market analysis and strategy formulation. Perfect for strategists and analysts, the template supports PowerPoint, Keynote, and Google Slides, facilitating a dynamic and engaging planning session.