


Features
- 10 Unique slides
- Fully editable and easy to edit in Microsoft Powerpoint, Keynote and Google Slides
- 16:9 widescreen layout
- Clean and professional designs
- Export to JPG, PDF or send by email


Do you have any questions?
Recommend


7 slides
Milestones Infographic Presentation Template
Our milestones infographic template includes a professional background and imagery to create a high-quality presentation that’s sure to grab your audience’s attention. This template is full of visual and engaging elements that will draw your audience in. It's a great starting point to make your own presentation, or to use as a template for future presentations. All slides are fully editable in PowerPoint so you can add and change text and images as desired, It's very easy to edit and customize the shapes and colors. Use this high-resolution template to present your topic in a professional way!


6 slides
Learning Models and Instructional Design Presentation
Present educational strategies with clarity using the Learning Models and Instructional Design Presentation. This wavy, multi-step visual helps illustrate instructional stages, e-learning workflows, or training models with ease. Ideal for educators, coaches, and corporate trainers. Fully editable in PowerPoint, Keynote, Canva, and Google Slides.


8 slides
Team Statistics and Rankings Presentation
Showcase match performance, rankings, and team metrics with this Team Statistics and Rankings Presentation. Visualize key game stats using editable diagrams, heatmaps, and comparison scores. Perfect for sports analysts, coaches, or recap slides. Compatible with PowerPoint, Keynote, and Google Slides—fully customizable for your team’s specific data and branding needs.


4 slides
Machine Learning Overviews Presentation
Bring your audience into the world of intelligent automation with a bold, visual layout that makes complex concepts feel simple and engaging. This presentation breaks down key processes, workflows, and insights using clear graphics that support your message. Fully customizable and compatible with PowerPoint, Keynote, and Google Slides.


26 slides
Olympus Brand Guidelines Proposal Presentation
The Olympus Brand Identity Presentation is a sleek and modern template designed to help you showcase your brand's unique identity and strategy. This template kicks off with a clean and engaging slide that sets the stage for the entire presentation. It guides you through various aspects of brand identity, including brand components, target audience, and unique selling proposition (USP). The template also dives into brand positioning, strategy, and guidelines, ensuring that your brand's message is consistent and compelling. Additionally, it covers brand experience, recognition, and recall, offering a comprehensive view of your brand's impact. With dedicated sections for performance metrics, brand success stories, and future development, this template provides a complete toolkit for effectively communicating your brand's strengths and vision. Fully compatible with PowerPoint, Keynote, and Google Slides, the Olympus template is perfect for any brand-focused presentation.


7 slides
Dashboard Infographic Presentation Template
A Dashboard Infographic is a visual representation of important data or information that is organized in a way that is easy to understand. This template is perfect for getting your important information across in a way that's easy to comprehend. This template is designed to present your data in a concise and clear way and it can be used to track and monitor different metrics. This dashboard template has the ability to tell a story with a set of graphs and charts that can be customized in several different ways. You can use the graphs and charts and customize them according to your needs.


21 slides
Luster Product Roadmap Presentation
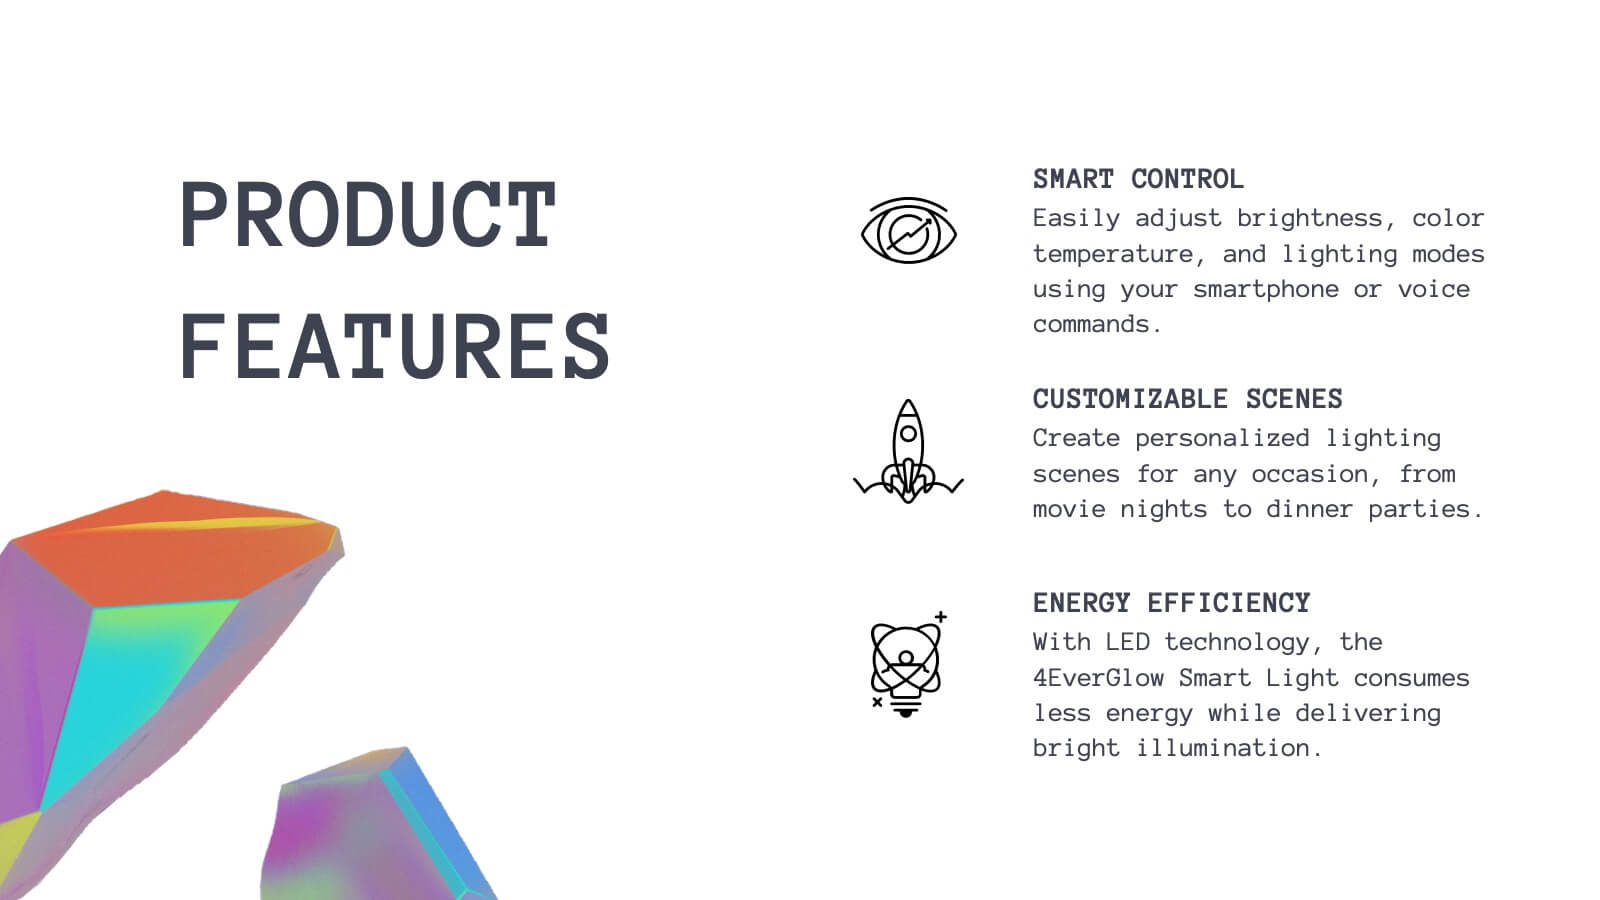
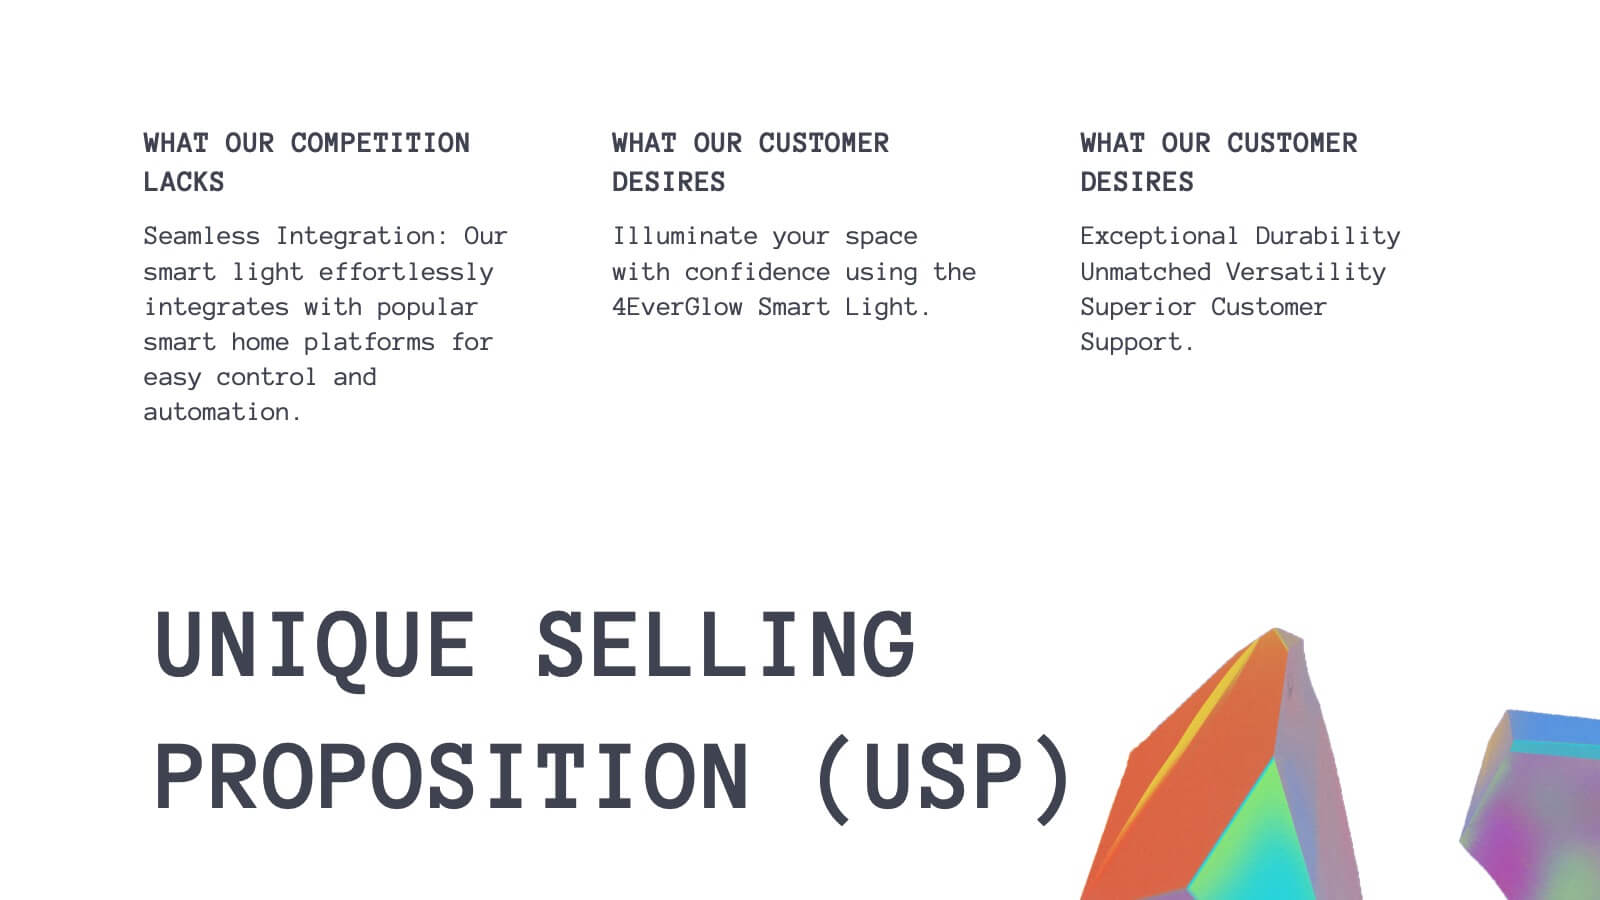
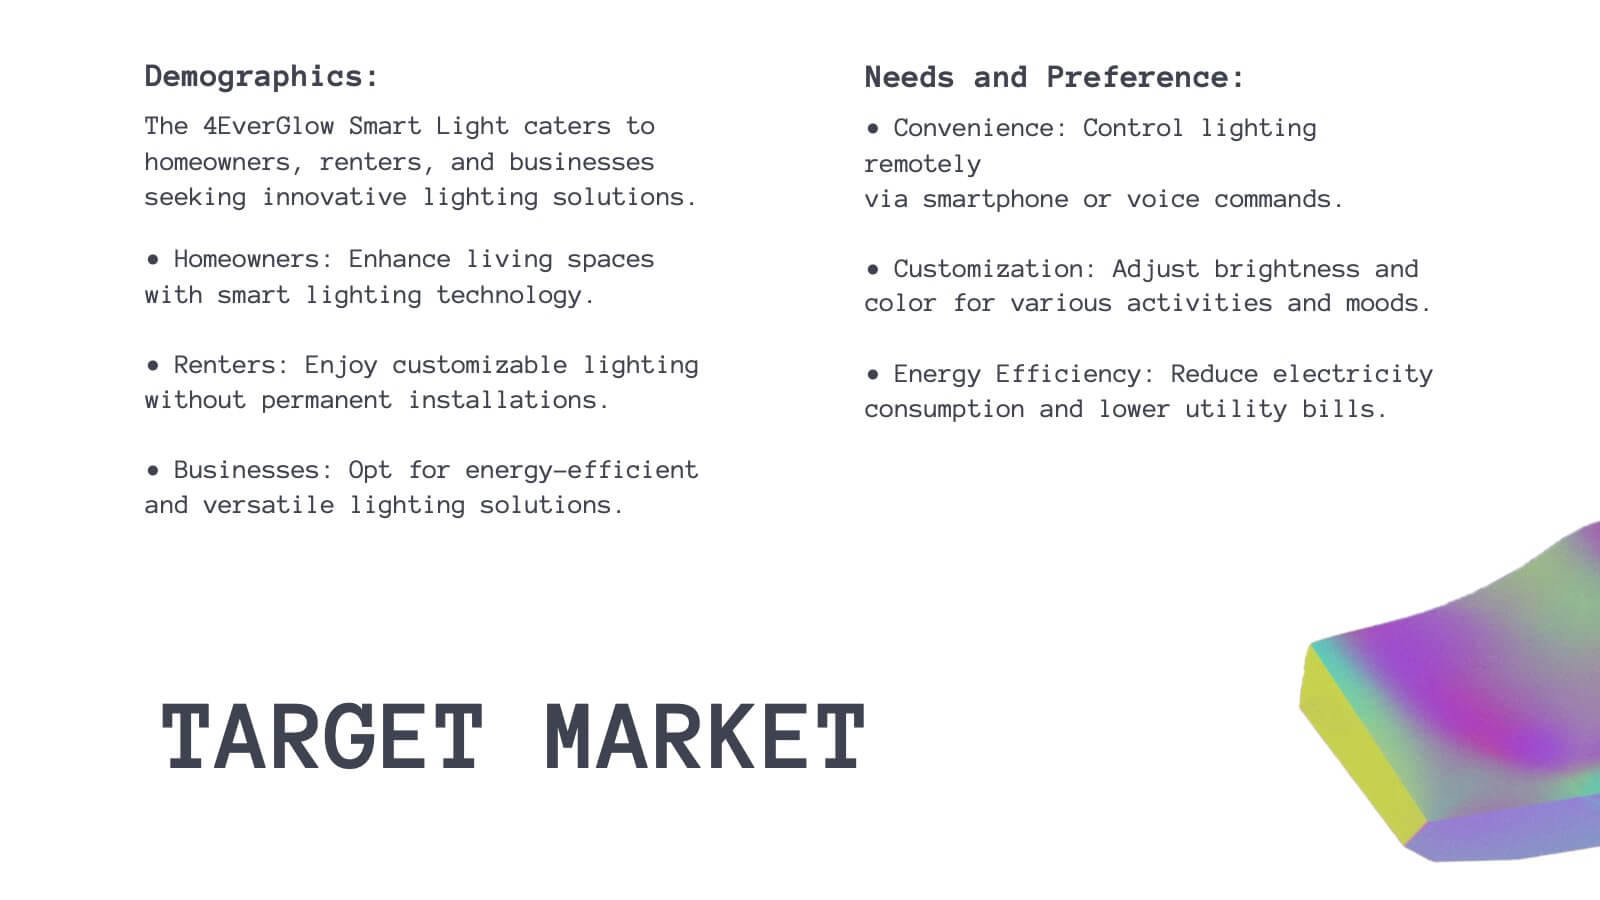
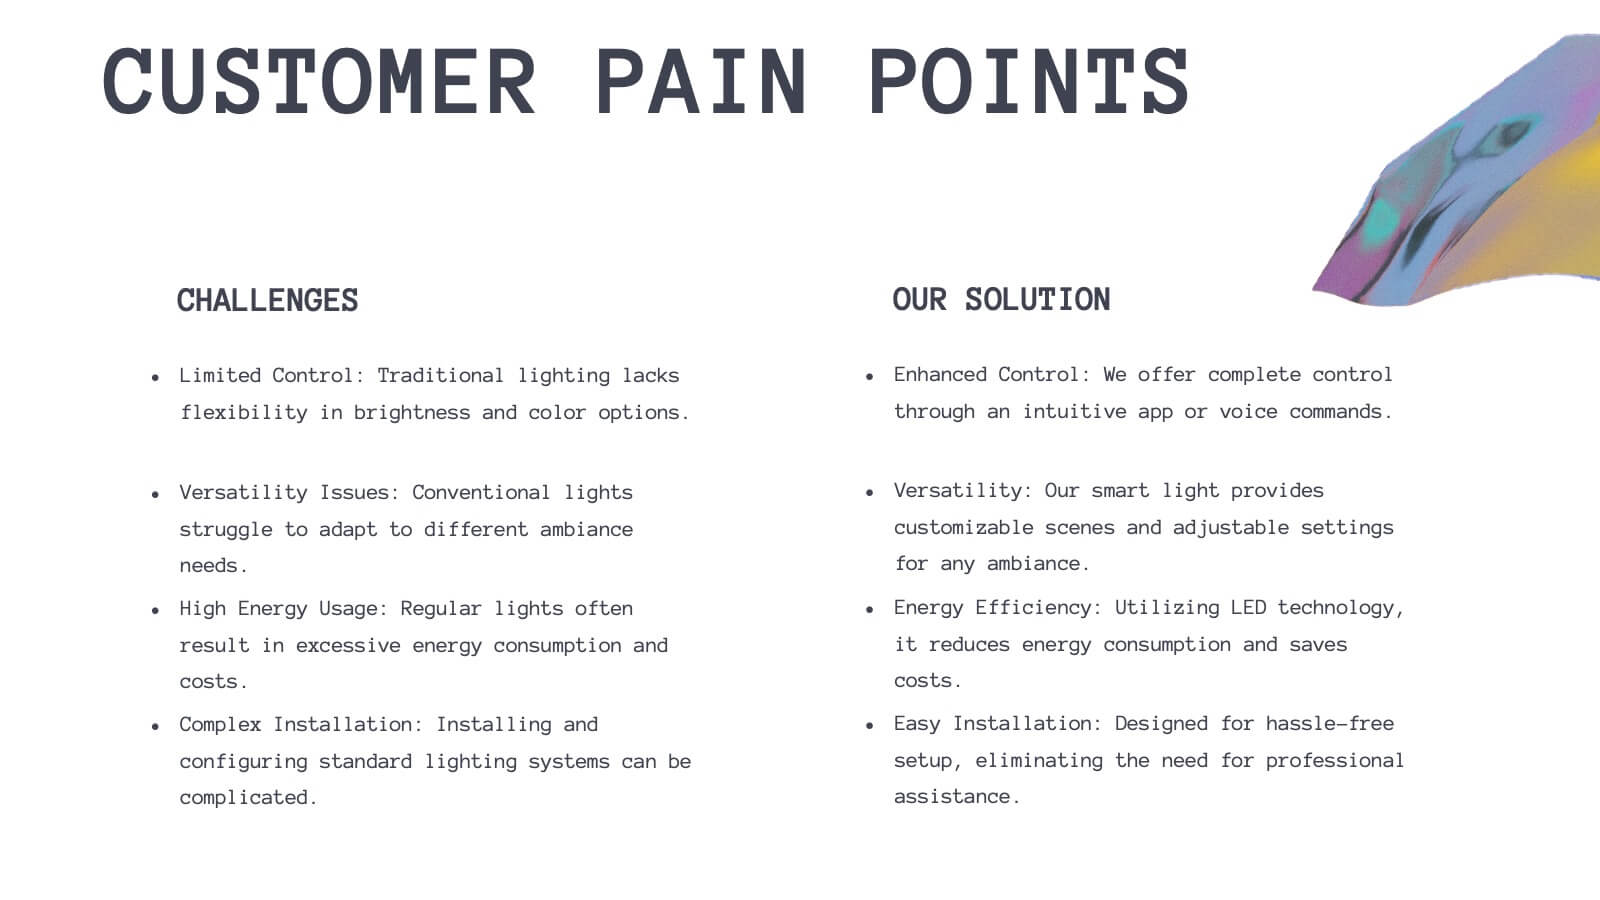
Bring your product journey to life with this vibrant, modern presentation template! Perfect for guiding your audience through product features, customer pain points, and competitive analysis, it’s designed for maximum clarity and engagement. Whether you’re showcasing technical specs or marketing strategies, this template fits all your needs. Compatible with PowerPoint, Keynote, and Google Slides.


4 slides
Survey Response Data Visuals Presentation
Present your survey data clearly with this radial icon-based layout. Show response percentages alongside descriptive titles and modern visuals. Ideal for feedback analysis or research summaries. Fully editable in Canva, PowerPoint, or Google Slides, this template offers a clean, professional look to highlight key insights with ease.


6 slides
Business Advancement Metrics Presentation
Get ready to visualize your wins! This presentation template brings clarity to your metrics, helping you showcase business growth and performance benchmarks with sleek, stacked visuals. Perfect for tracking KPIs, performance analysis, or advancement trends. Fully compatible with PowerPoint, Keynote, and Google Slides for easy editing and seamless presentation delivery.


5 slides
Food Industry Trends Presentation
Stay ahead of the curve with this visual presentation designed to spotlight key developments in the food industry. Featuring a creative pie chart integrated with food icons and utensils, this layout is perfect for data storytelling, market insights, or trend analysis. Fully editable in PowerPoint, Keynote, and Google Slides.


4 slides
Marketing SWOT Assessment Presentation
Analyze your brand’s position with this colorful Marketing SWOT Assessment layout. Clearly outline strengths, weaknesses, opportunities, and threats in a column format, perfect for client reports or strategy sessions. Fully customizable in PowerPoint, Keynote, and Google Slides—ideal for marketers seeking clarity, structure, and visual impact in every presentation.


4 slides
Regional Economic Evolution in Asia Map Presentation
Track economic progress across Asia with this regional growth map. Each country is paired with a progress bar for visual comparison of growth indicators. Ideal for data-driven insights, economic reviews, or development updates. Editable in PowerPoint, Keynote, and Google Slides for seamless customization and professional, geography-based presentations.


6 slides
Year-End Review and Financial Report Presentation
Summarize your business year clearly with the Year-End Review and Financial Report Presentation. This clean, modern layout uses quarterly donut charts and monthly timelines to help visualize performance at a glance. Ideal for financial recaps and executive meetings. Fully editable in Canva, PowerPoint, and Google Slides for easy updates and branding.


5 slides
Project Milestone Timeline Presentation
Bring your project’s journey to life with this vibrant and organized presentation layout. Designed to showcase milestones, releases, and key phases clearly, it helps teams stay aligned and focused on goals. Fully editable and compatible with PowerPoint, Keynote, and Google Slides for smooth, professional presentations every time.


6 slides
Three-Part Comparative Venn Layout Presentation
Showcase relationships, overlaps, and distinctions across three core elements with this elegant petal-style Venn layout. Perfect for comparing strategies, audiences, or product features. Each section includes customizable labels and icons. Fully editable in PowerPoint, Keynote, and Google Slides—ideal for business analysis, educational presentations, and marketing plans.


7 slides
Time Management Infographic Presentation Template
Time management skills are important in all aspects of life, not just work. Mastering time management allows you to get everything that you want out of your day. This time management template is the perfect tool to help you stay productive. Keep track of tasks, create a schedule and organize time where you need it most. Use this template to build a database of your weekly tasks, daily activities and recurring tasks that can be easily structured in a clock view. This time management template Is compatible with Powerpoint, Keynote, and Google Slides, so you can use it on any device.


6 slides
Lean Business Canvas Framework
Simplify your business strategy with the Lean Business Canvas Framework Presentation. This slide offers a structured layout to map out key elements like partners, activities, value propositions, customer segments, and revenue streams—all in one view. Ideal for startups, business plans, or internal strategy sessions. Fully editable in PowerPoint, Keynote, and Google Slides.