


Features
- 8 Unique slides
- Fully editable and easy to edit in Microsoft Powerpoint, Keynote and Google Slides
- 16:9 widescreen layout
- Clean and professional designs
- Export to JPG, PDF or send by email


Do you have any questions?
Recommend


6 slides
Strategy Wheel Infographic Slide
Present key strategies, priorities, or action items in a visually engaging circular format. This infographic template is ideal for showcasing 5 interconnected components in business plans, marketing strategies, or process flows. Fully editable in PowerPoint, Keynote, and Google Slides for seamless customization.


6 slides
Change Management Model Infographics
Navigate organizational change effectively with our Change Management Model infographic template. This template is fully compatible with popular presentation software like PowerPoint, Keynote, and Google Slides, allowing you to easily customize it to illustrate and communicate the key components of a change management model. The Change Management Model infographic template offers a visually engaging platform to outline the stages, strategies, and best practices for managing change within an organization. Whether you're a change management professional, business leader, or team member involved in change initiatives, this template provides a user-friendly canvas to create informative presentations and educational materials. Optimize your change management processes with this SEO-optimized Change Management Model infographic template, thoughtfully designed for clarity and ease of use. Customize it to showcase the change model you're using, steps involved, communication strategies, and the importance of addressing resistance to change. Ensure that your audience gains valuable insights into effective change management. Start crafting your personalized infographic today to navigate change with confidence.


5 slides
Clear Strategy in Five Stages Presentation
Outline your strategic roadmap with this five-step cube staircase layout. Perfect for planning, growth tracking, or project milestones, each stage is color-coded with icons and numbered steps for clarity. Easy to edit in PowerPoint, Keynote, and Google Slides—ideal for business planning, strategy sessions, or performance reviews.


22 slides
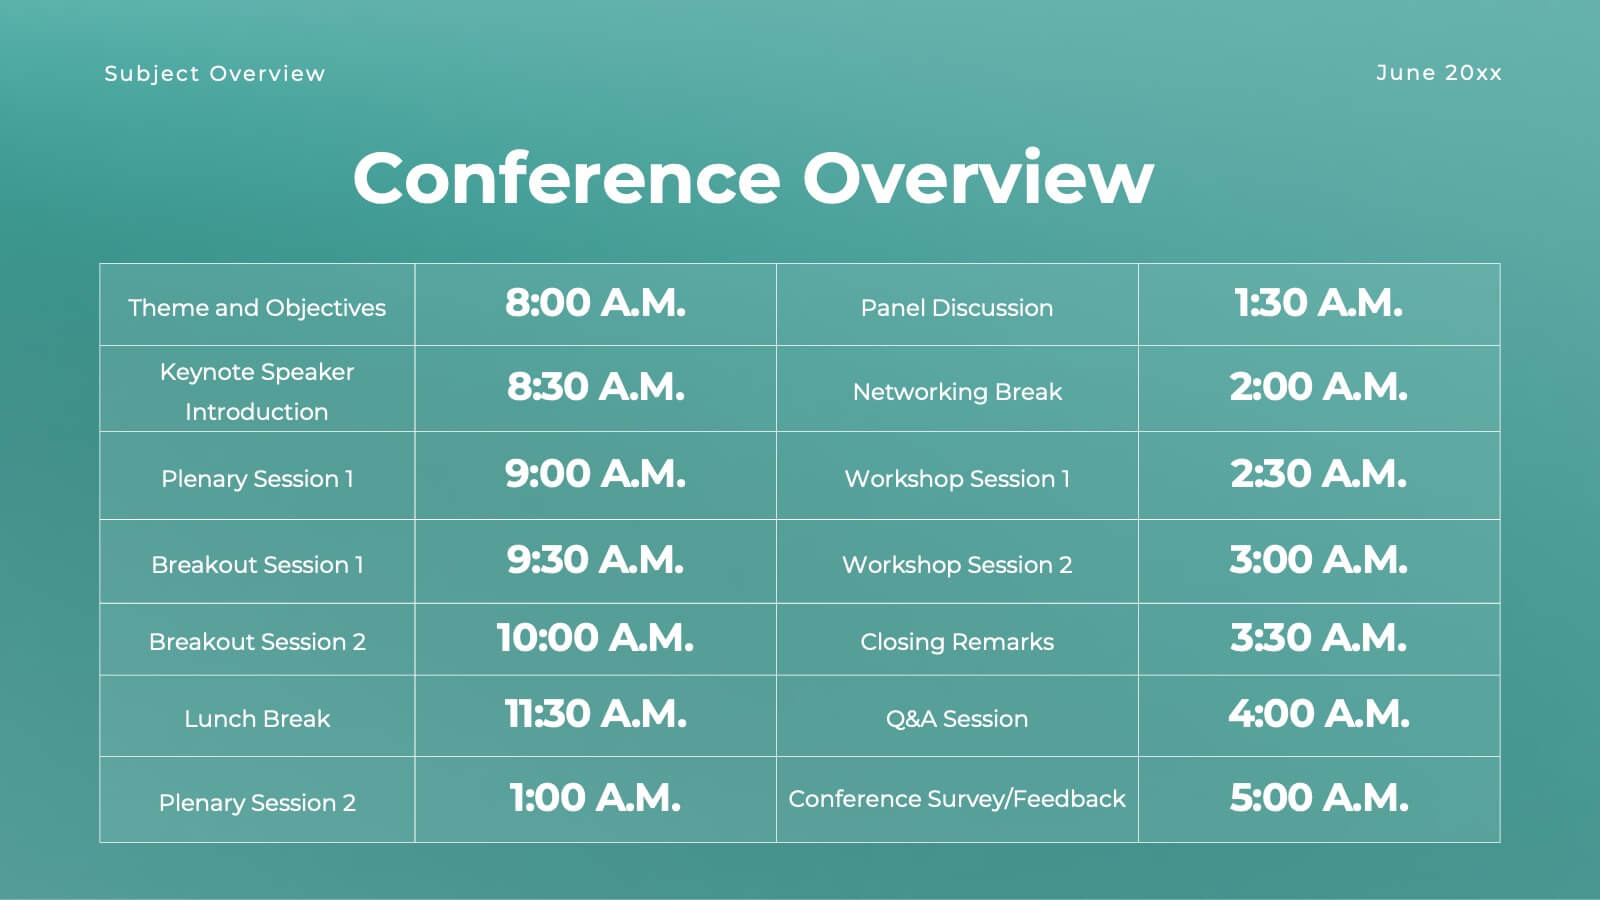
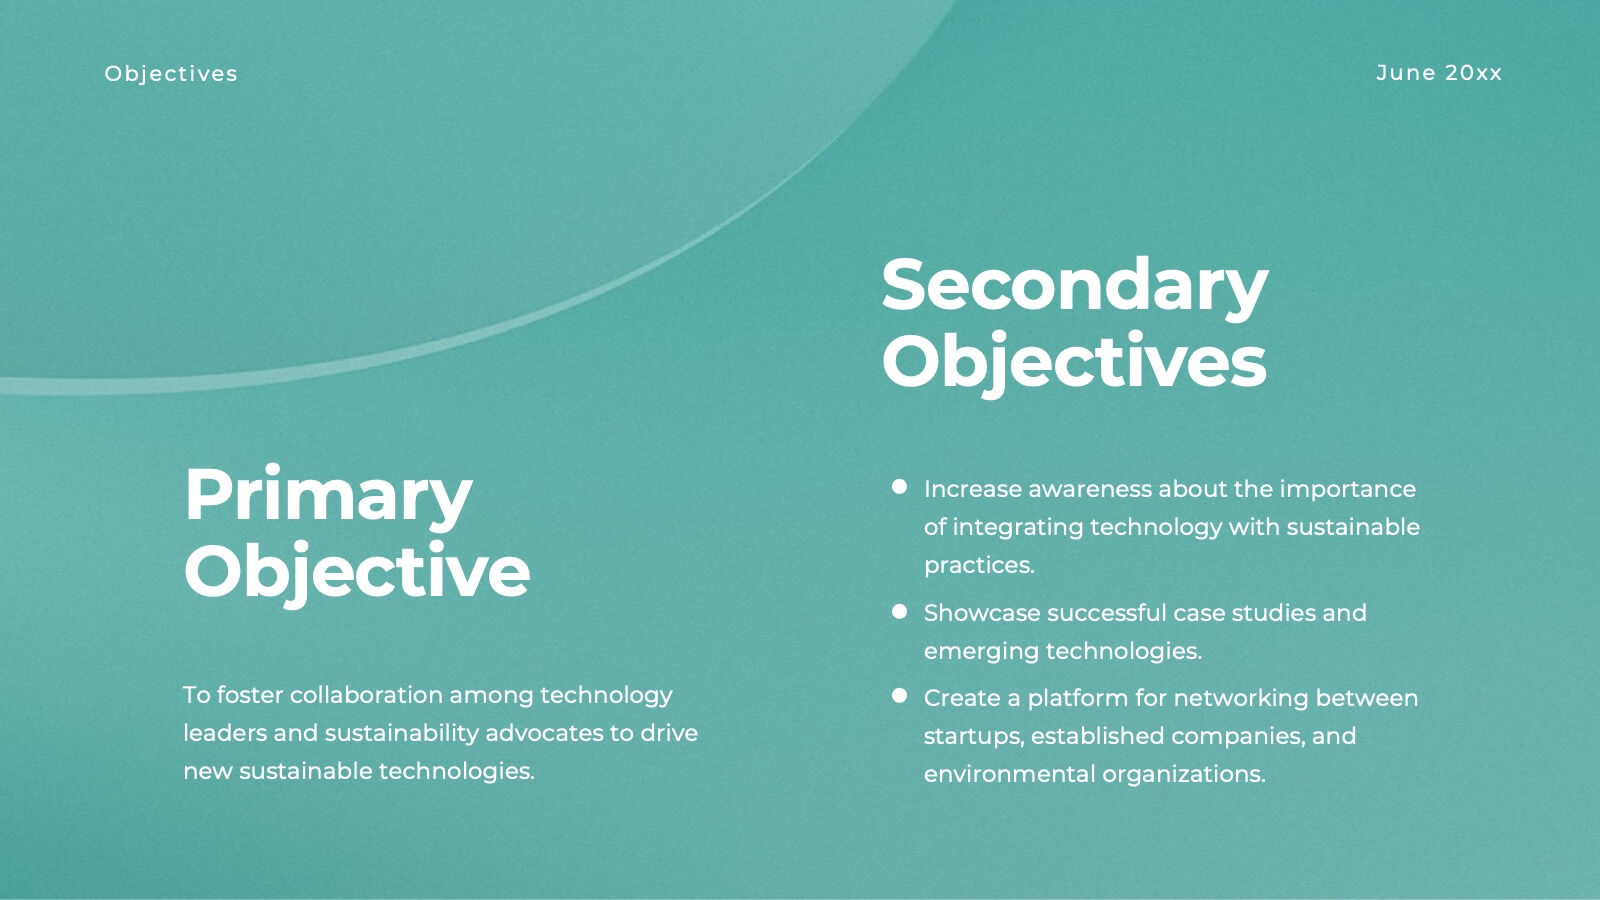
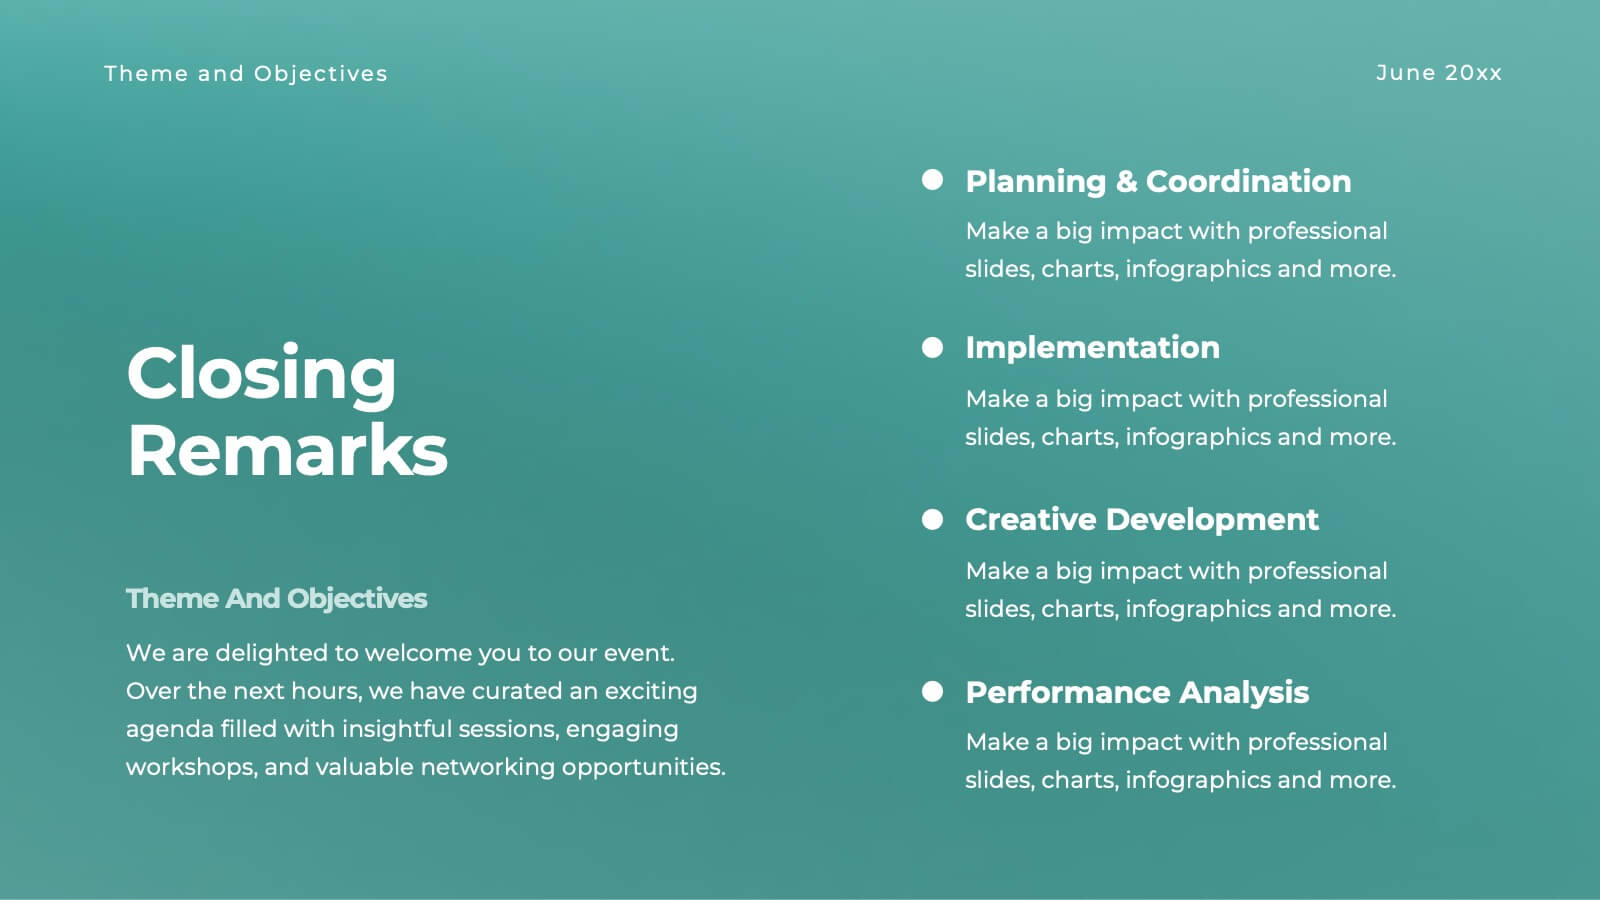
Halo Small Business Pitch Deck Presentation
Streamline your business presentations with this versatile pitch deck template! Ideal for conferences and meetings, it includes slides for objectives, session details, keynote speakers, and panel discussions. Keep your audience engaged with professional design and clear, structured content. Compatible with PowerPoint, Keynote, and Google Slides for seamless presentations on any platform.


5 slides
Corporate Messaging Strategy Presentation
Clarify your company’s voice with this corporate messaging strategy slide. Designed to outline your core communication pillars, this layout helps you present messaging priorities across different channels or audiences. Perfect for marketing teams, branding sessions, or executive briefings. Fully editable in Canva, PowerPoint, and Google Slides for quick customization.


5 slides
Scrum Sprint Planning Presentation
Streamline your workflow presentations with this vibrant and intuitive Scrum Sprint Planning slide. Featuring a circular sprint cycle and directional flow, it clearly outlines the iterative process from planning to delivery. Perfect for agile teams presenting timelines, team roles, or workflow overviews. Easily customizable and compatible with PowerPoint, Keynote, and Google Slides.


7 slides
Transportation and Logistics Services Infographic
Transportation and logistics are critical to the functioning of modern economies, facilitating the movement of goods, people, and services from one place to another. This template is a professional infographic focusing on the main topics of transportation, logistics and their relationships. Use this template to illustrate the bustling world of transportation and logistic solutions from around the globe. It comes with a variety of diagrams and illustrations, which will make your presentation more appealing. This template is fully editable and compatible with Powerpoint, keynote and google slides.

18 slides
Pinnacle Academic Research Report Presentation
Present your academic research with style and precision using this comprehensive template. It covers everything from research objectives to key findings and recommendations. Perfect for making your data clear and engaging. Compatible with PowerPoint, Keynote, and Google Slides, it ensures your research is presented professionally and effectively.


6 slides
Strategic Blocks in Business Canvas
Visualize and communicate your business model effectively with the Strategic Blocks in Business Canvas Presentation. This slide breaks down all critical segments—Partners, Activities, Resources, Value Propositions, Channels, Revenue Streams, and more—into a clean and colorful layout for strategic planning and stakeholder alignment. Fully editable in PowerPoint, Keynote, and Google Slides.


6 slides
Framework Version Infographic
A framework infographic is a visual representation that outlines a structured approach, model, or framework for understanding a concept, solving a problem, or making decisions. This infographic template involves visually presenting different versions of a software or system framework along with their features and benefits. Summarize the improvements and benefits introduced by each framework version. This template provides a clear overview of the evolution of the framework and how each version brought value to users. By using icons, graphics, and concise descriptions, you can make the information easily digestible and engaging for your audience.


6 slides
6-Stage Business Cycle Presentation
The "6-Stage Business Cycle Presentation" template expertly outlines the progression of business processes through a visually appealing circular diagram, perfect for detailed strategic presentations. This template features six interconnected stages, each distinguished by unique colors and intuitive icons, simplifying complex business concepts into digestible segments. Central placeholders allow for concise titles and brief descriptions, enhancing clarity and comprehension. Ideal for business analysts, strategists, and educators, this tool facilitates the effective communication of developmental cycles, operational processes, and strategic evaluations. Use this template in board meetings, workshops, or educational sessions to convey the cyclical nature of business tasks and strategies efficiently.


6 slides
Business Strategy Pyramid Presentation
Outline your strategic priorities with clarity using the Business Strategy Pyramid Presentation. This template features a five-step 3D pyramid that highlights key business goals, initiatives, or stages. Each layer includes icons and numbered sections for easy interpretation. Ideal for strategy meetings, executive briefings, and growth plans. Fully editable in PowerPoint, Keynote, and Google Slides.


6 slides
Porter's Five Forces Competitive Rivalry Infographics
Analyze competitive rivalry effectively with our Porter's Five Forces Competitive Rivalry infographic template. This template is fully compatible with popular presentation software like PowerPoint, Keynote, and Google Slides, allowing you to easily customize it to illustrate and communicate the factors influencing competitive rivalry within an industry. The Porter's Five Forces Competitive Rivalry infographic template offers a visually engaging platform to outline Michael Porter's framework for analyzing competitive dynamics, with a focus on the competitive rivalry component. Whether you're a business strategist, analyst, or anyone interested in understanding industry competition, this template provides a user-friendly canvas to create informative presentations and educational materials. Deepen your understanding of Competitive Rivalry with this SEO-optimized infographic template, thoughtfully designed for clarity and ease of use. Customize it to showcase the factors affecting rivalry, such as the number of competitors, industry growth, differentiation, and exit barriers, ensuring that your audience gains valuable insights into competitive forces at play. Start crafting your personalized infographic today to analyze and strategize for competitive advantage effectively.


7 slides
Design Mockup Infographic
Present your creative projects with precision and style using this collection of design mockup templates. Each template is expertly crafted to showcase your graphic designs, digital art, or branding projects across multiple devices and settings, emphasizing both detail and context. Featuring sleek, modern layouts, these mockups integrate vibrant color schemes and dynamic typography to make your designs pop. Ideal for graphic designers, marketers, and creative agencies, these templates provide a professional setting for presenting web designs, app interfaces, and other digital products to clients and stakeholders. Customize these templates with ease, adding your own images and text to tailor the mockups to your specific project needs. Whether you're creating a portfolio, client presentation, or marketing materials, these mockups will help you display your work in the most effective and engaging way.


4 slides
Scrum Team Retrospective Overview Deck Presentation
Reflect on past sprints with this structured Scrum Team Retrospective Deck. Featuring four quadrants for clear team feedback—what worked, what didn’t, ideas for improvement, and action items. Ideal for agile coaches and team leads. Fully editable in PowerPoint, Keynote, and Google Slides to match your team's review process.


20 slides
Mythion Business Idea Pitch Deck Presentation
Communicate your business vision with clarity and impact using this comprehensive pitch deck presentation template. Perfect for entrepreneurs, startups, and innovators, this template is designed to help you effectively present your idea to investors, stakeholders, or partners. Cover every essential aspect of your business journey with slides dedicated to the problem statement, solutions, market overview, and target audience. Showcase your business model, revenue projections, and unique selling proposition with visually appealing layouts. Highlight your marketing strategy, growth projections, and funding requirements to build a strong, persuasive case. Fully customizable and compatible with PowerPoint, Google Slides, and Keynote, this template allows you to tailor each slide to suit your business identity and goals. Whether you're pitching a new idea or seeking investment, this template ensures you present with professionalism and confidence.


7 slides
Corporation Hierarchy Infographic
Discover the intricate layers of corporate structure with our corporation hierarchy infographic. Set in an appealing blend of blue, yellow, and white, this template artfully depicts the hierarchal ladder commonly seen in major corporations. From CEOs to interns, it beautifully outlines every rung. This infographic is indispensable for business students, corporate trainers, managers, and anyone seeking to understand the inner workings of a corporation. Designed with precision and clarity, it's perfectly suited for PowerPoint, Keynote, and Google Slides, making your presentations not only informative but also visually captivating.