


Features
- 4 Unique slides
- Fully editable and easy to edit in Microsoft Powerpoint, Keynote and Google Slides
- 16:9 widescreen layout
- Clean and professional designs
- Export to JPG, PDF or send by email


Do you have any questions?
Recommend


5 slides
Environment News Infographics
Dive into the pressing issues of our times with environment news infographics. Crafted in shades of a serene blue palette, this collection is designed for environmental activists and journalists. It stands out with its creative, vertical style, making it perfect for detailed storytelling and comprehensive data representation related to environmental news and studies. Compatible with Powerpoint, Keynote, and Google Slides. The template features innovative graphics, icons, and image placeholders, all customizable to highlight ecological statistics, climate change advancements, or conservation efforts, making complex information accessible and engaging.


6 slides
Ideal Buyer Persona Customer Profile Presentation
Define your perfect customer with the Ideal Buyer Persona Customer Profile Presentation. This clear and visually structured layout helps you map out key traits, behaviors, and needs of your target audience. Easy to edit in Canva, PowerPoint, or Google Slides—ideal for marketing teams, strategists, and business development presentations.


6 slides
Cryptocurrency Exchange Infographic
A cryptocurrency exchange is a platform that allows users to buy, sell, and trade cryptocurrencies. This infographic template illustrates the key aspects of cryptocurrency exchanges, providing an overview of how these platforms work, their benefits, and the steps involved in trading cryptocurrencies. This infographic aims to educate and inform individuals about cryptocurrency exchanges and make the process of trading digital assets more accessible. This template aims to simplify complex concepts and provide a clear overview of the steps involved in using cryptocurrency exchanges, encouraging more people to participate in the growing digital asset market.


5 slides
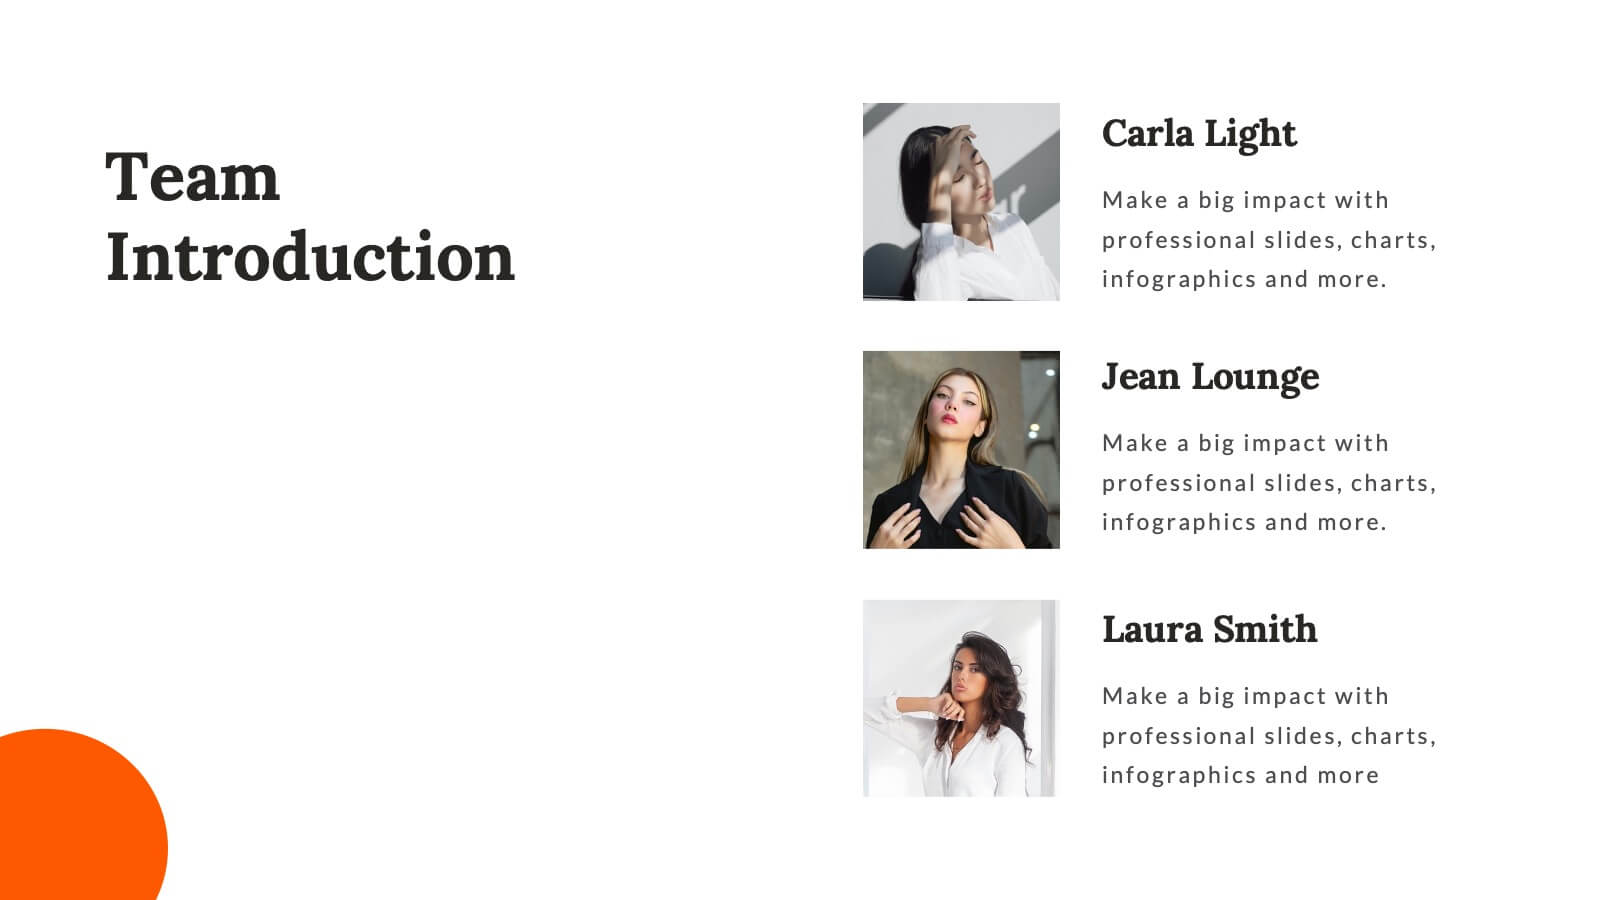
Corporate Teamwork Presentation
The "Corporate Teamwork" presentation template visually captures the interconnectivity of team roles and tasks. Each slide features a circular flow diagram with icons representing different aspects of business teamwork. The dynamic arrangement of the icons around the central circle helps illustrate the cyclical nature of team processes and collaboration. This template allows for customization with text and color coding, making it easy to adapt to specific corporate environments or team structures. It's a great tool for presentations aimed at enhancing teamwork strategies or demonstrating the flow of tasks within team settings.


4 slides
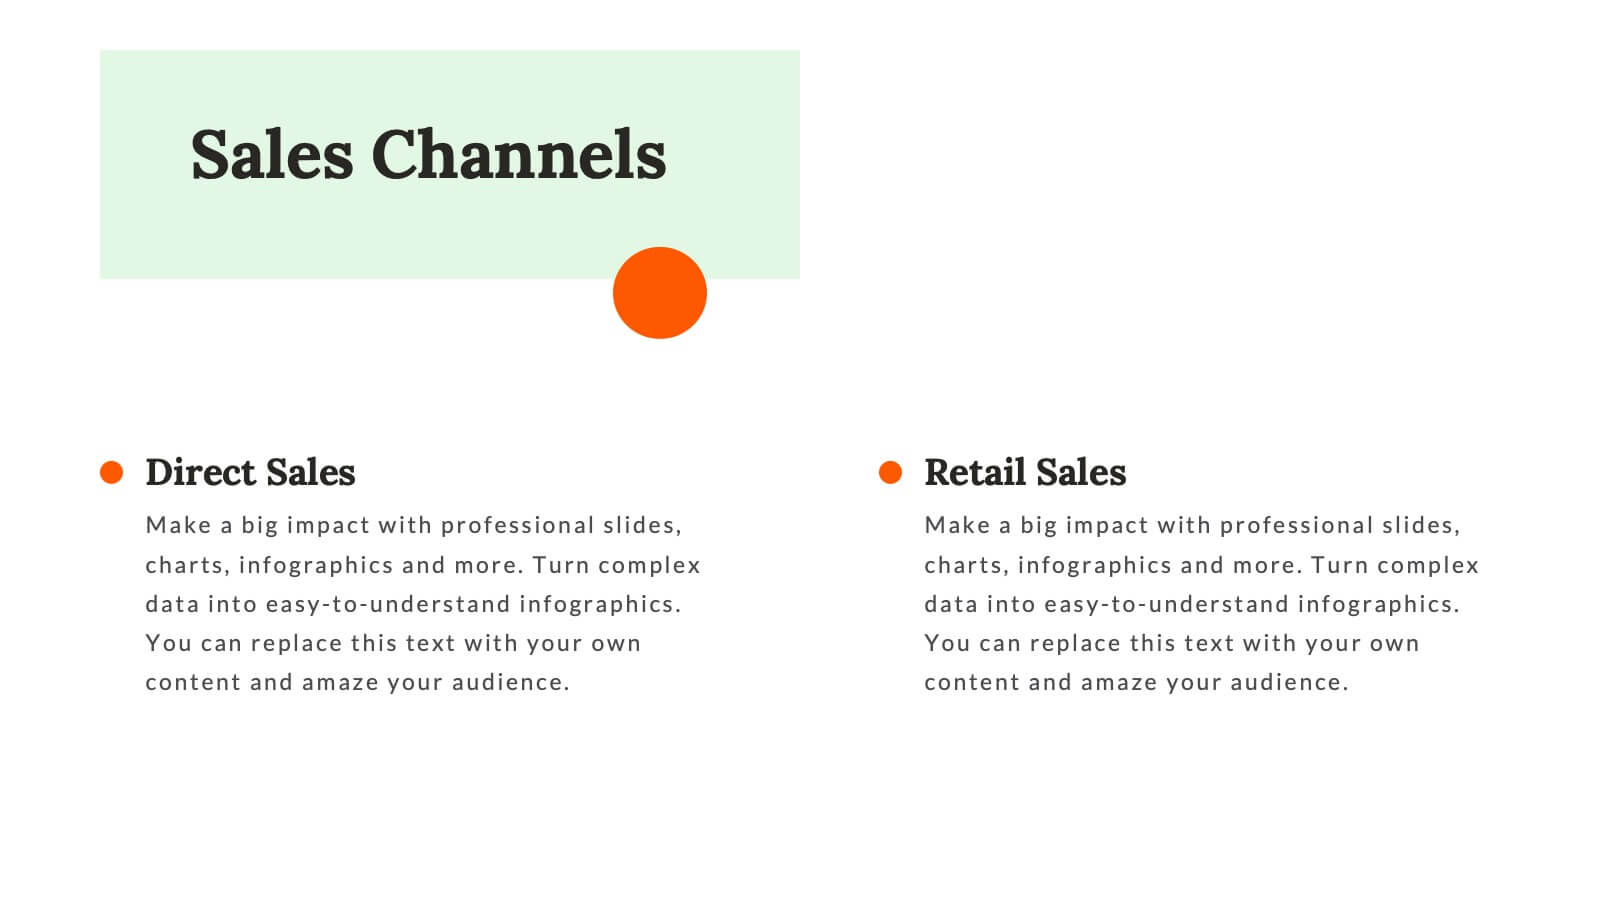
Social Media Content Strategy Presentation
Engage your audience with this Social Media Content Strategy Presentation. Featuring side-by-side thumbs-up icons, this template visually contrasts two key focus areas—ideal for comparing campaign goals, content pillars, or platform strategies. Each section includes editable text blocks to outline insights clearly. Fully customizable and compatible with PowerPoint, Keynote, and Google Slides.


6 slides
Bitcoin and Blockchain Technology Presentation
Unlock the potential of cryptocurrency and distributed ledger technology with our "Bitcoin and Blockchain Technology" presentation templates. These templates are designed to elucidate complex concepts in an understandable format, making them ideal for educators, technologists, and business professionals. Compatible with PowerPoint, Keynote, and Google Slides, they are a versatile tool for anyone looking to explain or explore the innovative world of blockchain.


21 slides
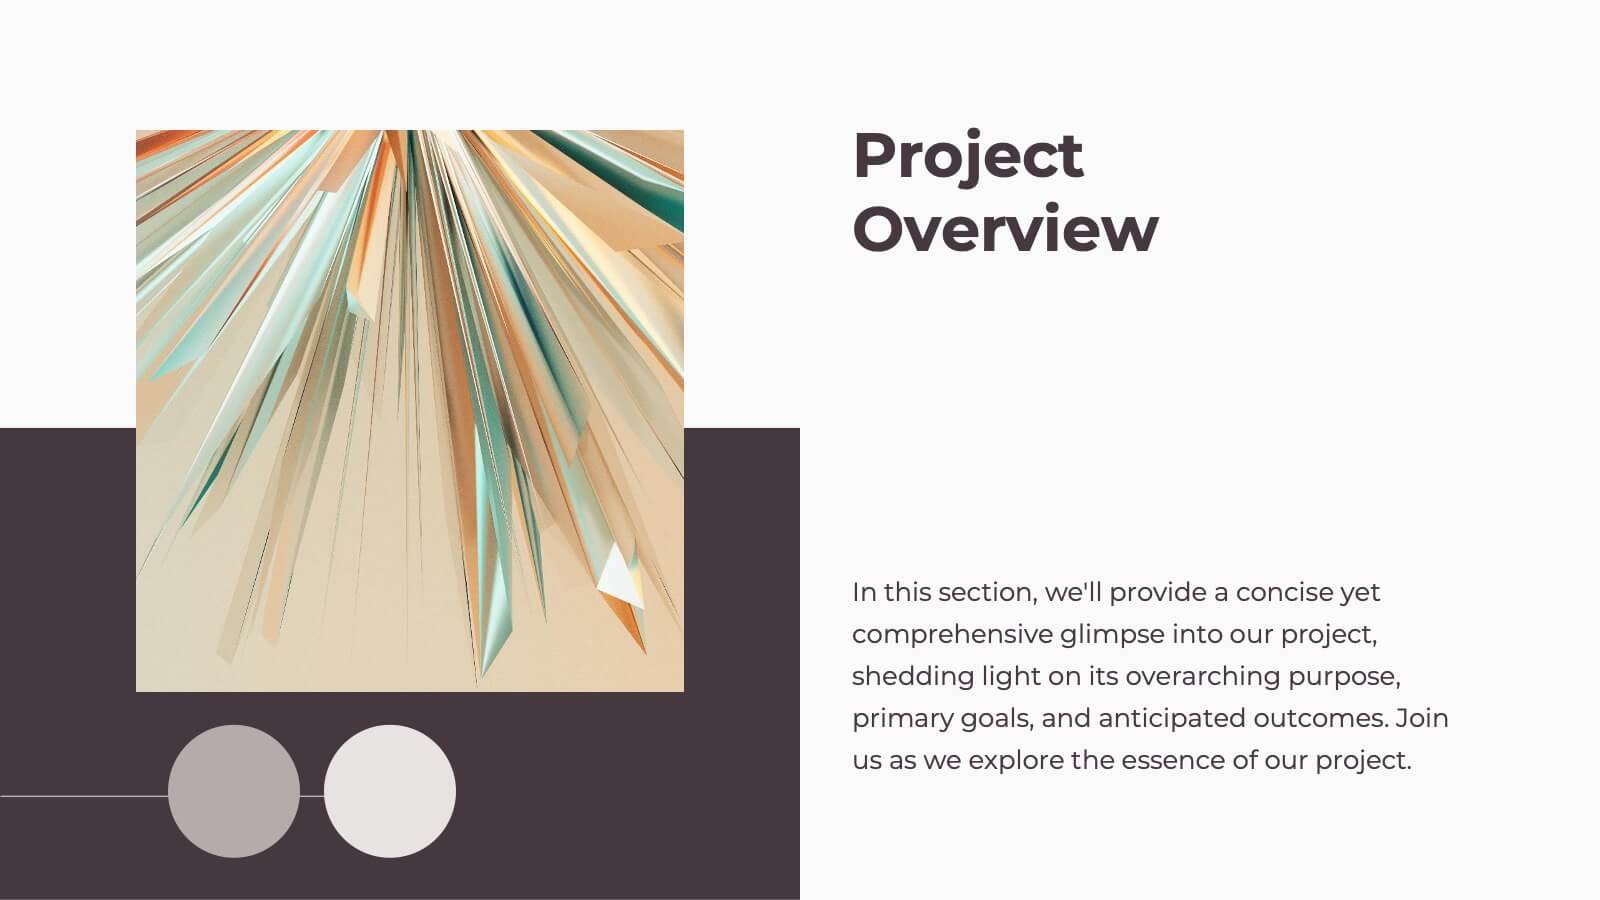
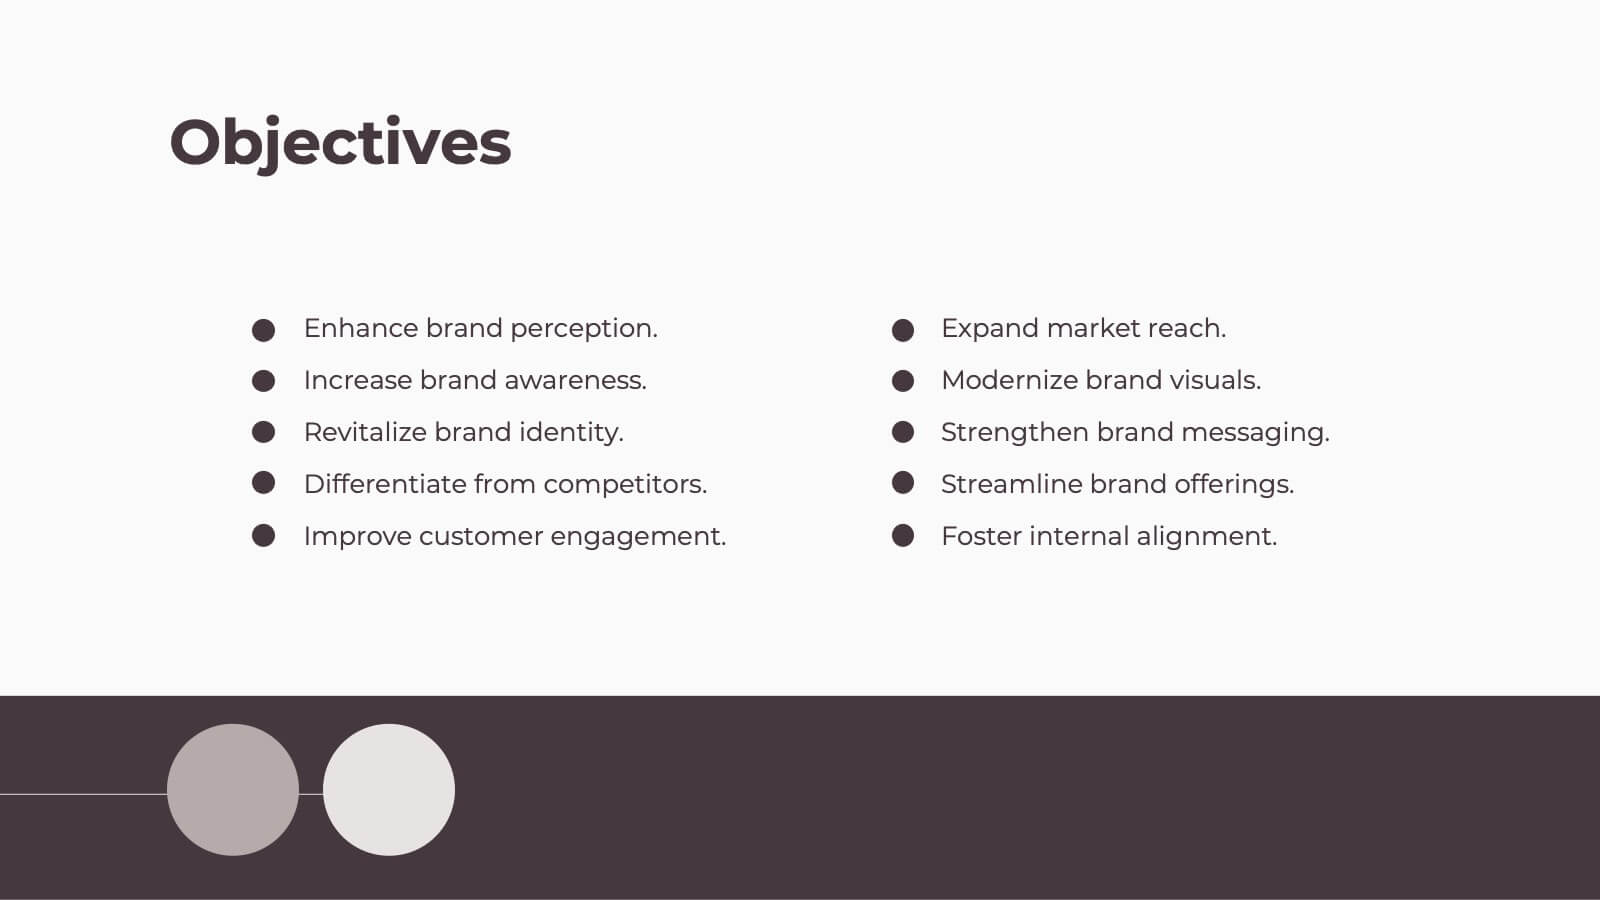
Spectrum Project Timeline Presentation
Plan and execute your projects with precision using this detailed project plan template! Perfect for outlining objectives, timelines, and resource allocation. Ideal for project managers and teams aiming to ensure successful project delivery. Compatible with PowerPoint, Keynote, and Google Slides, this template keeps your project organized, clear, and on track. Ensure project success!


22 slides
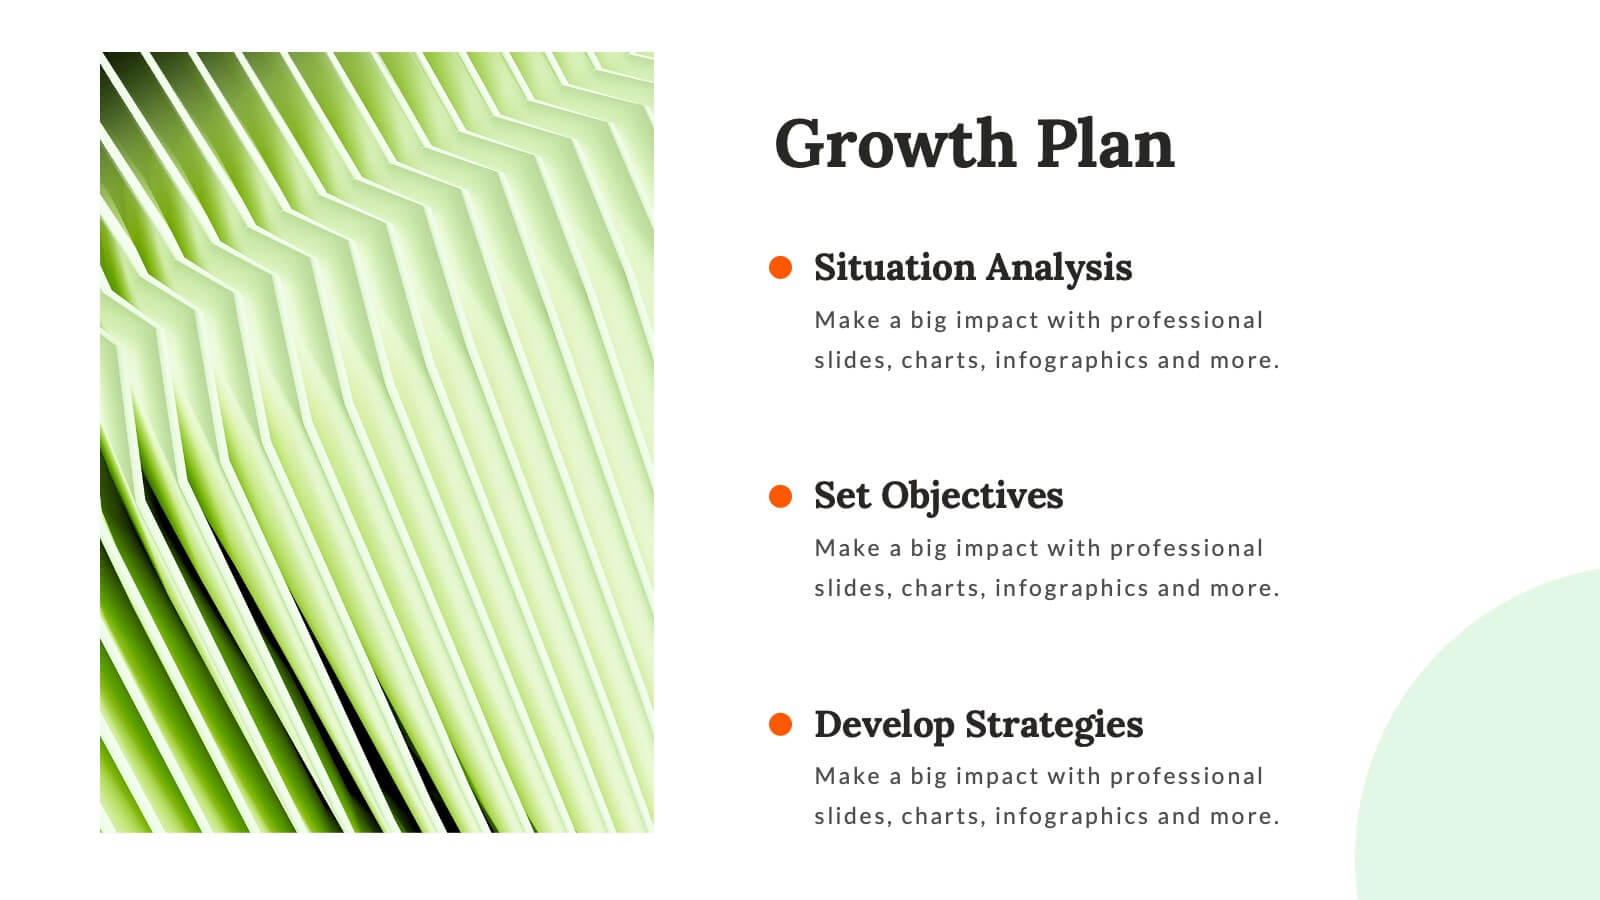
Nexus Startup Growth Plan Presentation
Jumpstart your business journey with this dynamic presentation template! Ideal for outlining your startup growth plan, it covers mission, vision, market analysis, and financial projections with sleek, professional slides. Capture investor interest and articulate your strategy effortlessly. Compatible with PowerPoint, Keynote, and Google Slides, ensuring seamless presentation across all platforms.


20 slides
Whirlwind Startup Funding Proposal Presentation
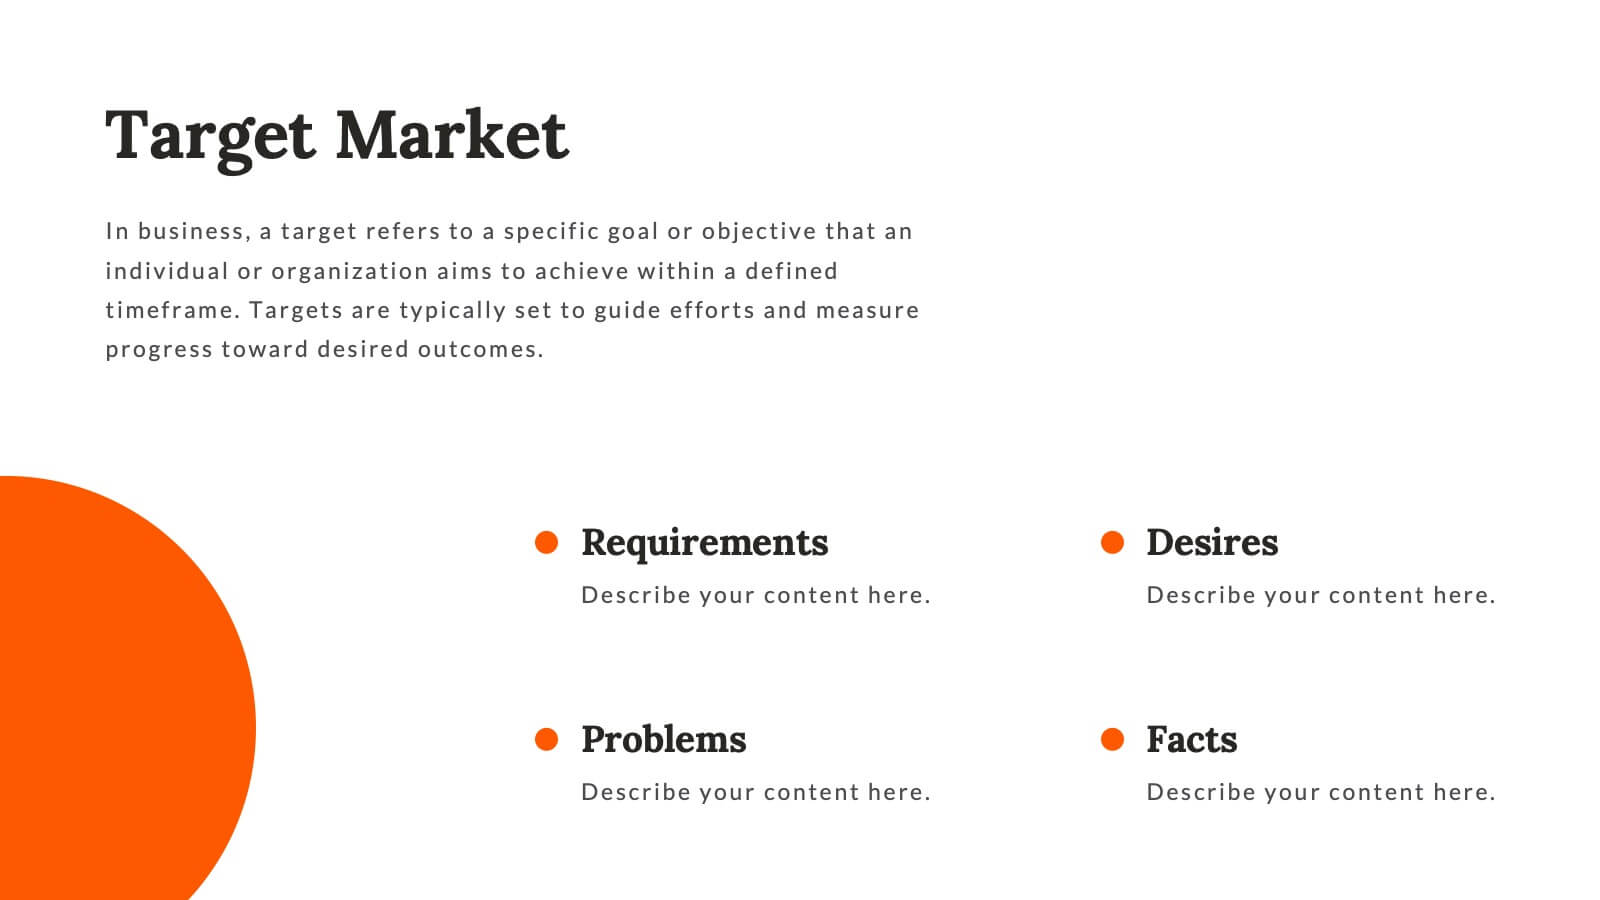
Transform your startup funding proposals with this vibrant and professional template. Designed to impress potential investors, it features sections for mission & vision, founding story, market analysis, and financial overview. Highlight your unique value proposition and business model with clarity and style. This template is compatible with PowerPoint, Keynote, and Google Slides, ensuring seamless presentations on any platform. Perfect for conveying your innovative ideas and growth plans effectively.


4 slides
Team Performance Improvement Plan Presentation
Bring strategy to life with a clean, focused layout that makes team growth easy to follow. This template helps visualize performance gaps, goals, and action steps in a simple format, perfect for outlining improvement plans and productivity initiatives. Fully editable in PowerPoint, Keynote, and Google Slides for seamless team collaboration.


8 slides
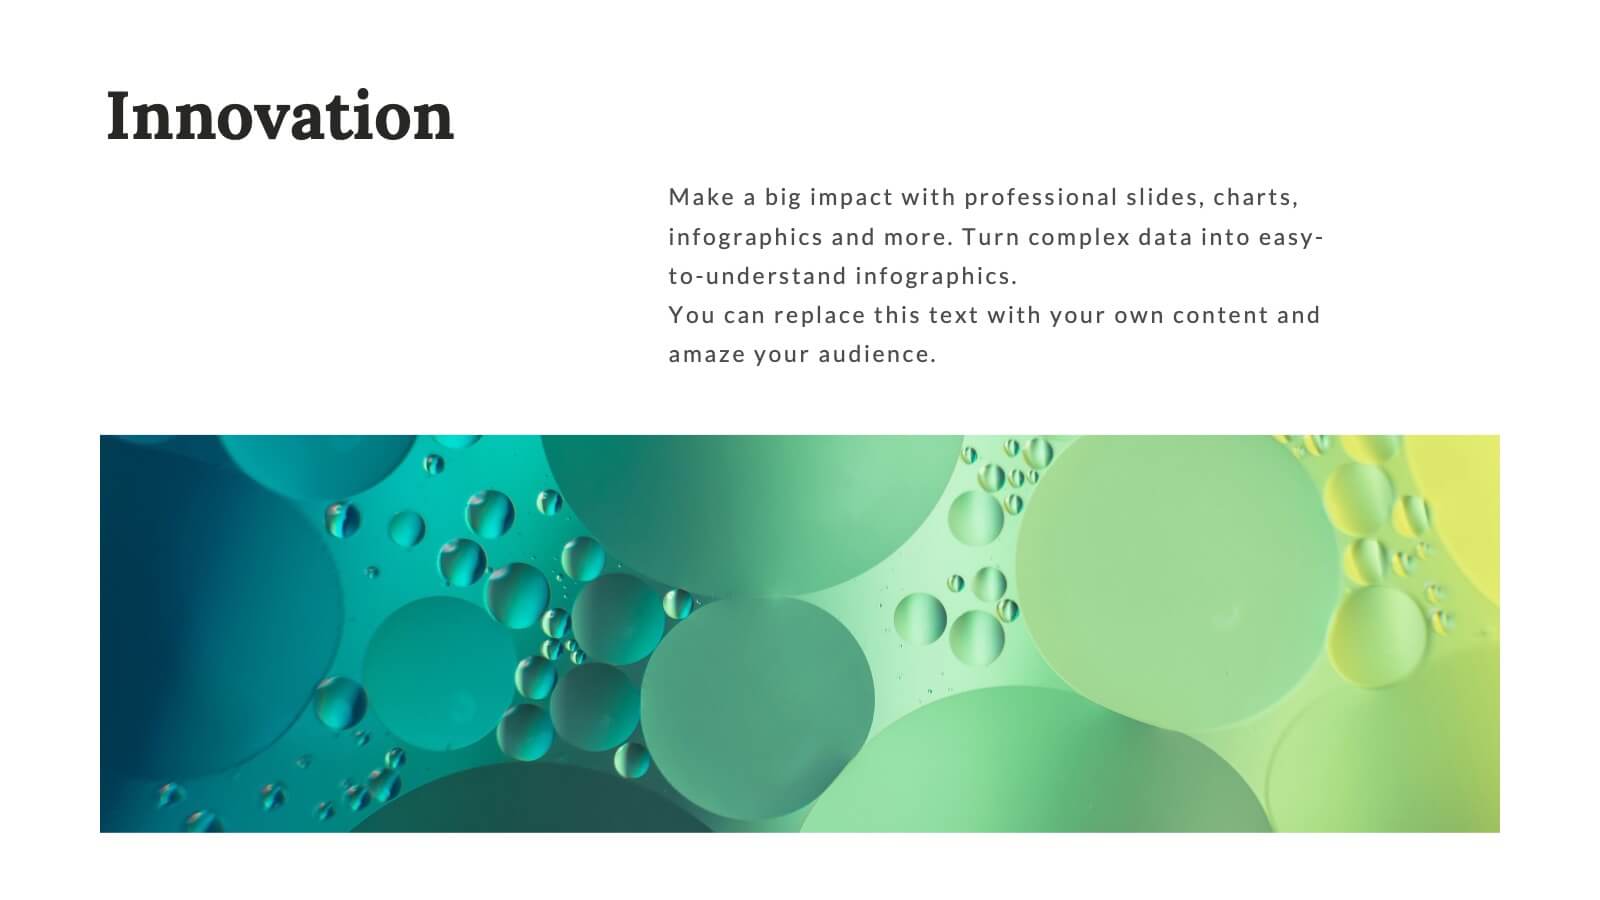
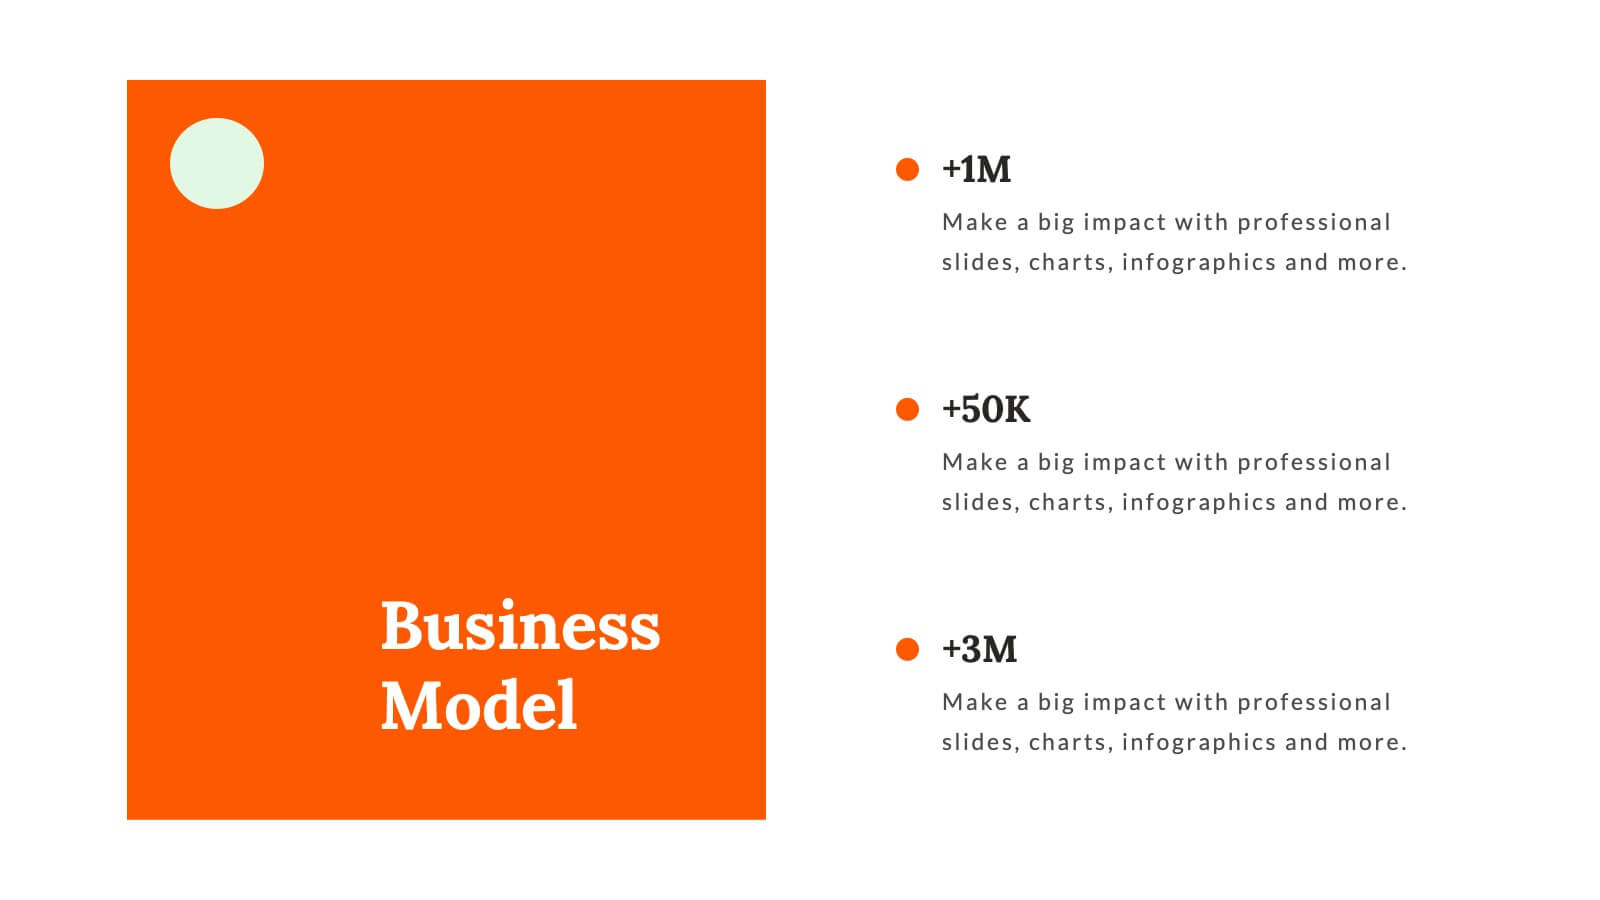
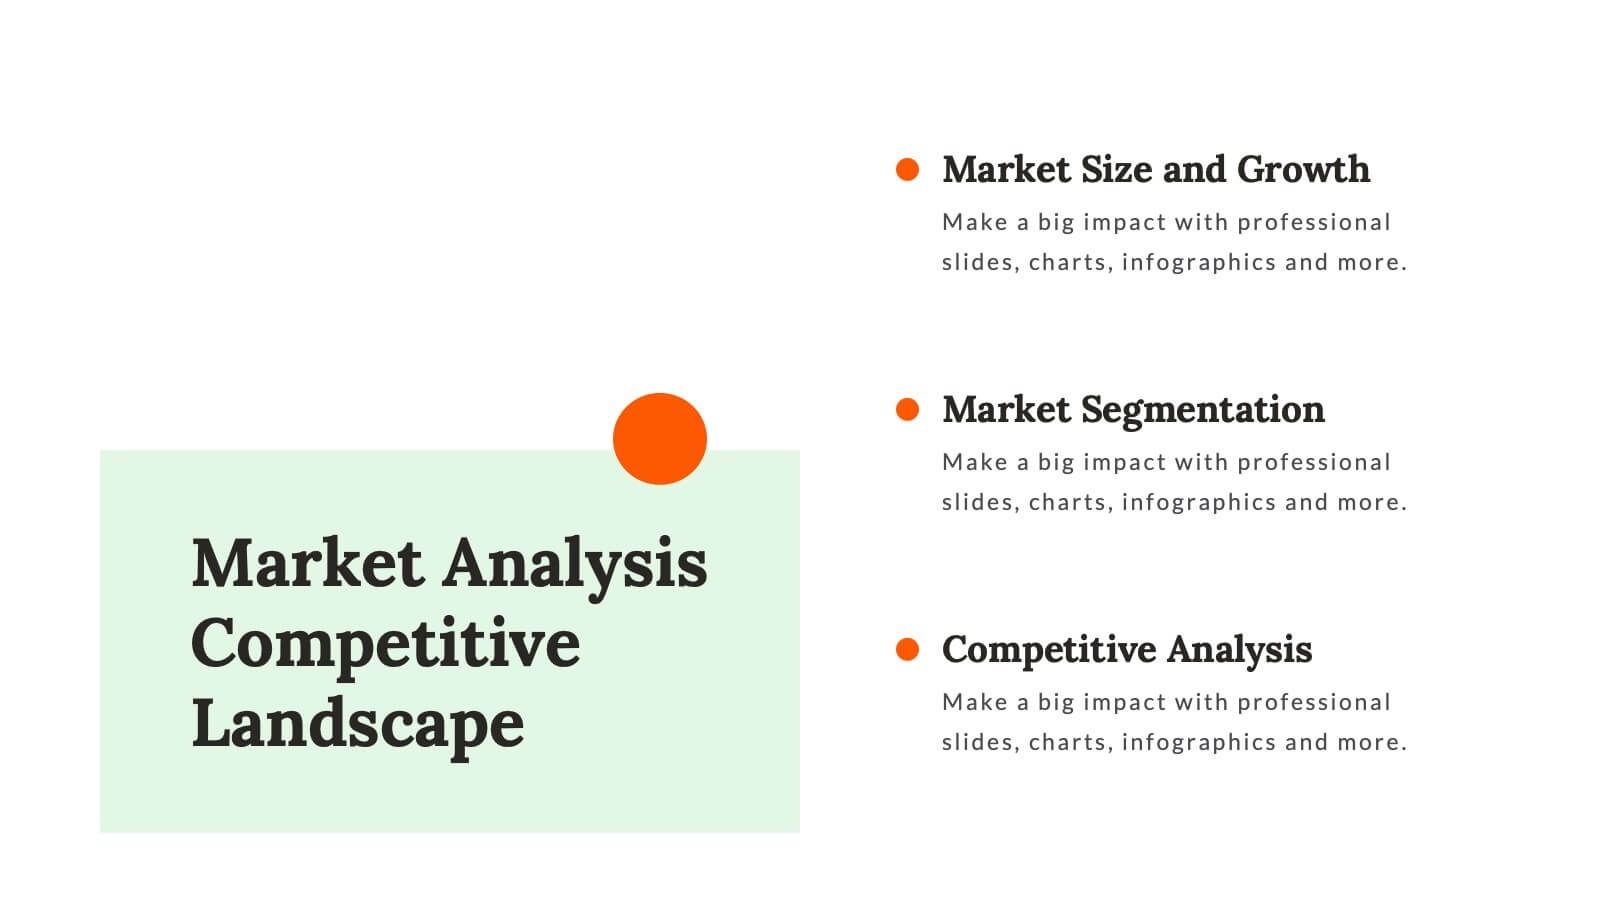
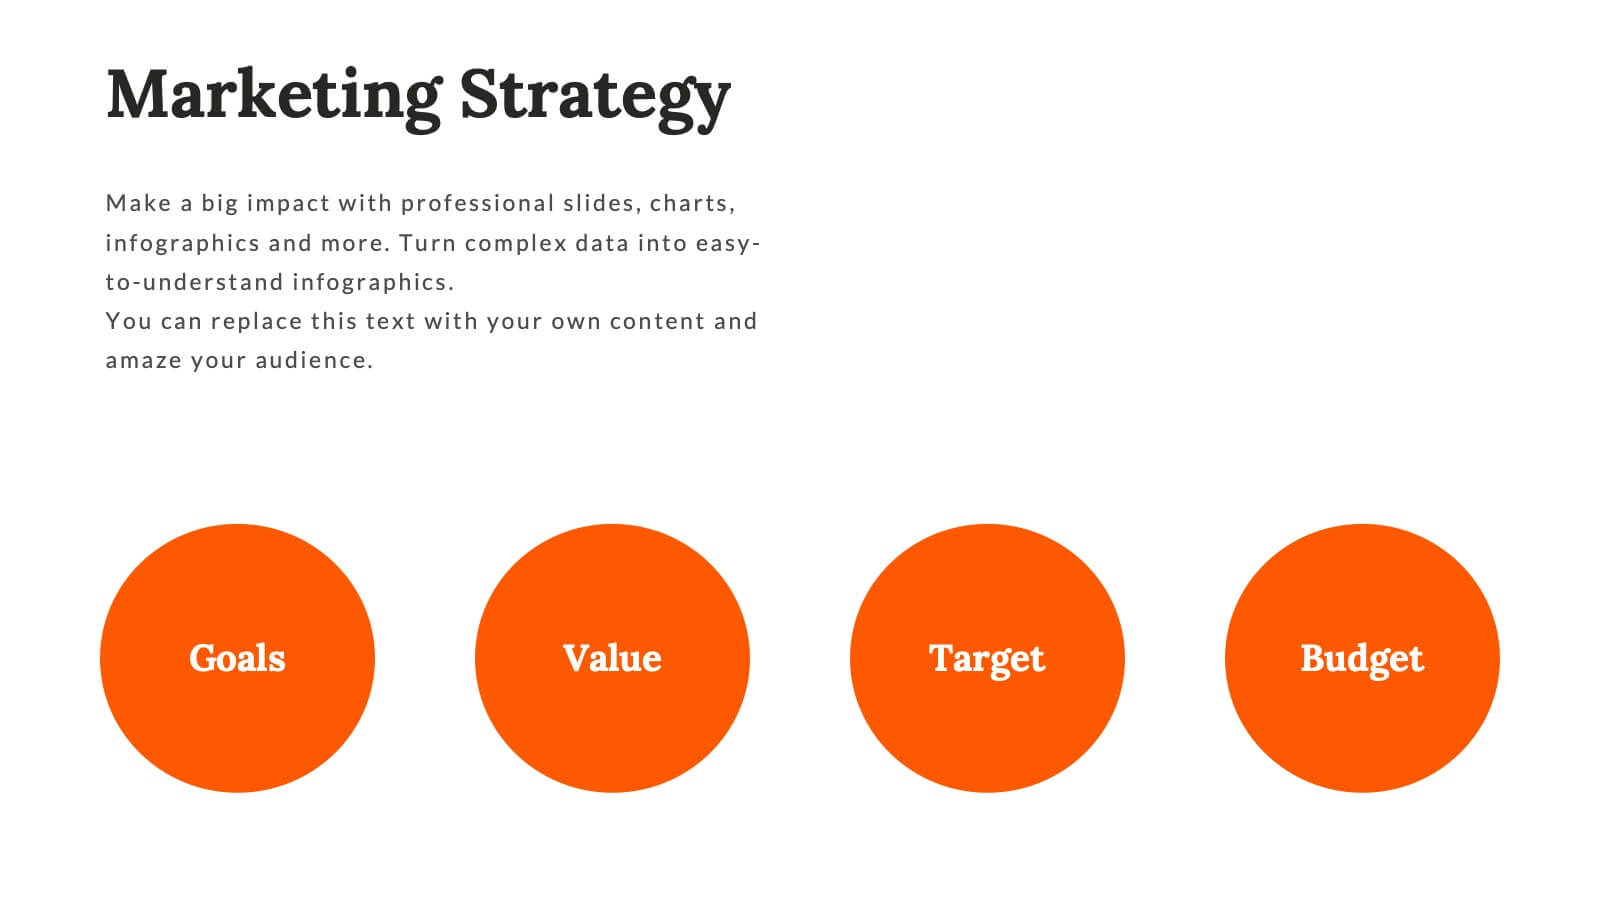
Business Value Proposition
Clearly communicate your brand’s core value with this quadrant-style slide, ideal for pitching key benefits, market differentiators, or service pillars. Designed for product managers, marketers, and business consultants. Fully editable in PowerPoint, Keynote, and Google Slides—customize icons, titles, and layout with ease.


20 slides
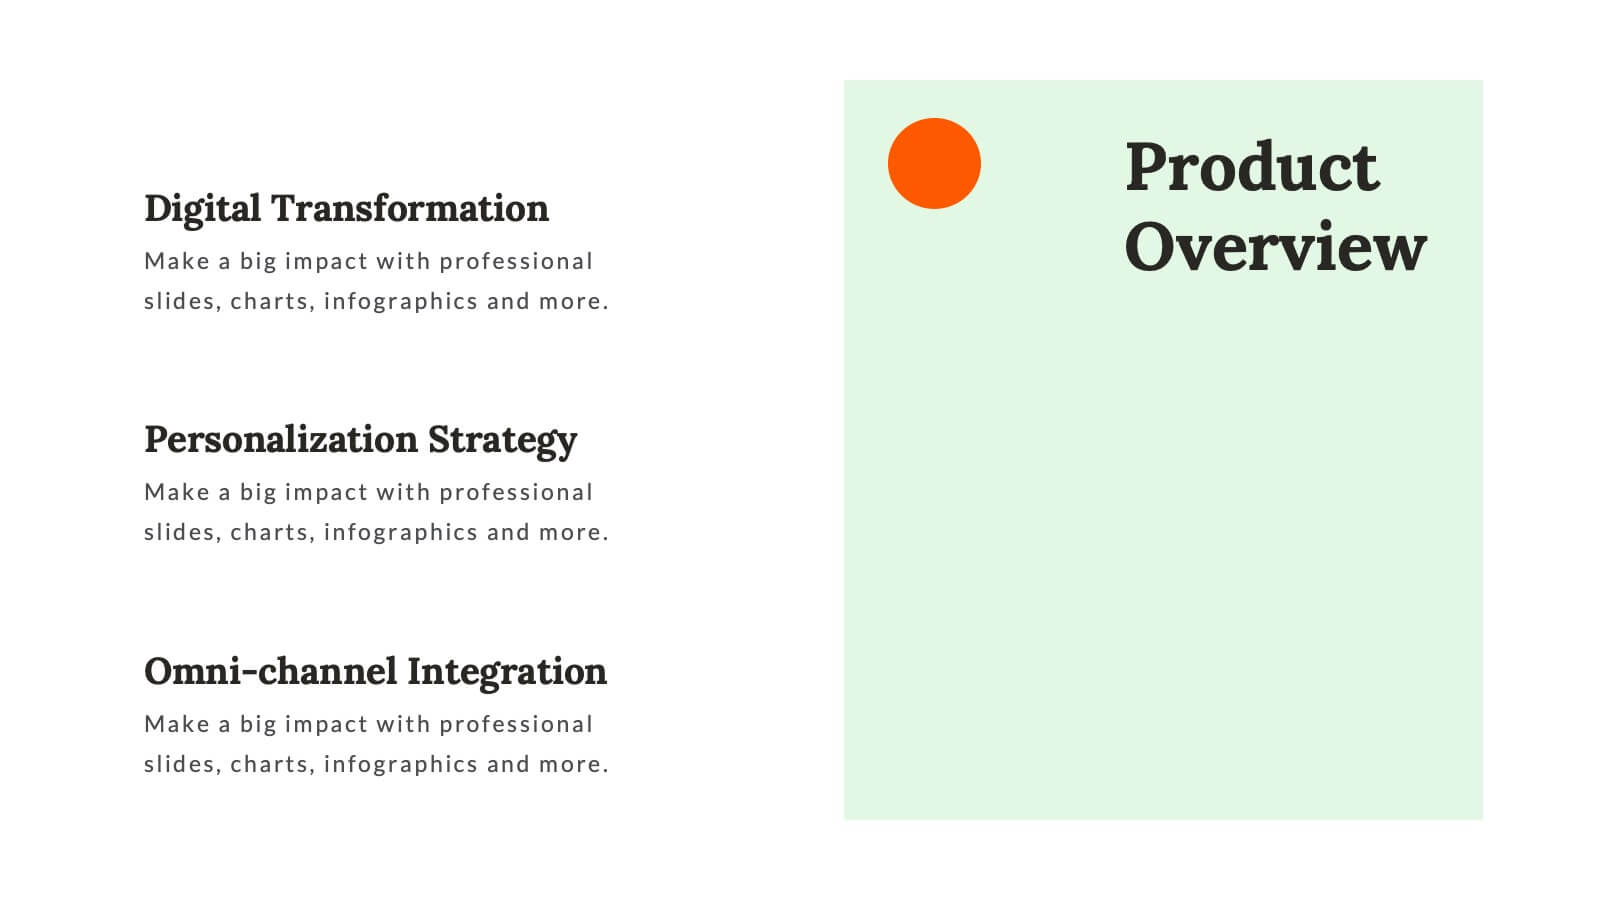
Unity New Product Proposal Presentation
Unveil your product strategy with this modern, comprehensive template! Highlight your company overview, product features, and unique selling proposition. Perfect for presenting market analysis, pricing strategy, and technical specifications. Ideal for product managers and developers. Compatible with PowerPoint, Keynote, and Google Slides.


6 slides
Clinical Research and Diagnostics Presentation
Showcase your research phases or diagnostic stages using this clean, capsule-themed layout. Perfect for illustrating clinical trial workflows, medical testing procedures, or pharmaceutical timelines. With six labeled sections and color-coded steps, it ensures clarity in communication. Fully customizable in PowerPoint, Keynote, and Google Slides for seamless integration into your presentations.


6 slides
Leadership Vision and Strategy Presentation
Present your organization’s goals with this leadership vision and strategy template, designed with a hierarchy graphic to represent team structure and growth. Perfect for strategic planning, leadership meetings, and corporate presentations. Fully editable in Canva, PowerPoint, or Google Slides, making it easy to customize colors, text, and layout to fit your brand.


4 slides
Logistics Chain and Delivery Map Presentation
Navigate global supply chains with ease using this dynamic shipping and delivery slide. Designed around a cargo ship visual, this infographic helps teams outline each stage of their logistics journey—from origin to destination. Ideal for supply chain updates, shipping plans, or logistics strategy meetings. Fully compatible with PowerPoint, Keynote, and Google Slides.


5 slides
Understanding Customer Needs with Empathy Map Presentation
Gain deeper customer insights with the Understanding Customer Needs with Empathy Map Presentation. This template simplifies user research by visually organizing customer thoughts, behaviors, and emotions into a clear layout. Perfect for UX teams, product designers, and marketers aiming to craft user-centric strategies. Fully editable in PowerPoint, Keynote, Canva, and Google Slides.


4 slides
Risk Assessment Matrix Presentation
Highlight and evaluate business uncertainties with this Risk Assessment Matrix Presentation. Featuring a clean grid layout and color-coded risk levels, this template allows you to map out potential risks by likelihood and impact. Use the customizable labels, percentages, and legend to make your analysis clear and actionable. Ideal for project managers, consultants, or strategy teams. Compatible with PowerPoint, Keynote, and Google Slides.