


Features
- 4 Unique slides
- Fully editable and easy to edit in Microsoft Powerpoint, Keynote and Google Slides
- 16:9 widescreen layout
- Clean and professional designs
- Export to JPG, PDF or send by email


Do you have any questions?
Recommend


10 slides
Six Sigma Process Improvement
Visualize each stage of the Six Sigma DMAIC methodology—Define, Measure, Analyze, Improve, and Control—with this circular diagram layout. Perfect for quality control meetings, workflow optimization, and training sessions. Fully customizable in PowerPoint, Keynote, and Google Slides.


7 slides
Agriculture Infographics Presentation Template
Our Agriculture Infographic template is a great way to present your information about the structure, process and procedures of agricultural. This template includes a set of slides with illustrations and charts that will help you make an eye-catching presentation in just minutes. This template has been designed for use in PowerPoint, and is well-suited for both personal and business use. This infographic template is a perfect choice for presenting the statistical data about agriculture, such as product and service, market share and revenue, production levels and other information.


26 slides
Kasra Presentation Template
Fitness is an important part of good health. It improves your quality of life and may keep you from getting sick by helping to strengthen your immune system, prevent heart disease and reduce the risk of diabetes and much more. The Kasra template will help you deliver your message with an impact. Whether you're selling your product, promoting an event, or creating a landing page, this template features the necessary components to capture your audience's attention. This provides you with a powerful platform to engage others, illustrate key messages and demonstrate deep insight into an issue.


7 slides
Business Continuity Plan Infographic Presentation
A well-written business plan helps entrepreneurs focus on their next steps, anticipate challenges and overcome them before they occur. This template will guide you through the process of writing a professional, successful and effective business plan. This template design is highly visual, vibrant and engaging with neutral colors. It uses the best parts of a business plan, such as graphs and charts, to visualize your ideas. This business plan infographic is a sharp visual aid for investors, partners, board members and anyone else who needs to know more about what you do and how you plan to grow.


6 slides
5-Year Financial Forecast Slide Presentation
Show your long-term growth with a clean, visual touch that makes numbers easy to follow and goals clear to everyone. This modern layout highlights yearly progress using engaging icons and percentage indicators, perfect for financial reports or investor decks. Fully compatible with PowerPoint, Keynote, and Google Slides for seamless editing.


23 slides
Pulse Project Status Report Presentation
This vibrant and sleek report template delivers a powerful visual impact while ensuring clear communication. Perfect for tracking progress, reviewing key metrics, and analyzing client feedback, it covers everything from project highlights to competitor insights. Compatible with PowerPoint, Keynote, and Google Slides, this template elevates every report presentation with professional flair!


6 slides
Supply Chain Risk Infographic
Supply chain risk refers to the potential disruptions, vulnerabilities, and uncertainties that can negatively impact the flow of goods, services, and information within a supply chain network. This infographic aims to provide a clear overview of the different types of risks that can disrupt the supply chain and the strategies to mitigate those risks effectively. This infographic is designed to help businesses and supply chain managers understand and manage potential vulnerabilities in their supply chains. This template is fully customizable and compatible with Powerpoint, Keynote, and Google Slides.


8 slides
Meet the Team Presentation
Showcase your team effectively with our "Meet the Team Presentation" template. This sleek design features personalized cards for each team member, displaying their photo, name, and contact details on a visually appealing, color-coded background. Perfect for onboarding, company introductions, or team-building presentations, this template enhances recognition and cohesion. The distinct colors can be used to signify different roles or departments, making it easy to identify team dynamics at a glance. Compatible with PowerPoint, Keynote, and Google Slides, it’s an essential tool for any organization aiming to present their team in a professional and engaging manner.


8 slides
International Marketing Infographic
International Marketing refers to the strategies and activities undertaken by businesses to promote and sell their products or services in markets outside of their home country. This infographic template highlights key aspects of international marketing strategies and best practices. It is designed to help businesses understand the complexities and opportunities of marketing products or services in global markets. This provides an overview of international marketing concepts and strategies. Compatible with Powerpoint, Keynote, and Google Slides. This template is suitable for businesses aiming to expand their reach and succeed in the global marketplace.


20 slides
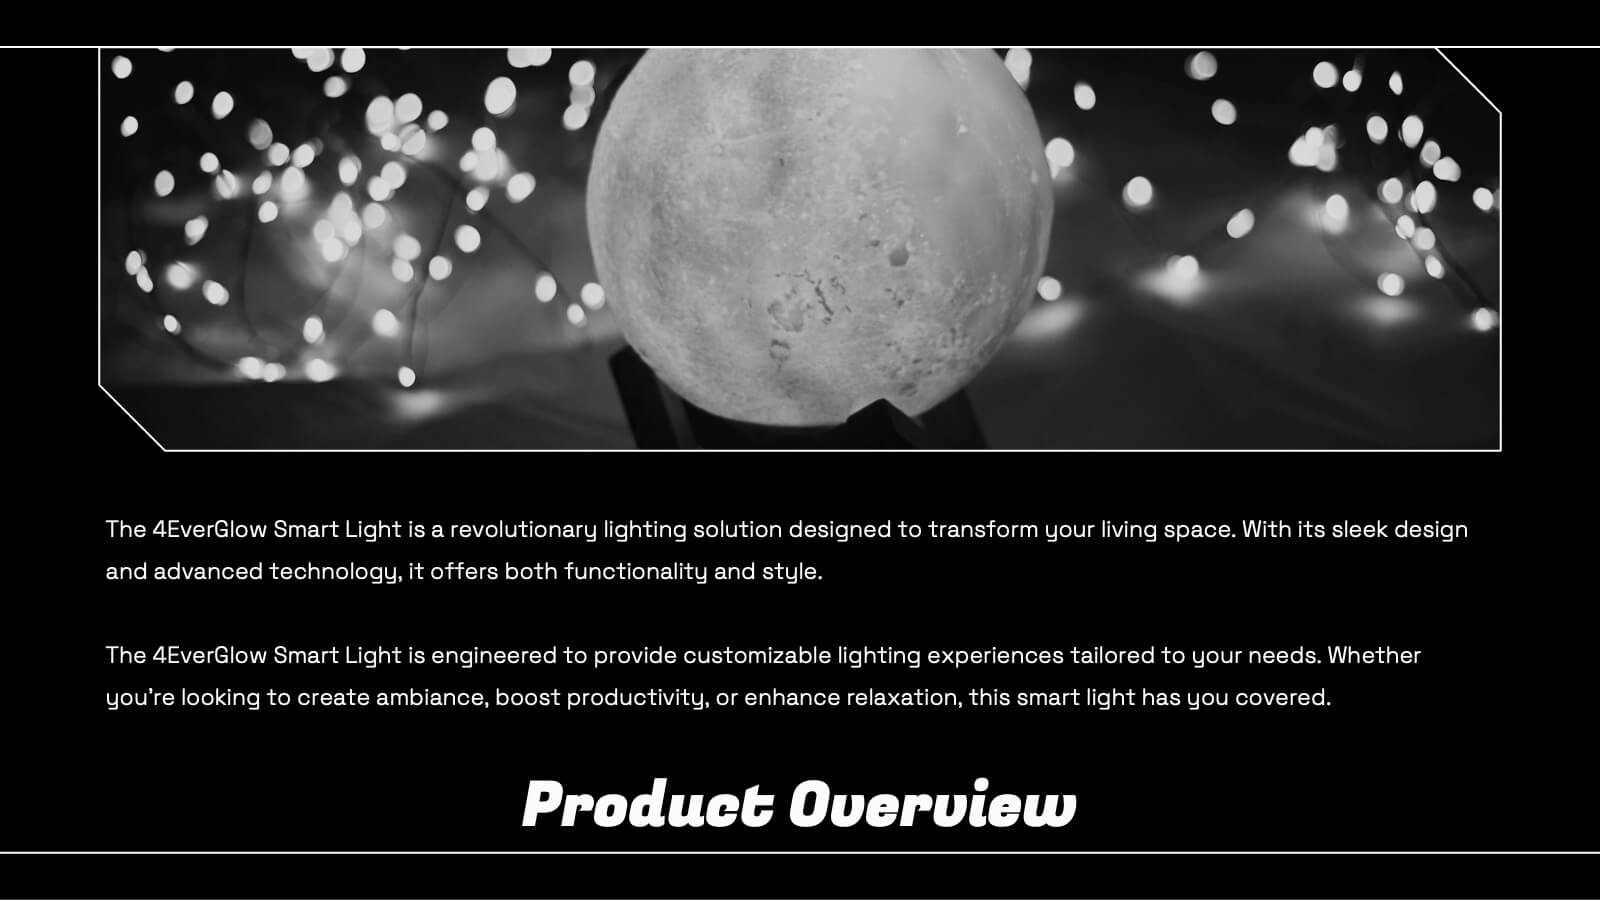
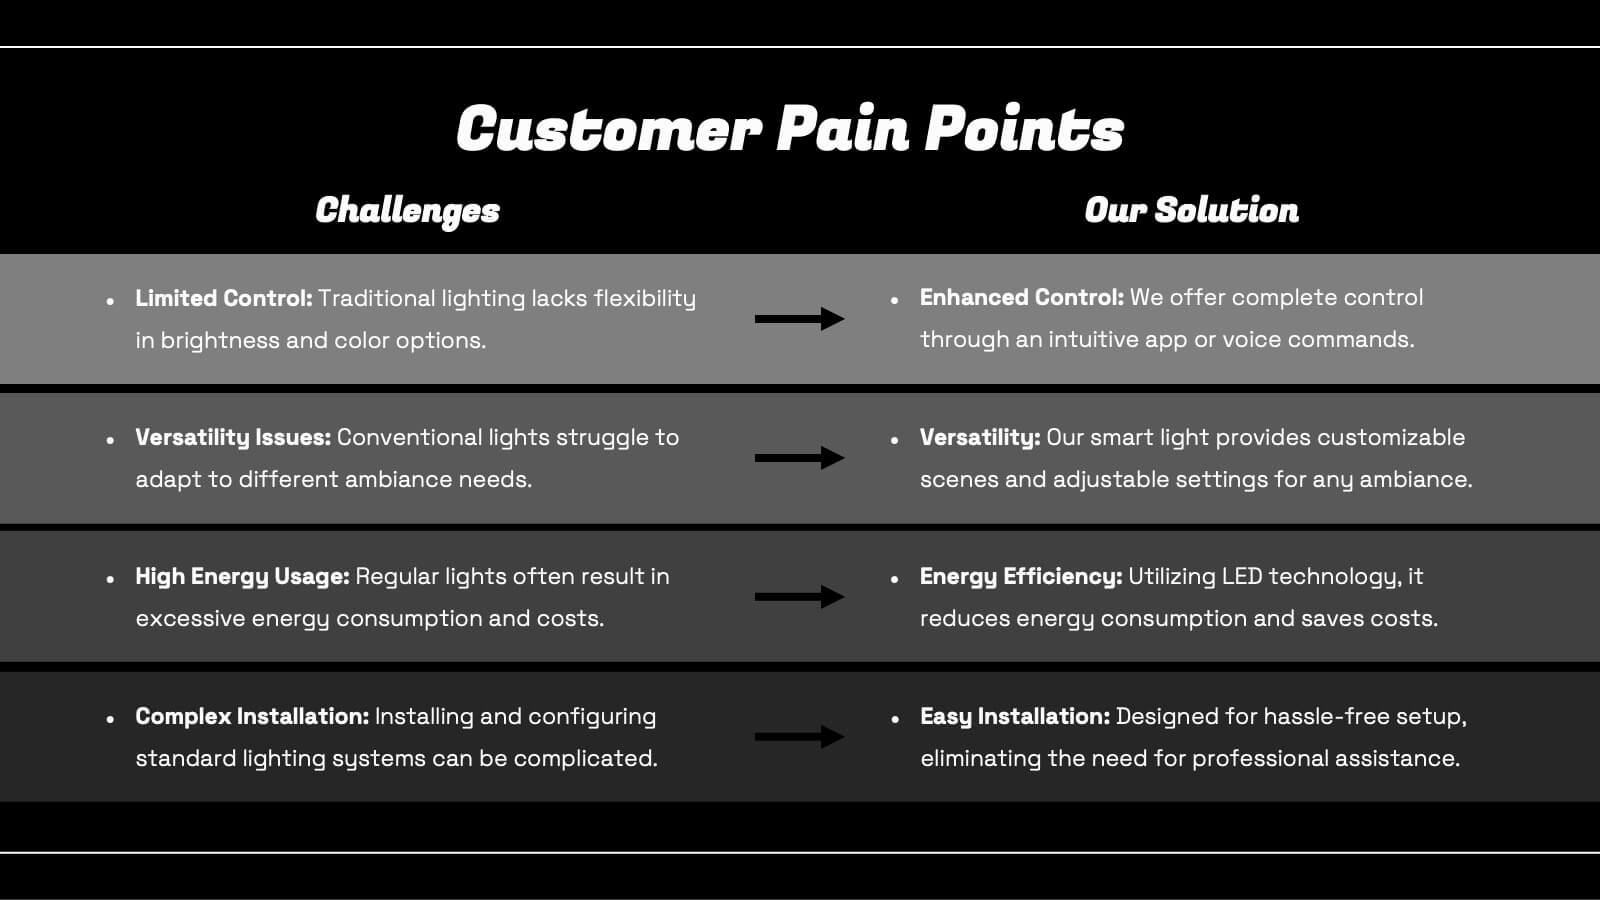
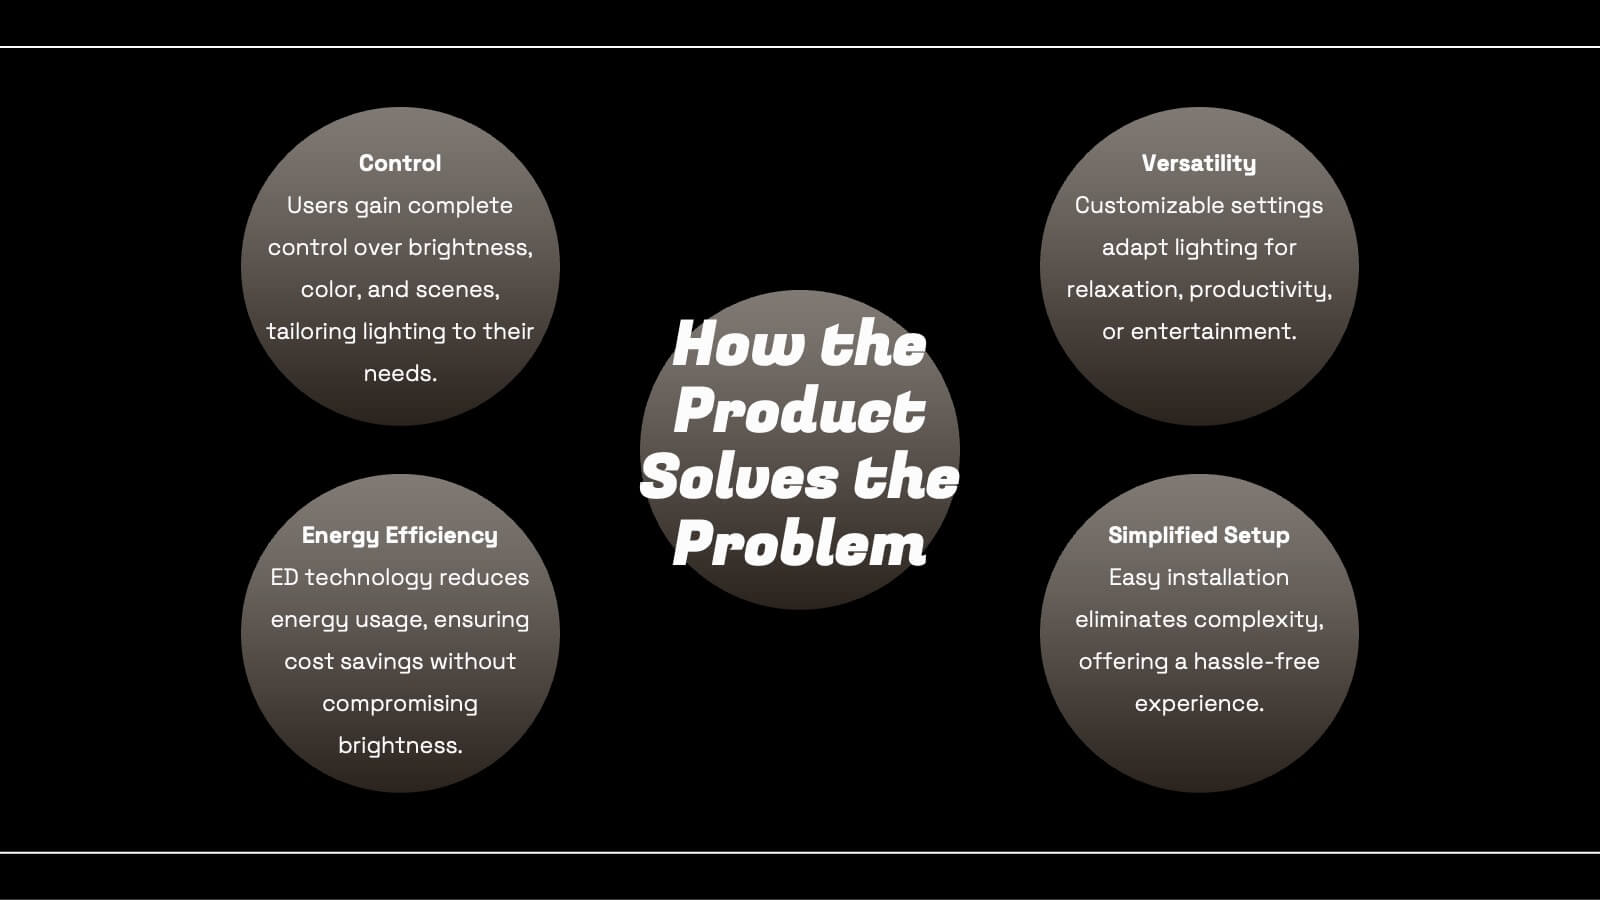
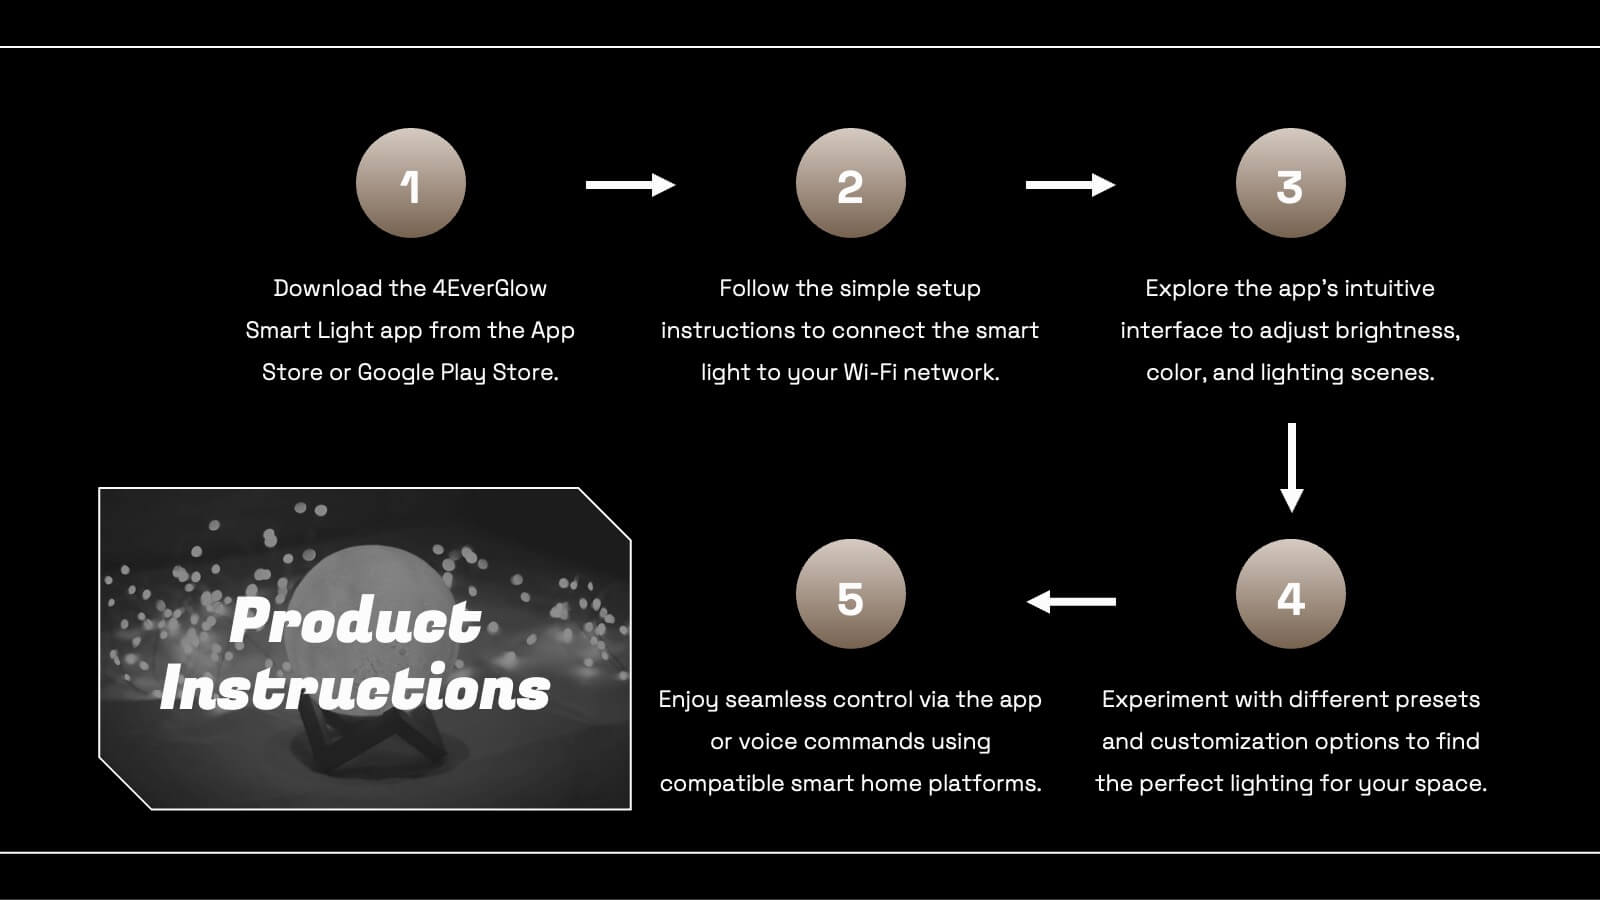
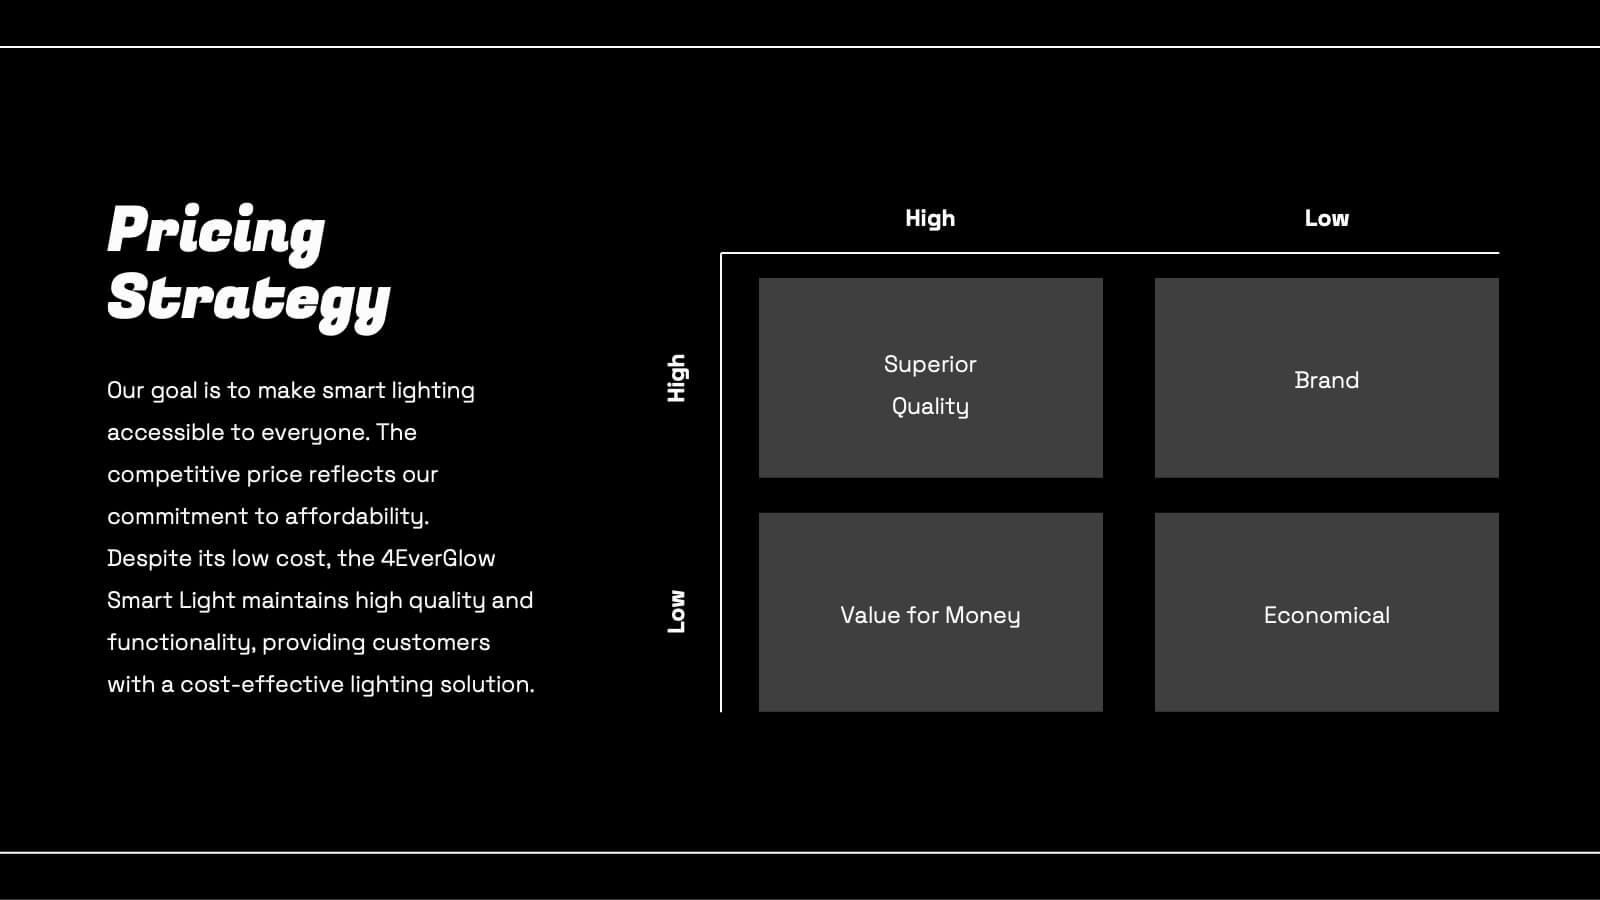
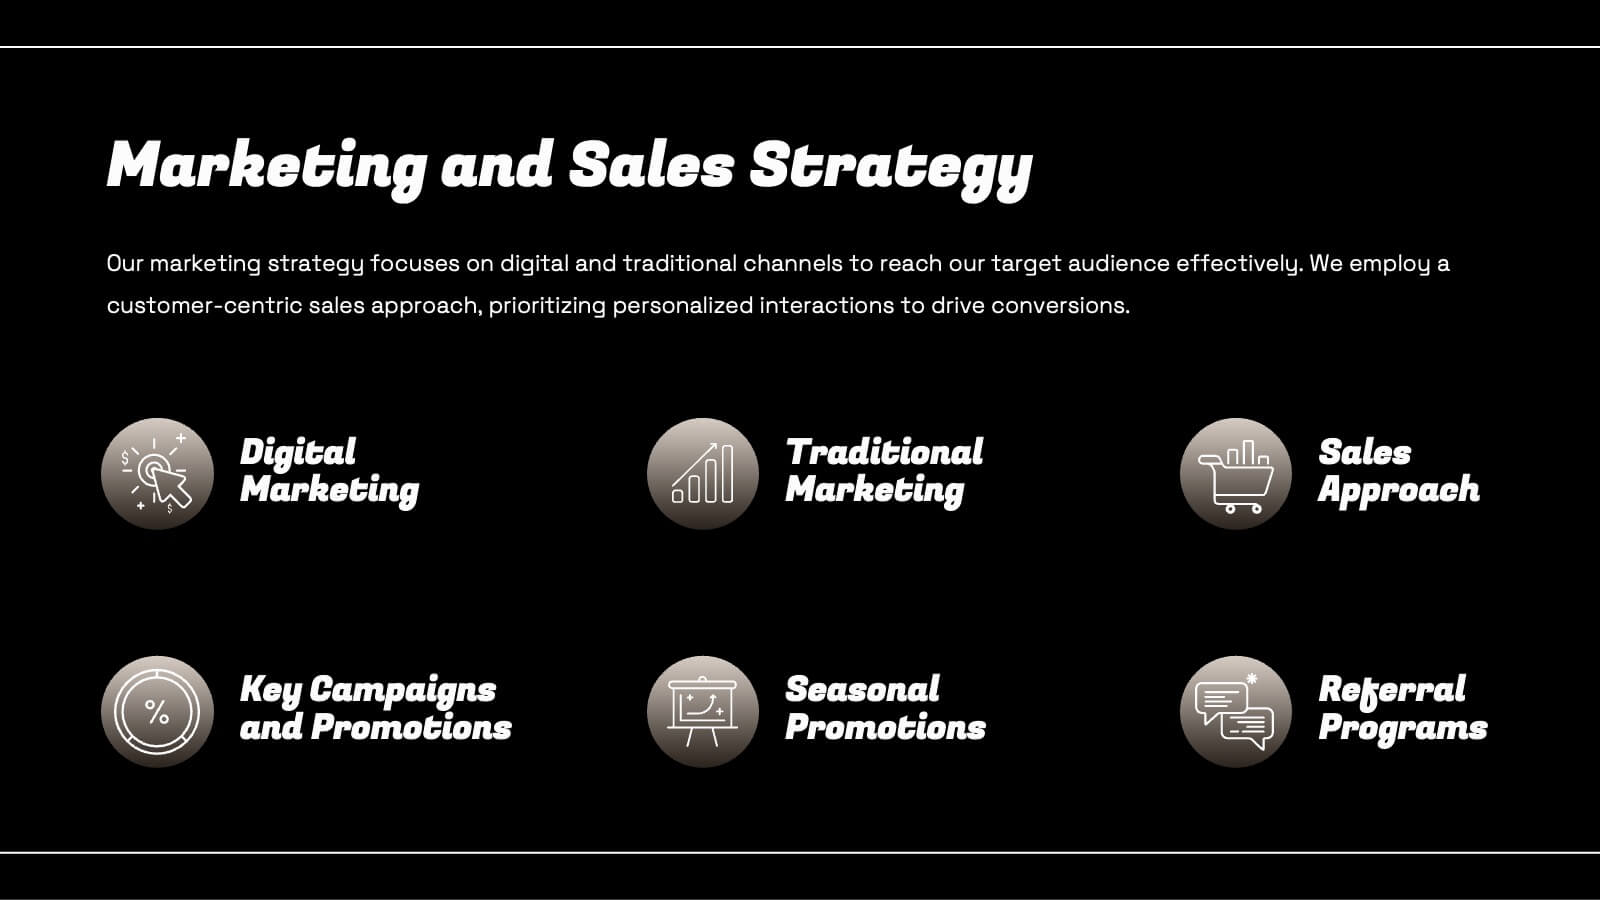
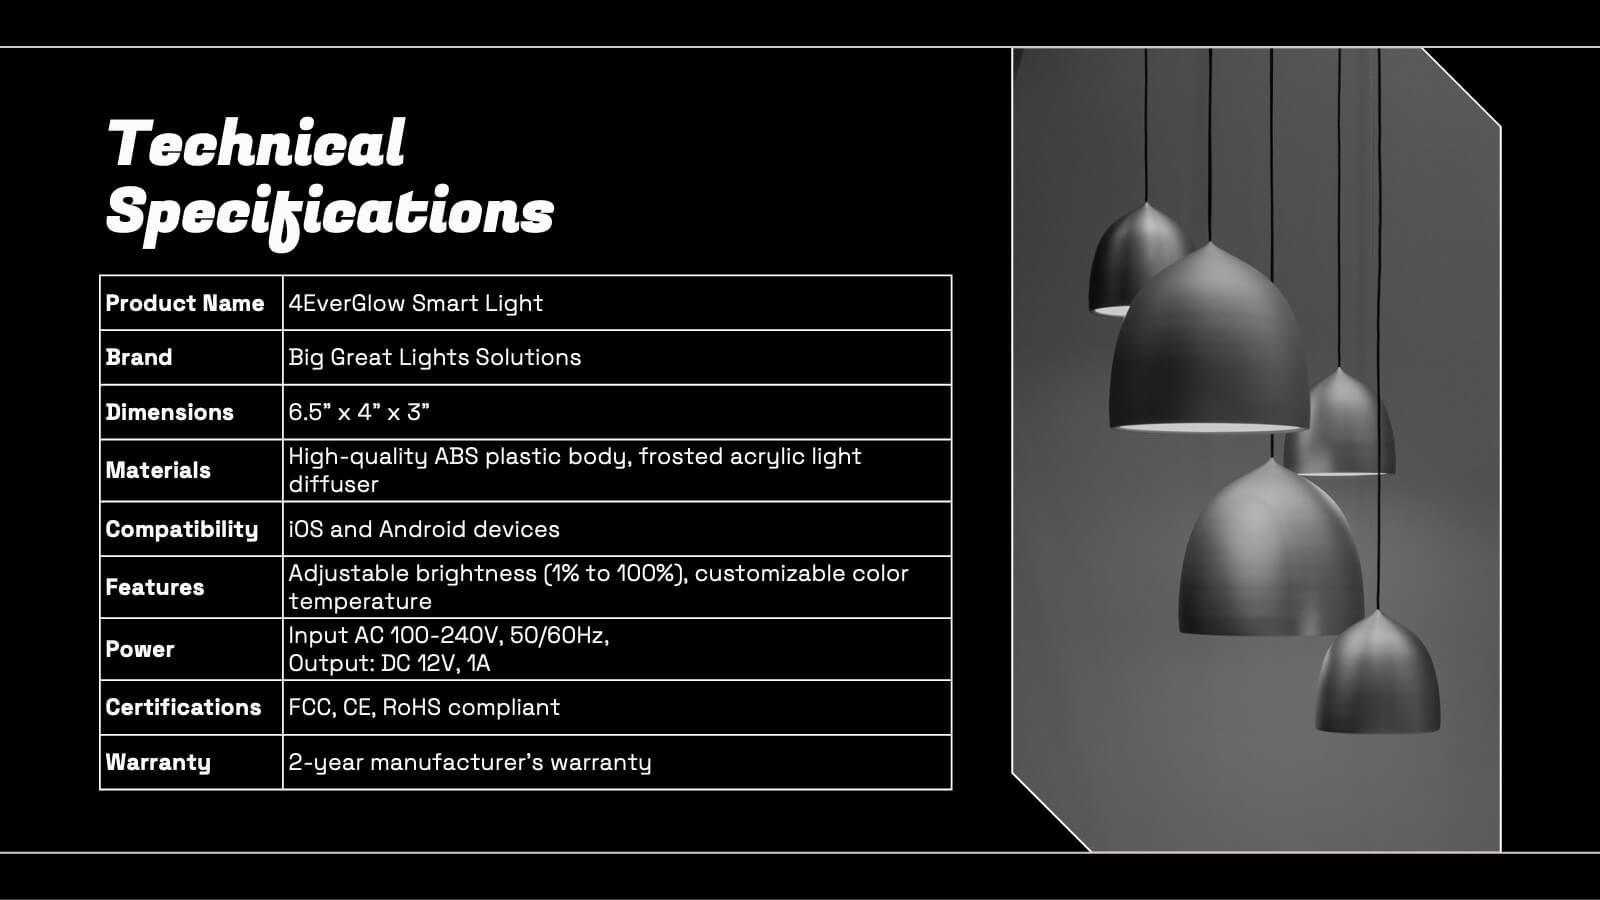
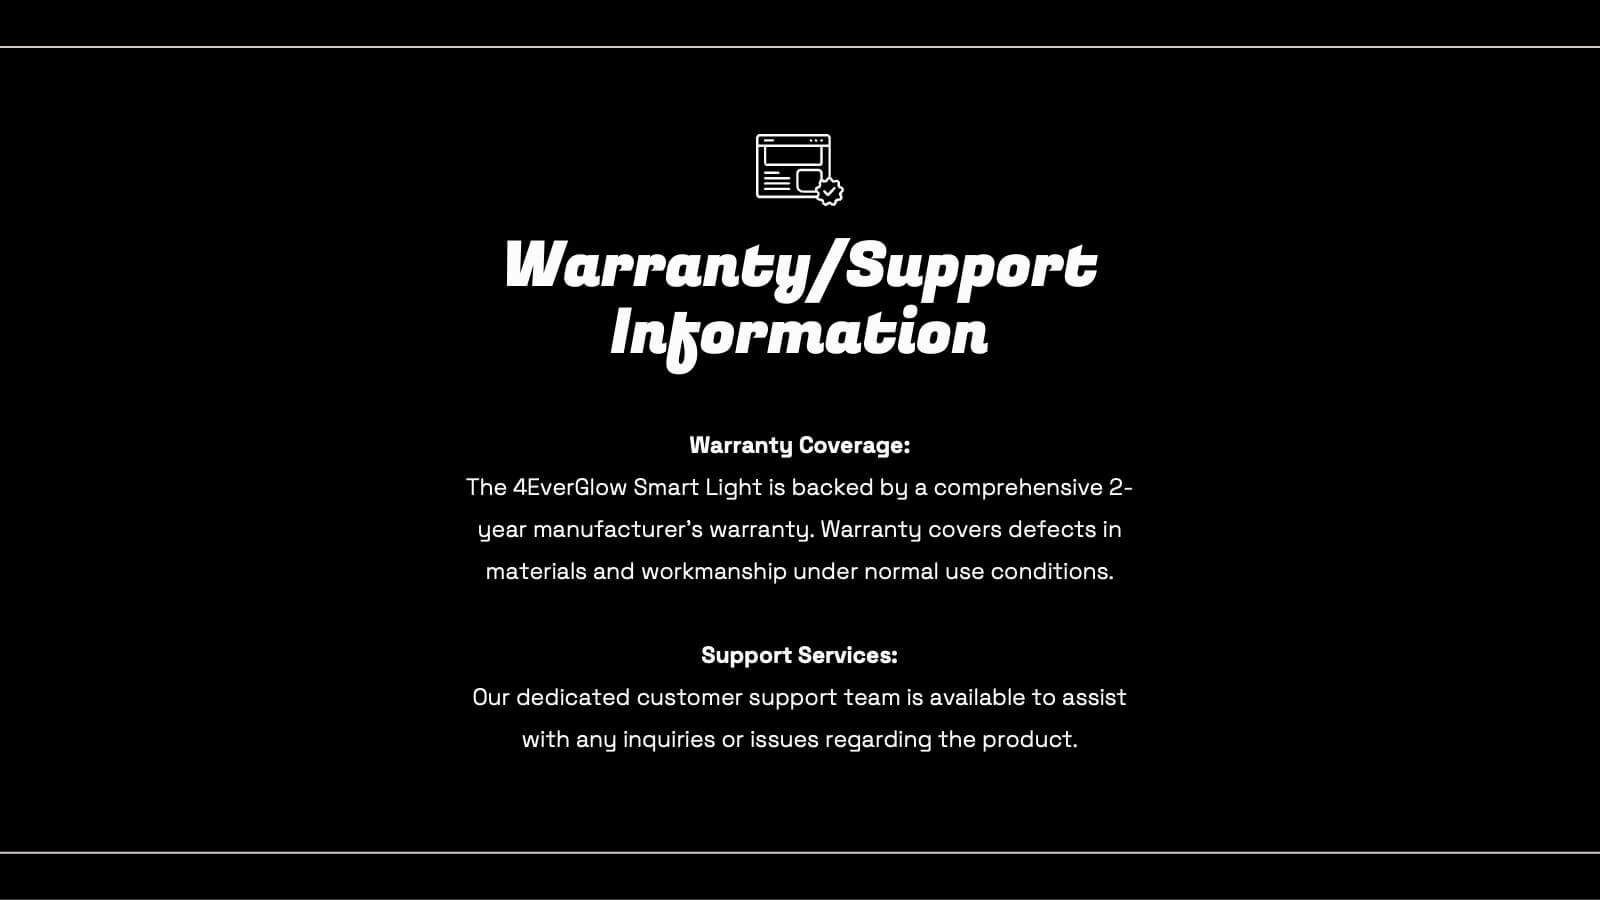
Smart Light Product Presentation
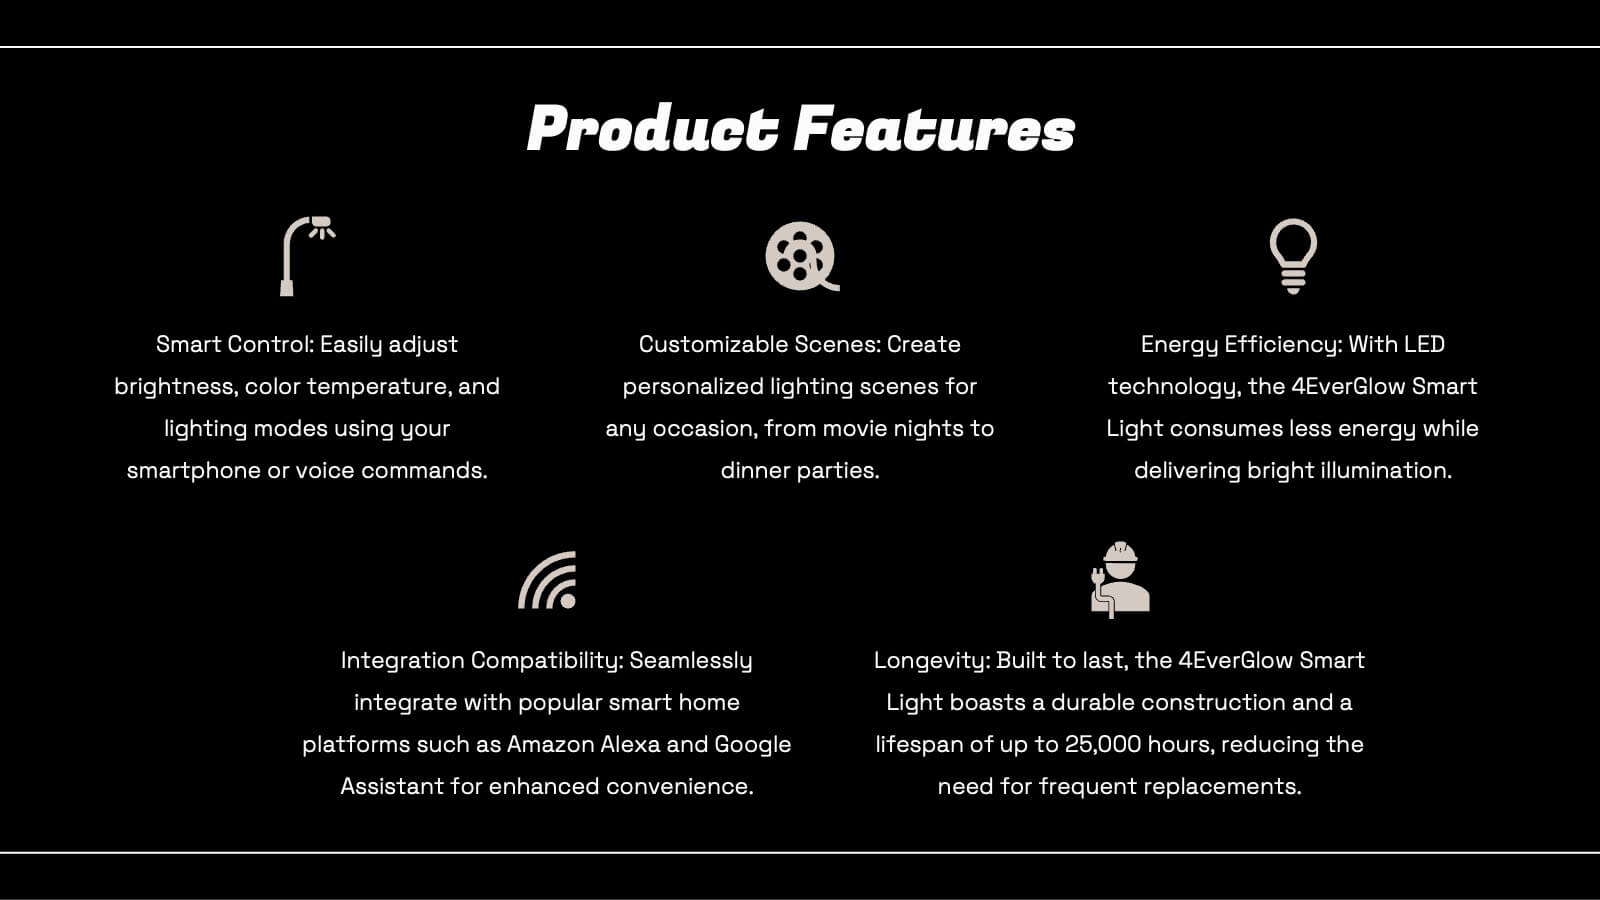
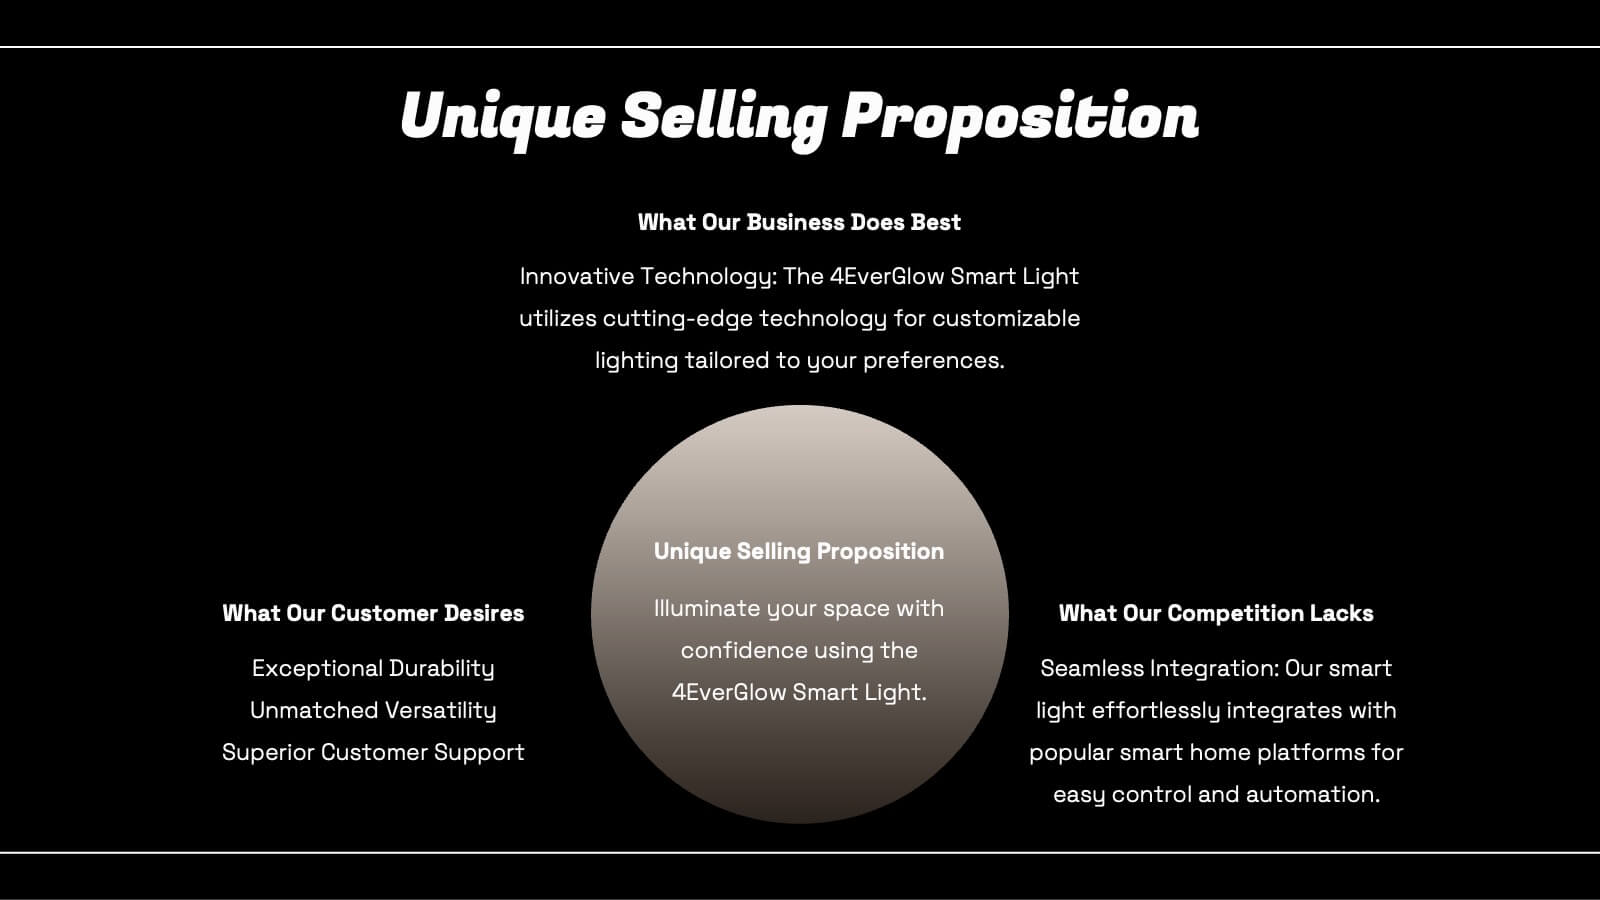
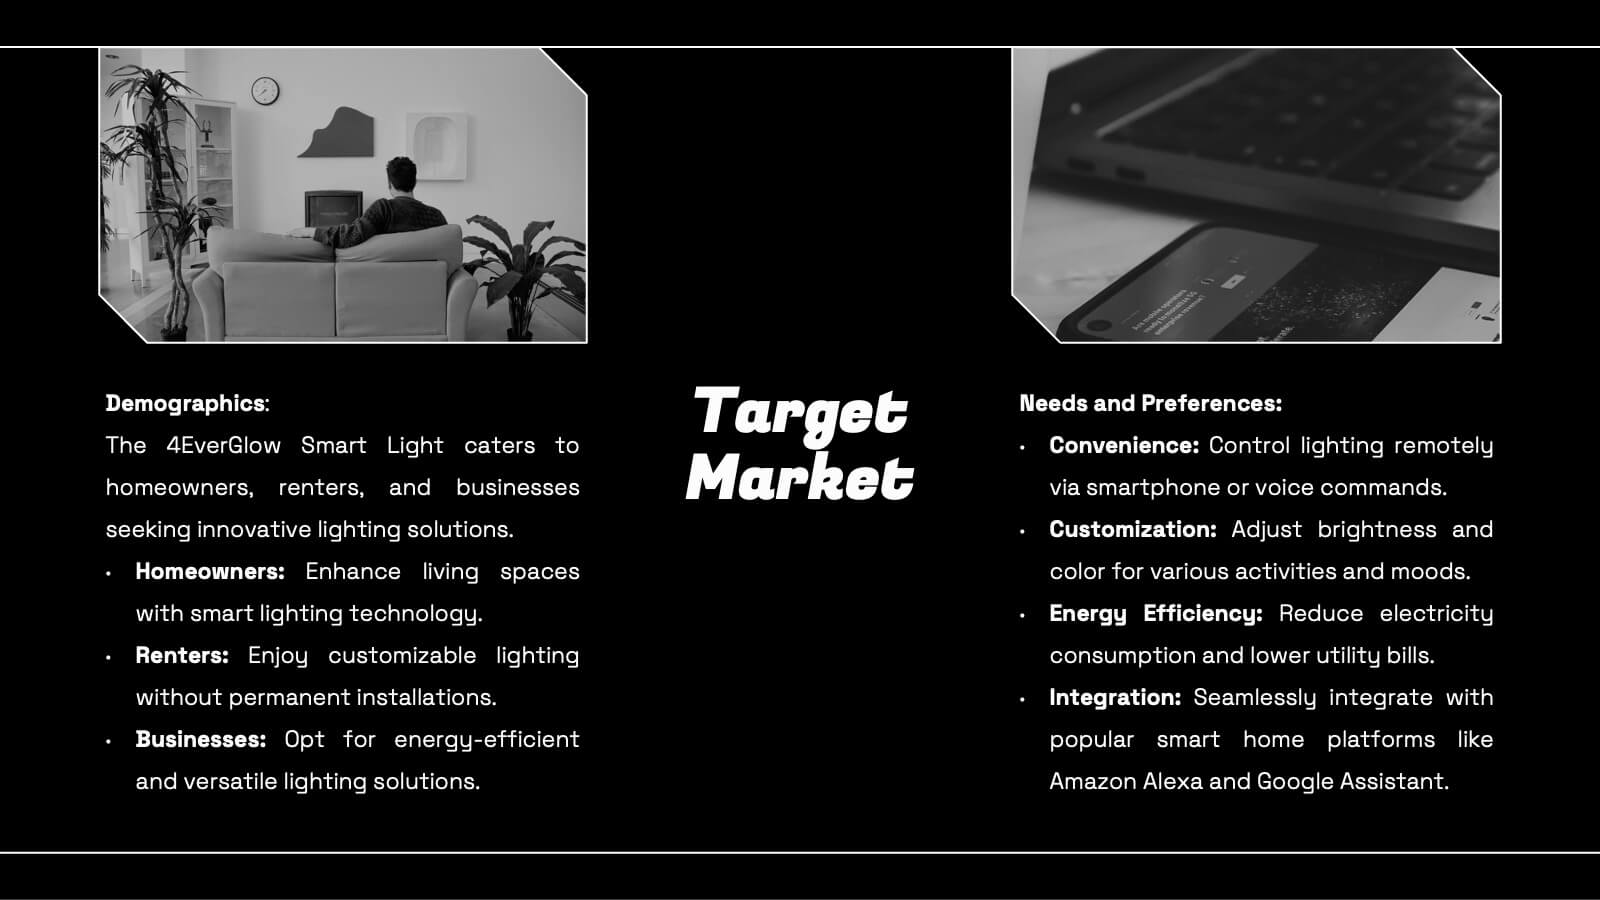
Enhance your product presentations with this Smart Lighting template. Designed for clarity and aesthetic appeal, it includes slides detailing product features, market analysis, technical specifications, and pricing strategies. Ideal for tech products, it's compatible with PowerPoint, Keynote, and Google Slides, ensuring broad accessibility and ease of use.


5 slides
Cryptocurrency Investment Overview Presentation
Capture the excitement of digital investing with this clean, modern layout designed to visualize market performance, asset insights, and portfolio trends. Perfect for financial analysts, startups, and educators, it simplifies complex data into engaging visuals. Fully compatible with PowerPoint, Keynote, and Google Slides for seamless editing and presentation delivery.


8 slides
Tourism Strategy and Location Guide Presentation
Planning a strategy that inspires wanderlust? This sleek presentation template helps organize global tourism goals with location-based insights, iconic visuals, and easy-to-edit layout sections. Perfect for destination marketing, regional analysis, or travel business pitches. Fully compatible with PowerPoint, Keynote, and Google Slides for effortless editing and impactful delivery.


6 slides
Creating Effective Buyer Persona Strategies Presentation
Present your audience research with clarity using this buyer persona strategy slide. Designed with a radial layout of five icons leading to a central profile, this template helps communicate key traits, behaviors, and preferences. Ideal for marketing teams, branding workshops, and product strategy sessions. Easily customizable in PowerPoint, Keynote, and Google Slides.


21 slides
Sol Photography Portfolio Template Presentation
Showcase your creative work with this vibrant photography portfolio presentation template. It features sections for introductions, project descriptions, and accolades, making it perfect for photographers looking to display their style and collaborations. Compatible with PowerPoint, Google Slides, and Keynote, this template is designed to impress viewers with its dynamic layout and bright color scheme.


5 slides
Diverse List Infographics
Diverse list refers to a compilation or collection of items that include a wide range of diverse elements. These infographic templates showcases a diverse range of categories and topics in a concise format. The infographic is designed to present information in a visually stimulating way, allowing viewers to easily navigate and understand the diverse list being presented. The infographics organizes the lists into categories or sections, so the viewers can identify and locate specific items of interest. The categories are represented by visually distinct sections and color-coded tabs or icons that provide a cue for each category.


7 slides
Pillar Distribution Infographic
Discover a striking visual representation of data with the pillar distribution Infographic. Bathed in shades of blue, white, and green, this template masterfully showcases the core foundations of any topic in a 'pillar' format. Specifically tailored for business analysts, educators, and marketers, the infographic aids in simplifying dense information. With its crisp graphics, bespoke icons, and dedicated image placeholders, conveying your insights becomes an engaging narrative experience. Its versatility ensures smooth integration with PowerPoint, Keynote, and Google Slides, transforming any presentation into a captivating visual story.


26 slides
Cassanra Presentation Template
Cassanra is a bold, professional template with a retro look. Its ravishing, modern aesthetic will stand out and grab your attention, while detailed design elements keep it readable. Packed with features like charts, timelines, and easy to edit text blocks, Cassanra is perfect for businesses as well as personal use. A mixture of bold colors are used to help keep the look appealing and easy to read. This template comes with a large amount of features from charts, timelines and an easy to edit text this template is perfect for businesses seeking to make an impression on their audience.