


Features
- 5 Unique slides
- Fully editable and easy to edit in Microsoft Powerpoint, Keynote and Google Slides
- 16:9 widescreen layout
- Clean and professional designs
- Export to JPG, PDF or send by email


Do you have any questions?
Recommend


10 slides
Profitability and Cost Analysis
Streamline your financial storytelling with this interlinked diagram template. Designed for business consultants, CFOs, and analysts, it helps visualize cost components and profit drivers across five stages. Each segment is clearly labeled and color-coded for easy comprehension. Fully customizable in PowerPoint, Keynote, and Google Slides.


5 slides
Regional Development in Oceania Map Presentation
The Regional Development in Oceania Map template provides a comprehensive visualization of growth and development metrics across various regions in Oceania. This template is designed to aid in presenting demographic data, economic indicators, or development status in a clear, easily understandable format. It's suitable for reports, presentations, and educational materials. Compatible with PowerPoint, Keynote, and Google Slides.


5 slides
Oil Industry Trends Infographics
The oil industry, also known as the petroleum industry, is a crucial sector of the global economy that involves exploration, production, refining, and distribution of petroleum products. These infographic templates are designed to showcase key trends and insights in the oil industry. They aims to present complex information in a clear and visually appealing manner, making it easy for your viewers to grasp important concepts and trends in the industry. This is perfect for anyone interested in understanding the trends and dynamics shaping the oil industry. Compatible with Powerpoint, Keynote, and Google Slides.


7 slides
Compliance Gap Analysis Infographic
Navigate the complexities of organizational compliance with our compliance gap analysis infographic. Using a vibrant palette of orange, white, and green, this infographic elucidates the differences between current compliance practices and desired standards. Specifically designed for business analysts, compliance officers, and risk managers, this template is an invaluable tool to identify, analyze, and bridge compliance-related gaps. With its fun yet informative style, communicating these insights becomes more engaging and understandable. This infographic is ready for integration with PowerPoint, Keynote, and Google Slides, ensuring smooth presentations across various platforms.


7 slides
Tables of Content Infographic Presentation Template
A table of contents infographic can serve as a visual representation of the content outline and help to convey the overall structure and organization of the information. This template displays the headings and subheadings of the document, along with the page numbers or slide numbers, in an easy-to-follow format. The purpose of our table of contents infographic template is to provide an overview of the content and help you navigate the presentation more efficiently. It is often used in academic papers, reports, magazines, and books, and can also be used in digital documents and presentations.


6 slides
Structured Table of Content Layout Presentation
Organize your presentation with clarity using this Structured Table of Content Layout. Ideal for overviews, agendas, or segmented discussions, this template features clean typography, icons, and a photo section. Fully editable in PowerPoint, Keynote, and Google Slides—perfect for professional reports, project briefs, or pitch decks that need clear navigation.
23 slides
Zirconium Strategic Planning Report Presentation
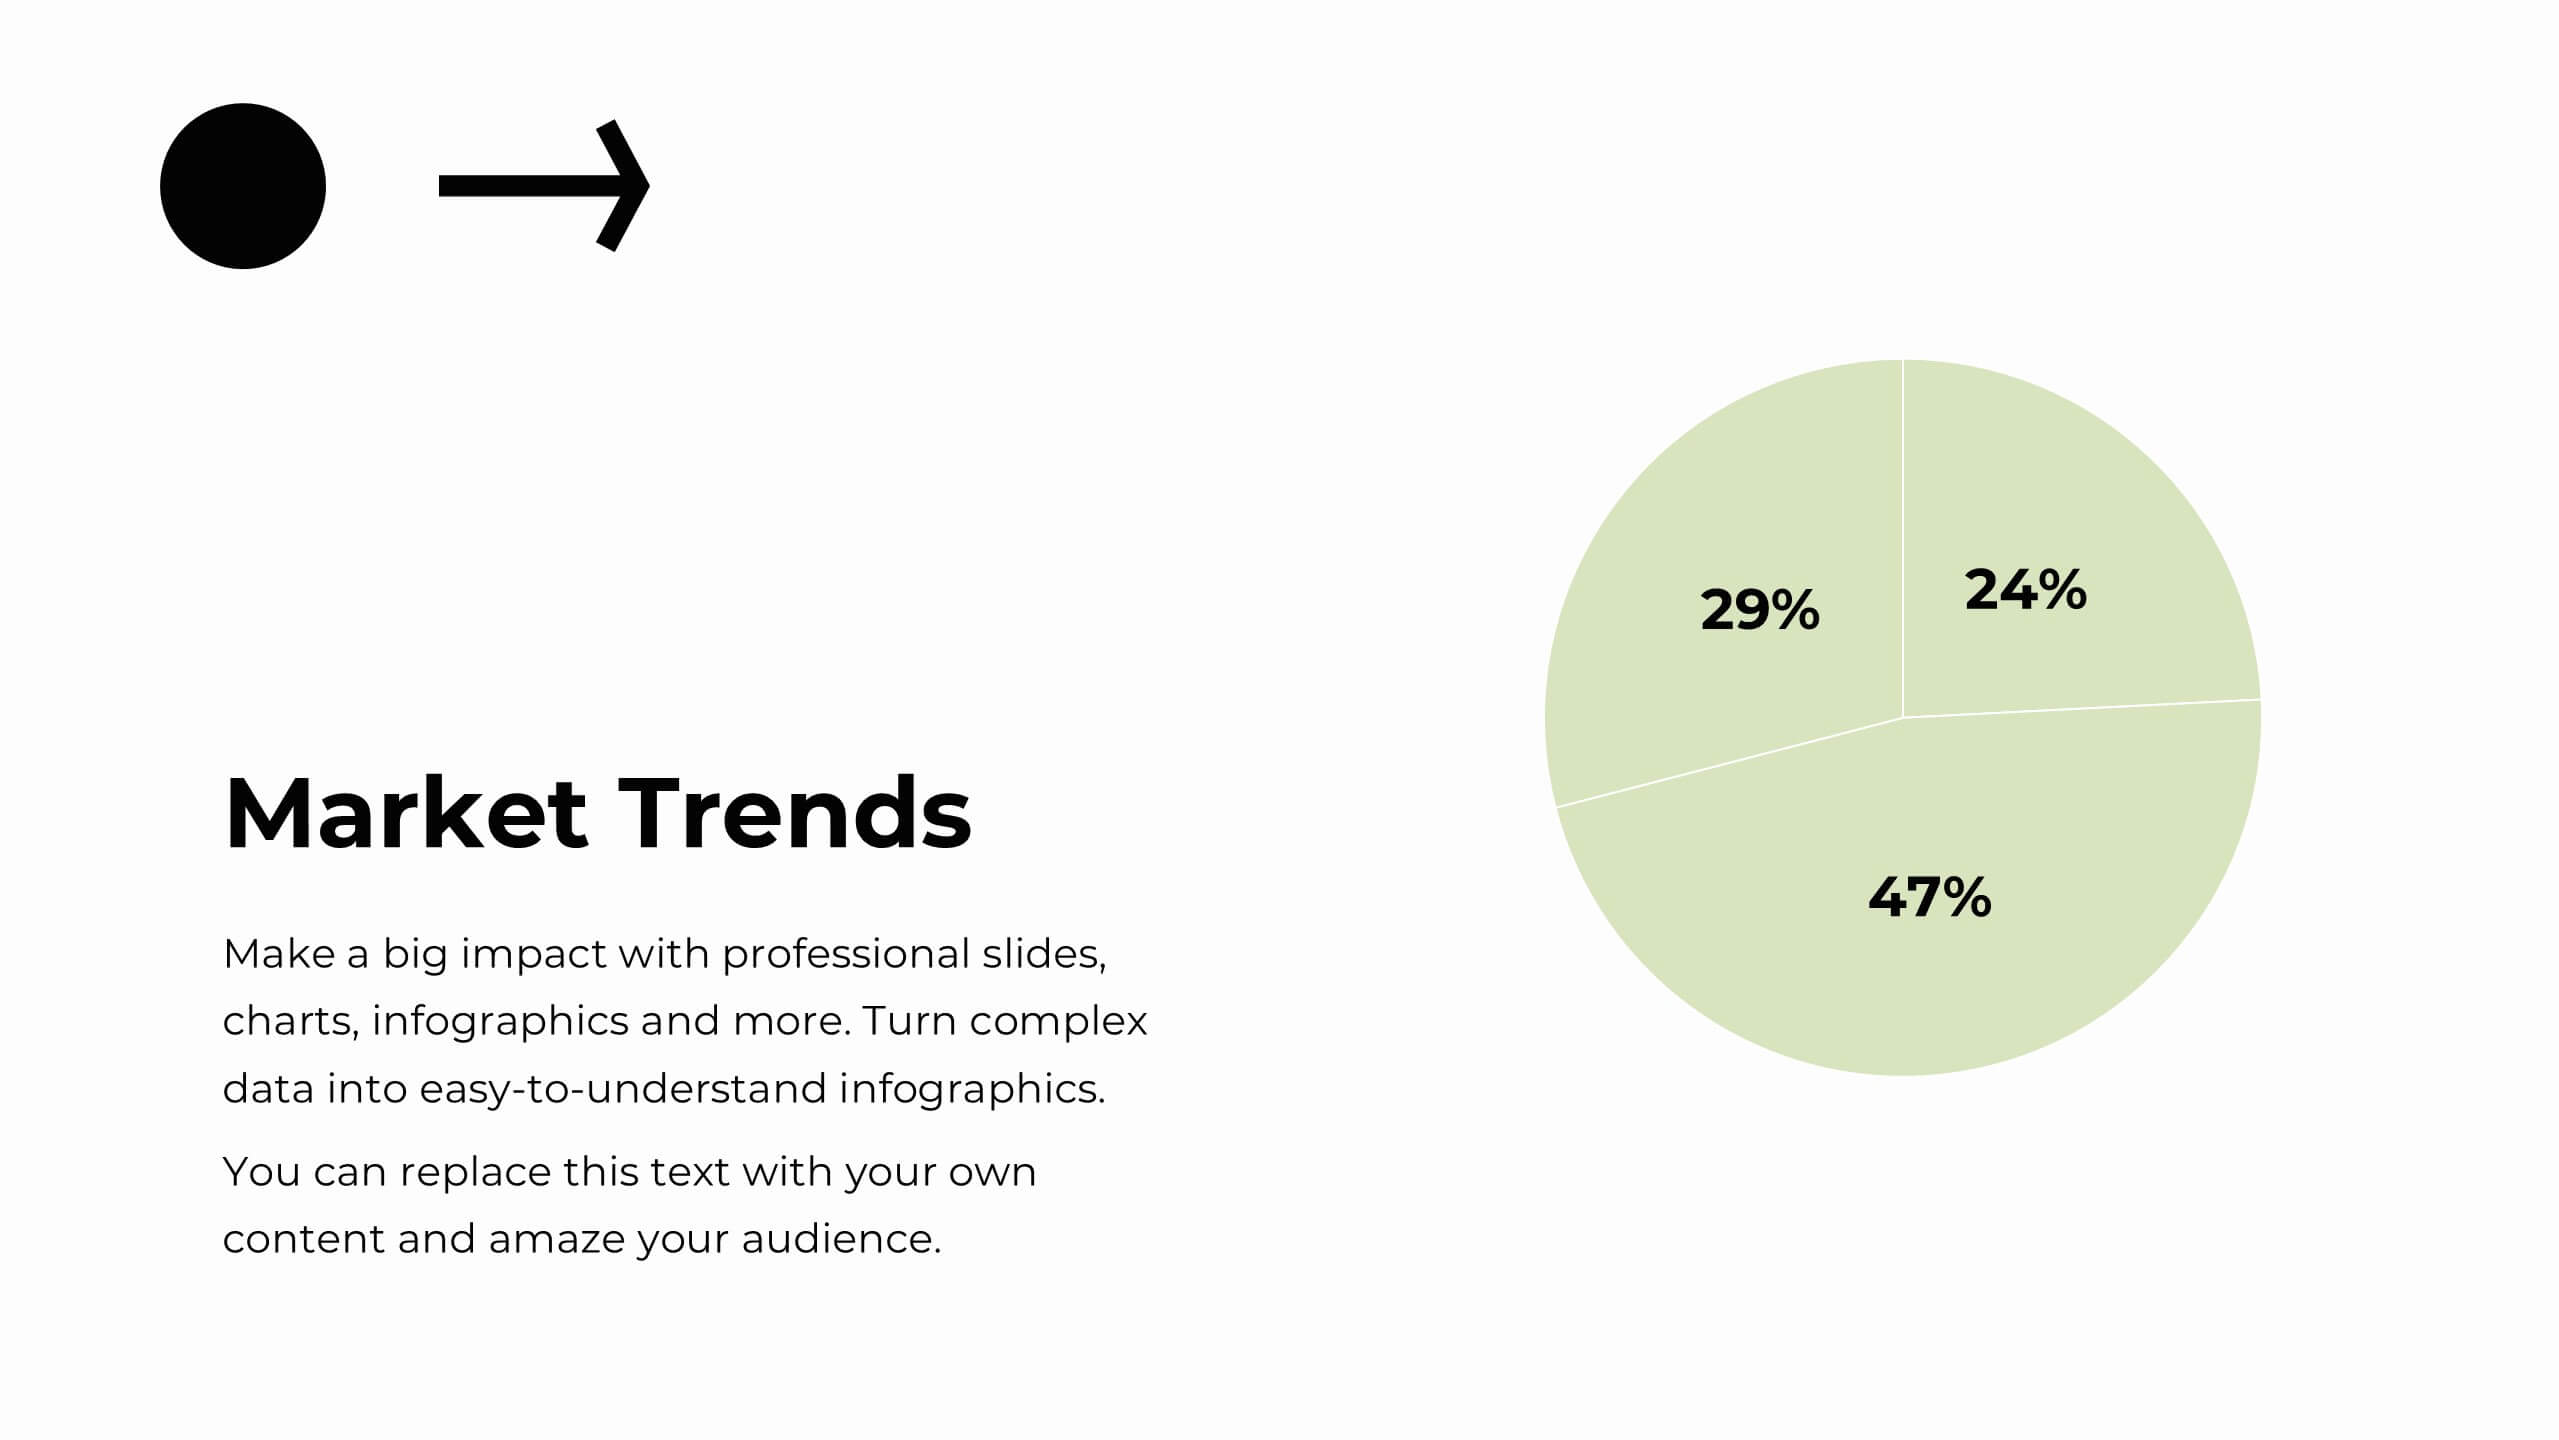
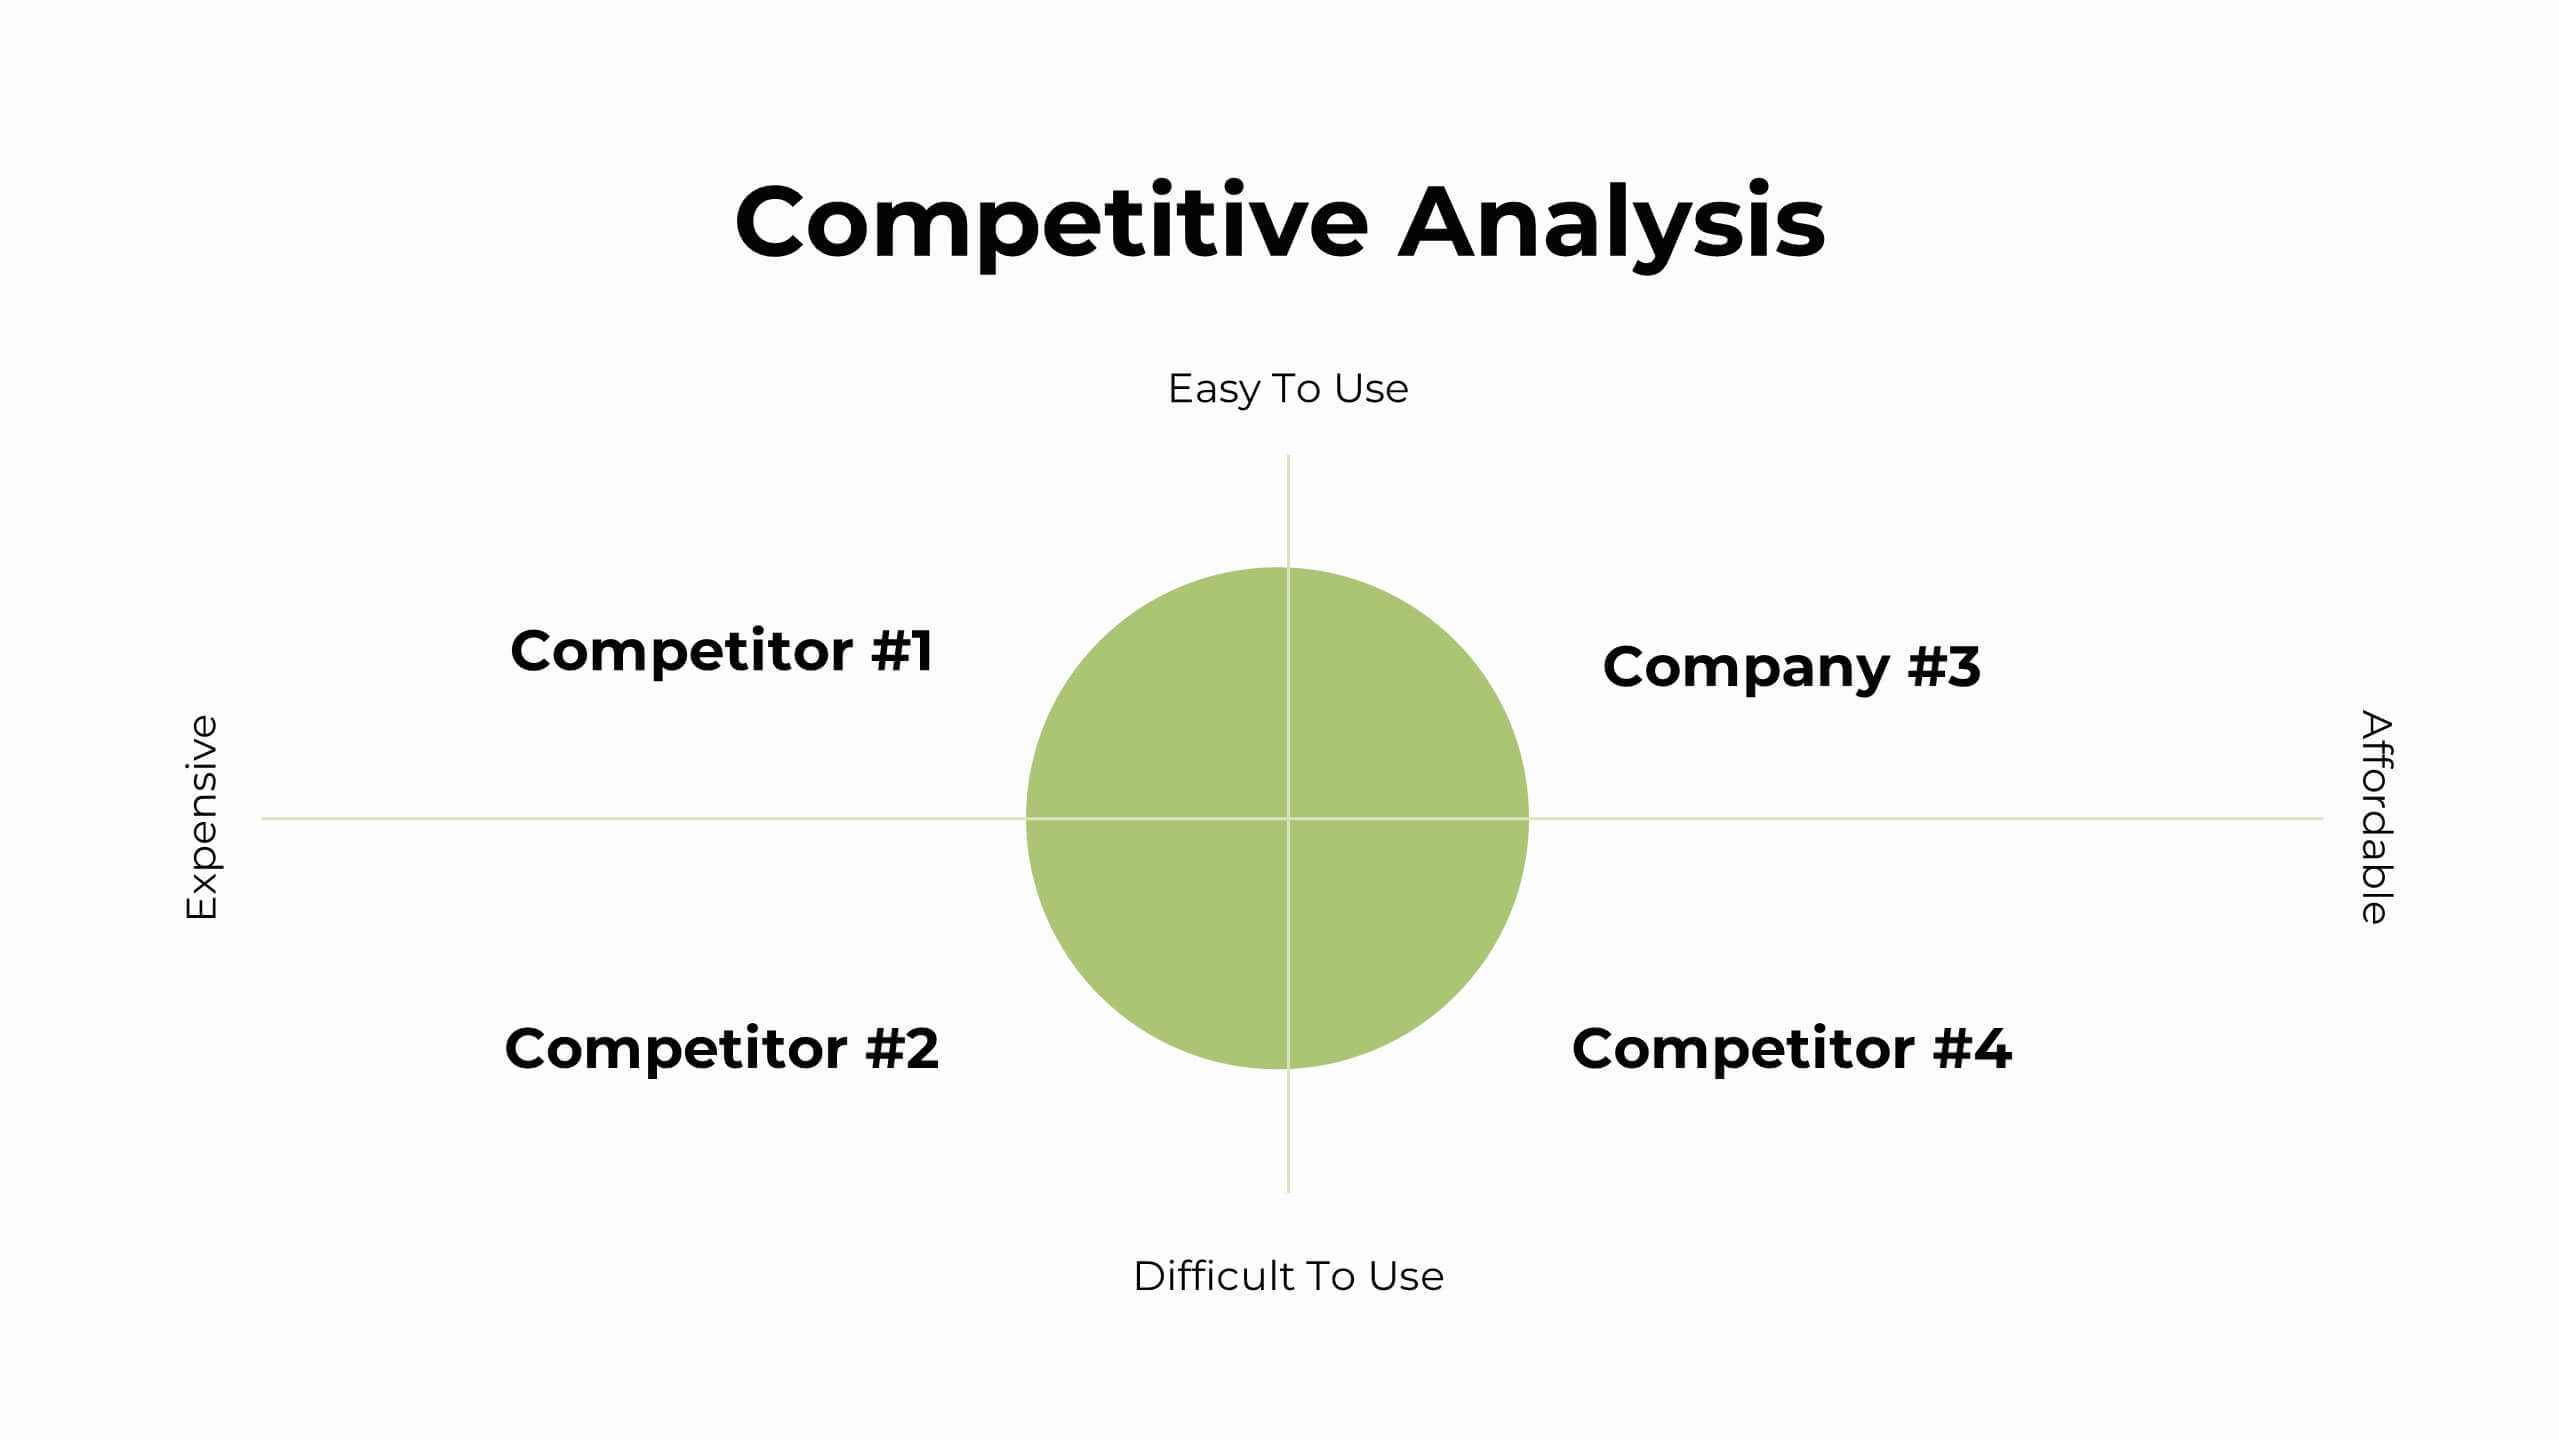
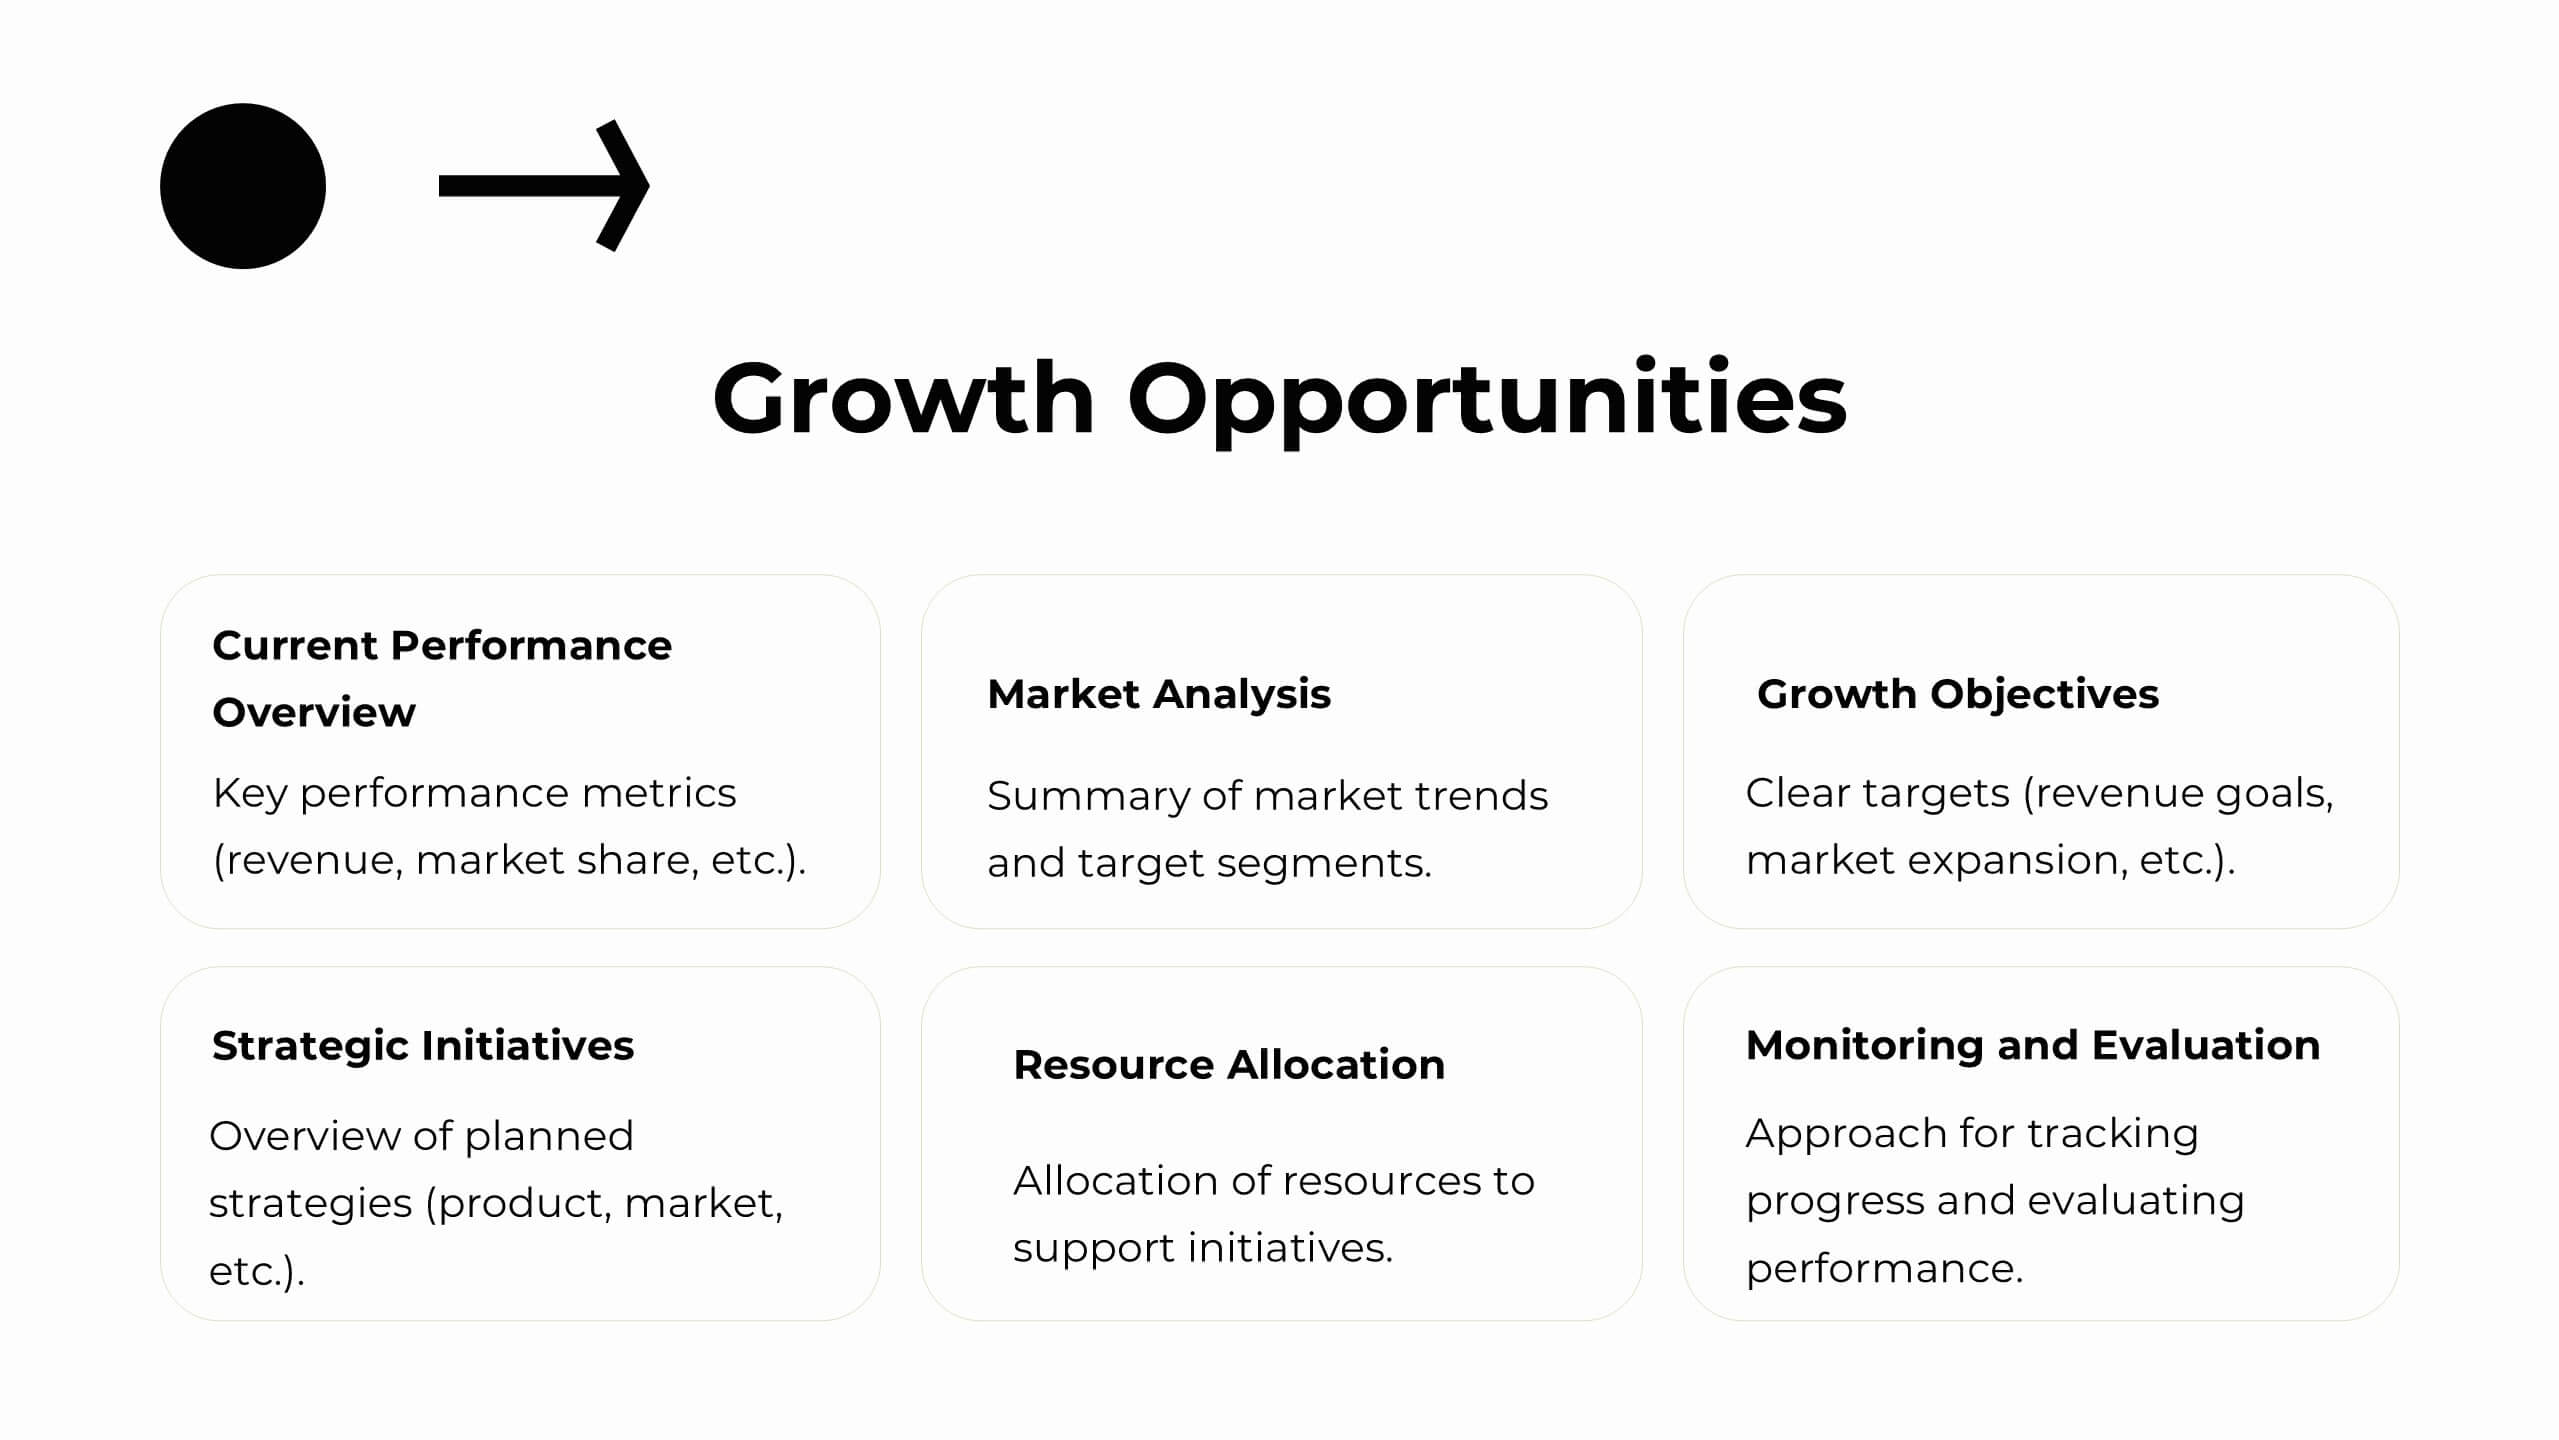
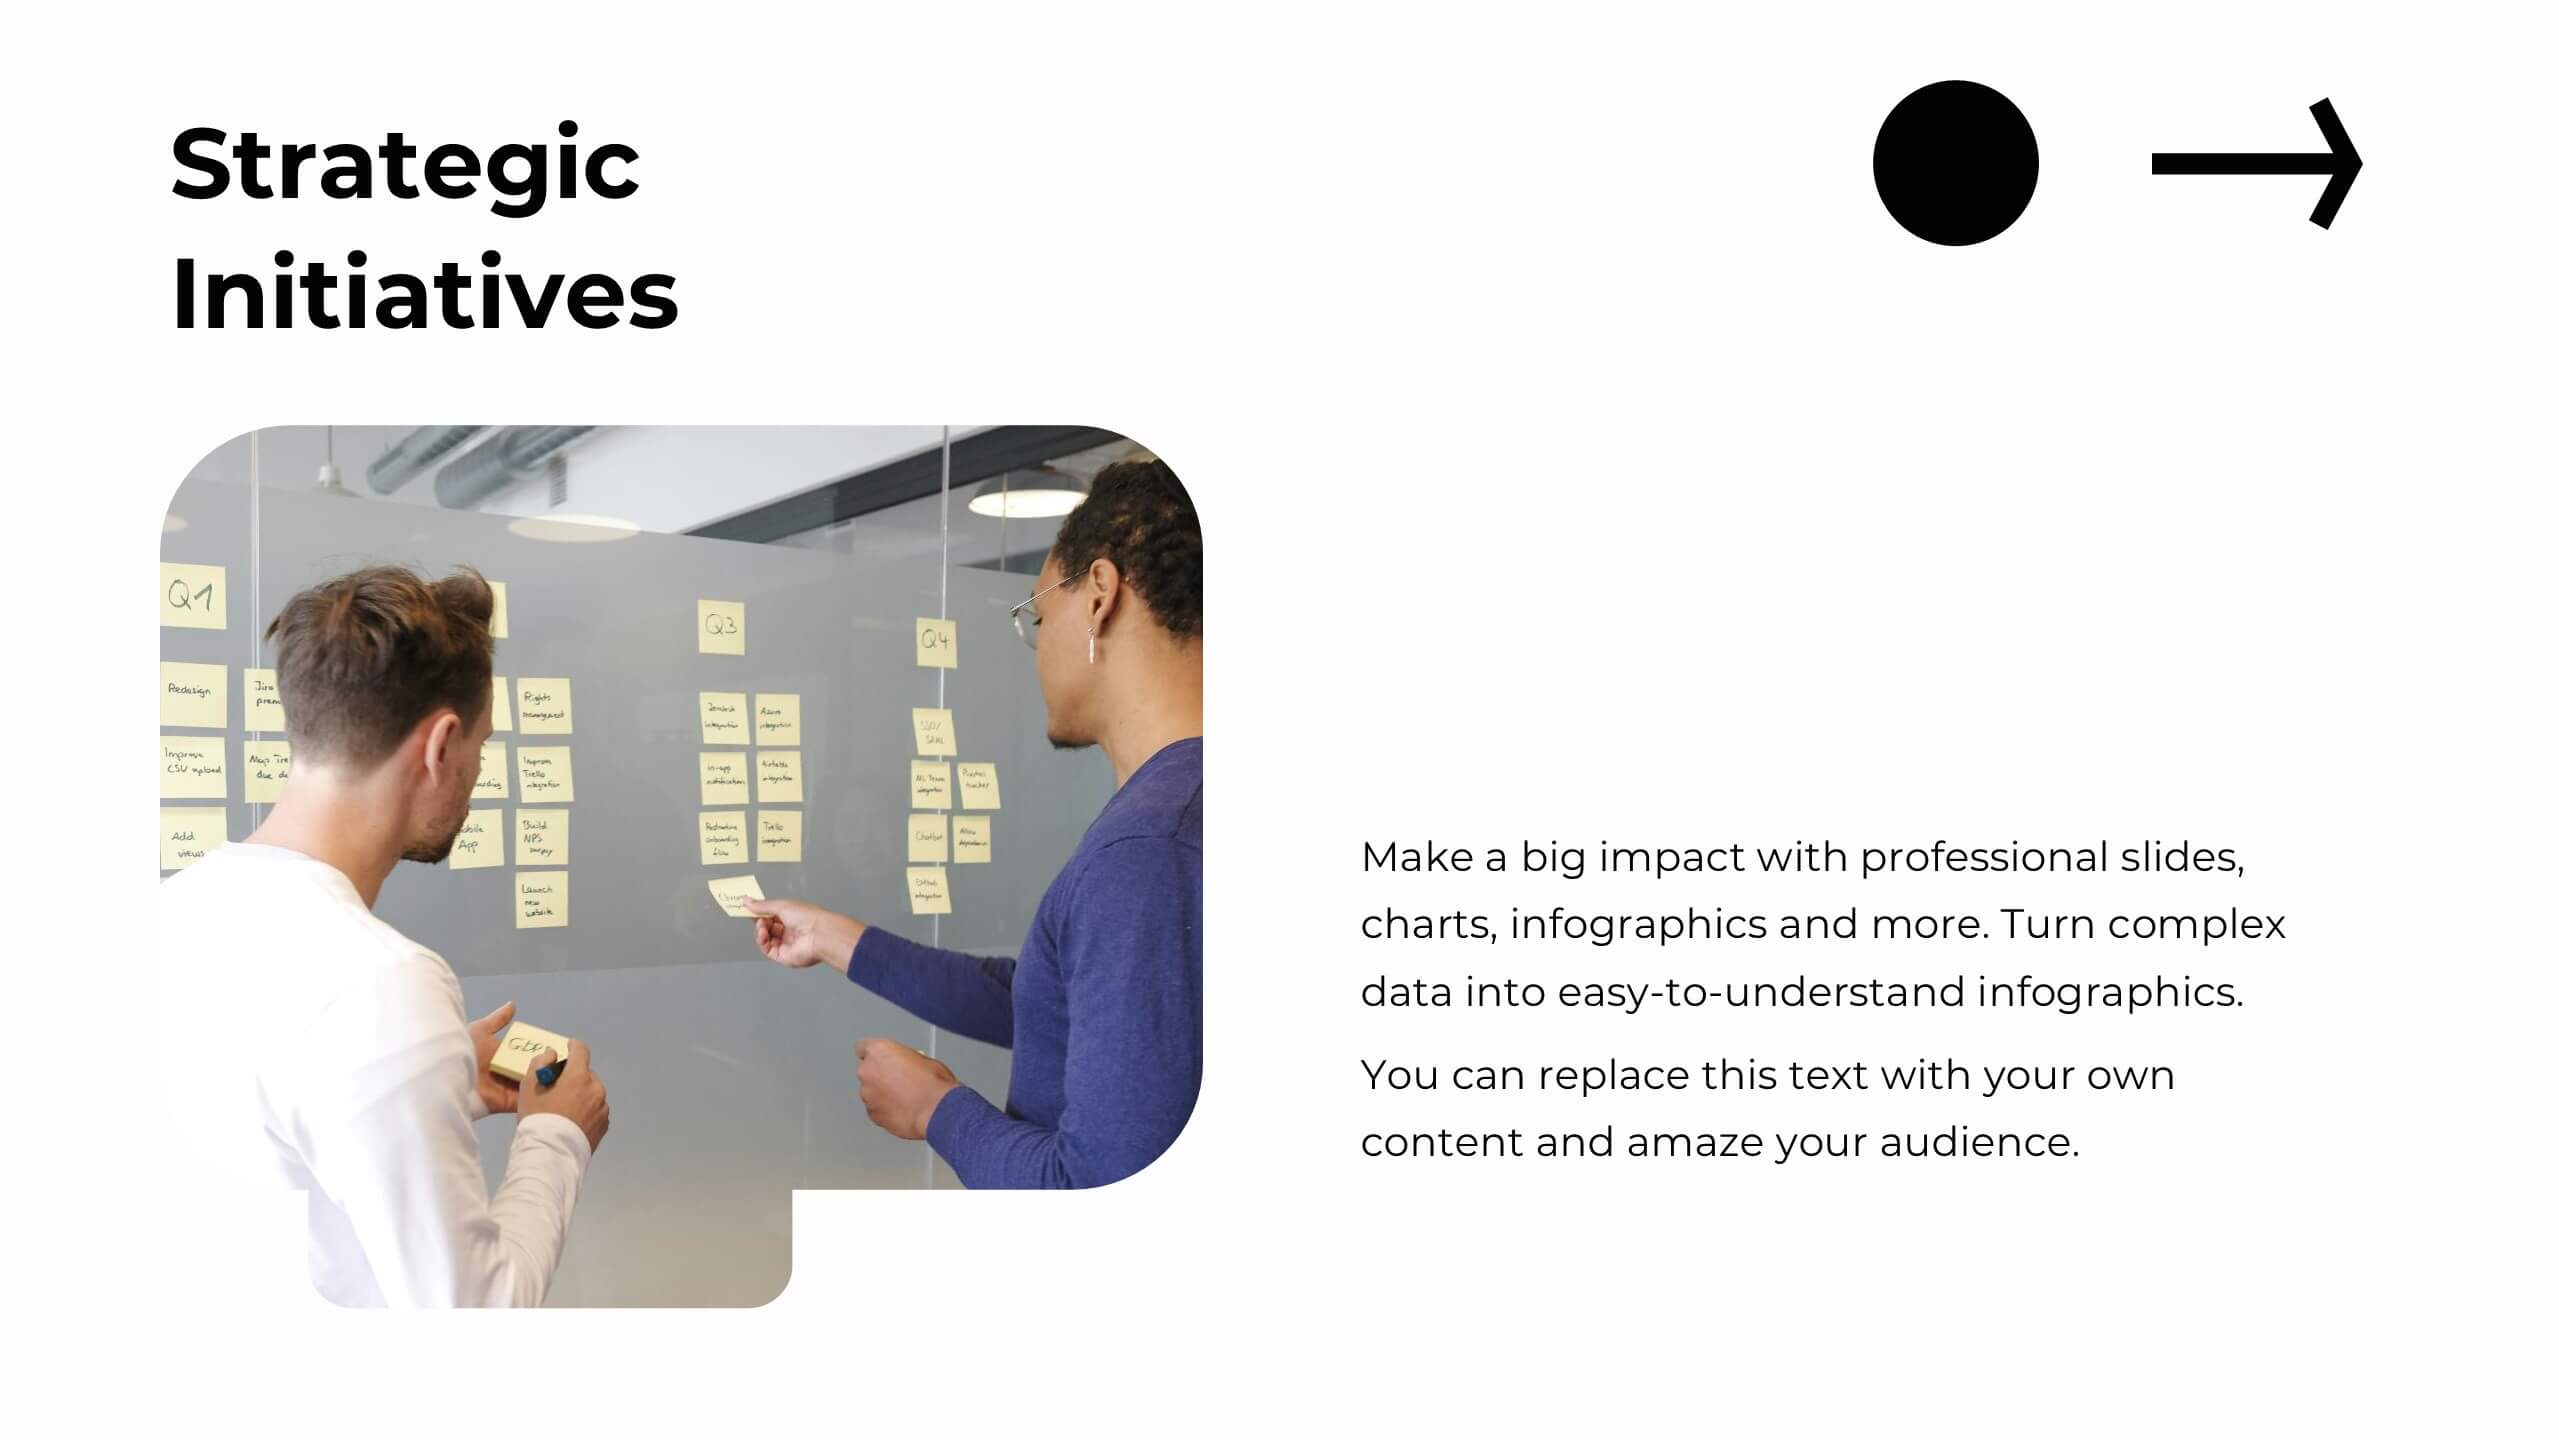
Plan and present your strategies with precision using this comprehensive strategic planning report template! Designed for clear communication of goals, market trends, SWOT analysis, and growth opportunities, it’s perfect for aligning team objectives and driving success. Fully customizable and compatible with PowerPoint, Keynote, and Google Slides, this template is ideal for strategic initiatives and performance reviews.


5 slides
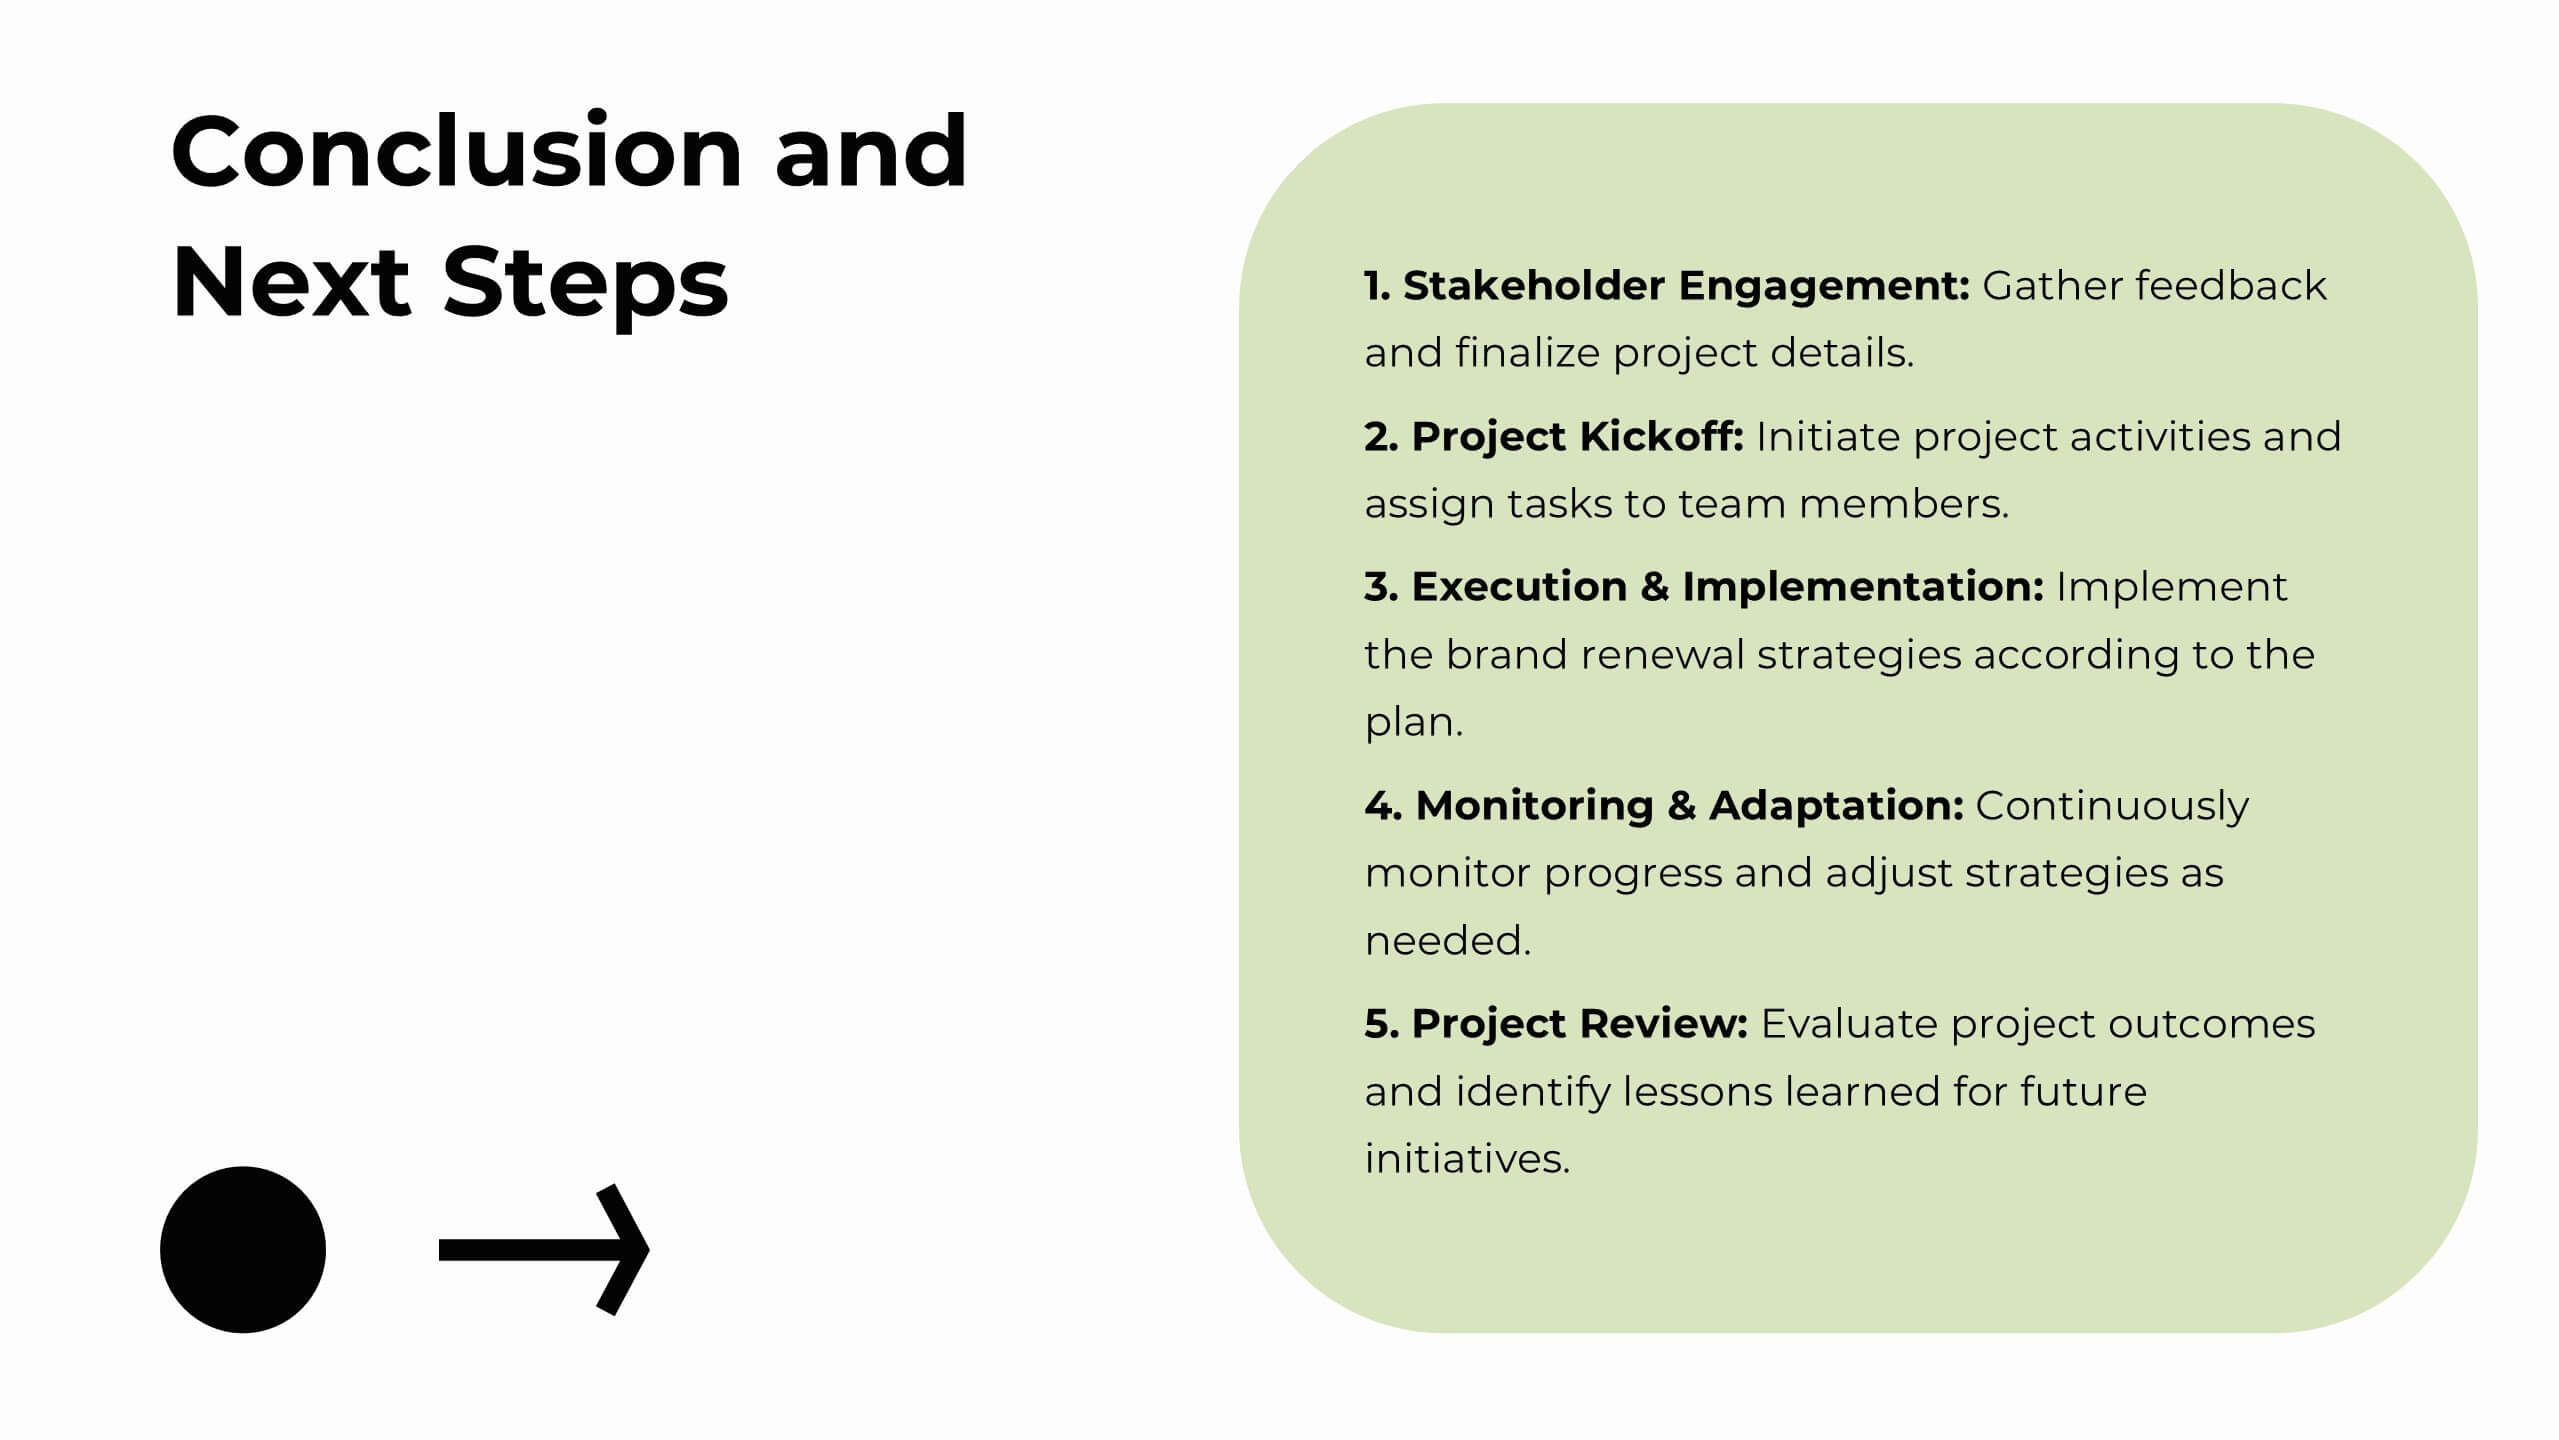
Future Planning and Next Steps Strategy Presentation
Map out your goals with clarity using the Future Planning and Next Steps Strategy Presentation. This slide features a sleek four-step curved timeline with editable icons and labels, ideal for outlining strategic actions or project phases. Easily customize each stage to match your business objectives. Compatible with PowerPoint, Keynote, and Google Slides.


7 slides
Six Sigma Training Infographic
Six Sigma is a data-driven methodology and approach for eliminating defects and improving processes in any business. This is a bold, transformative tool designed to equip individuals and organizations with the prowess of Six Sigma methodology. This template is the roadmap to excellence, paving the way for achieving remarkable improvements and efficiency. Fully customizable and compatible with Powerpoint, Keynote, and Google Slides. Unleash the power of Six Sigma through our Six Sigma Training Infographic. Let this be your guide to mastering the art of perfection, driving transformative change, and marching boldly towards operational excellence.


2 slides
App Design Mockup Presentation
Present your mobile app in style with the App Design Mockup slide. This sleek and modern template features a large smartphone frame to showcase your UI/UX designs with a creative touch. Ideal for app developers, designers, and pitch decks. Fully customizable and compatible with PowerPoint, Keynote, and Google Slides.


5 slides
Behavioral Psychology Diagram Presentation
Give your audience something to think about—literally. This bold and modern infographic layout lets you visualize complex human behavior patterns through simple, colorful brain-mapping diagrams. Perfect for presenting psychological insights, decision-making models, or behavioral science data. Fully compatible with PowerPoint, Keynote, and Google Slides for easy customization and professional use.


6 slides
KPI Data Visualization and Metrics Overview Presentation
Get a clear snapshot of your performance with this KPI Data Visualization and Metrics Overview Presentation. Designed with bold triangle charts, percentage rings, and a color-coded value panel, it’s perfect for summarizing five key metrics in a compact, visual format. Easily editable in PowerPoint, Google Slides, Keynote, and Canva.


7 slides
Comparison Infographic Presentation Template
A comparison Infographic is a visual representation that compares two or more things. It's used to show the similarities and differences between items, ideas, or concepts. It can be used to compare different products, services, options, or even facts and figures. This template works with Powerpoint, Keynote and Google Slides, so you can use it on any computer. This template includes fun pictures and allows you to add your own. This template also has many different charts, graphs and boxes so you can enter your own information. Use this comparison template to compare anything you need.


5 slides
Quarterly Action Planning Roadmap Presentation
Stay organized with the Quarterly Action Planning Roadmap Presentation. This clear, grid-based layout is perfect for mapping out priorities, goals, and deliverables across four quarters. Ideal for business planning, team tracking, and strategic reviews. Fully editable in PowerPoint, Keynote, Google Slides, and Canva for flexible customization.


20 slides
Creative Agency Presentation
Showcase your agency’s capabilities with the Magic Coat Creative Agency template. It features slides detailing team introductions, service overviews, case studies, and more. Ideal for creative agencies aiming to impress potential clients, this template supports PowerPoint, Keynote, and Google Slides, enhancing your presentation's professional appeal.


7 slides
Sustainability Management Infographics Presentation Template
Sustainability management is a management discipline that enables organizations to understand and integrate the environmental, social and economic aspects of sustainability in all their activities. A community will be more likely to reduce energy, water and waste if they have the management available to set goals for their business. This template is perfect if you are looking for sustainability and elements needed to meet your goals. This template is designed to support an organization's efforts to improve its performance, packed with illustrations you can customize and add your own tips too.


5 slides
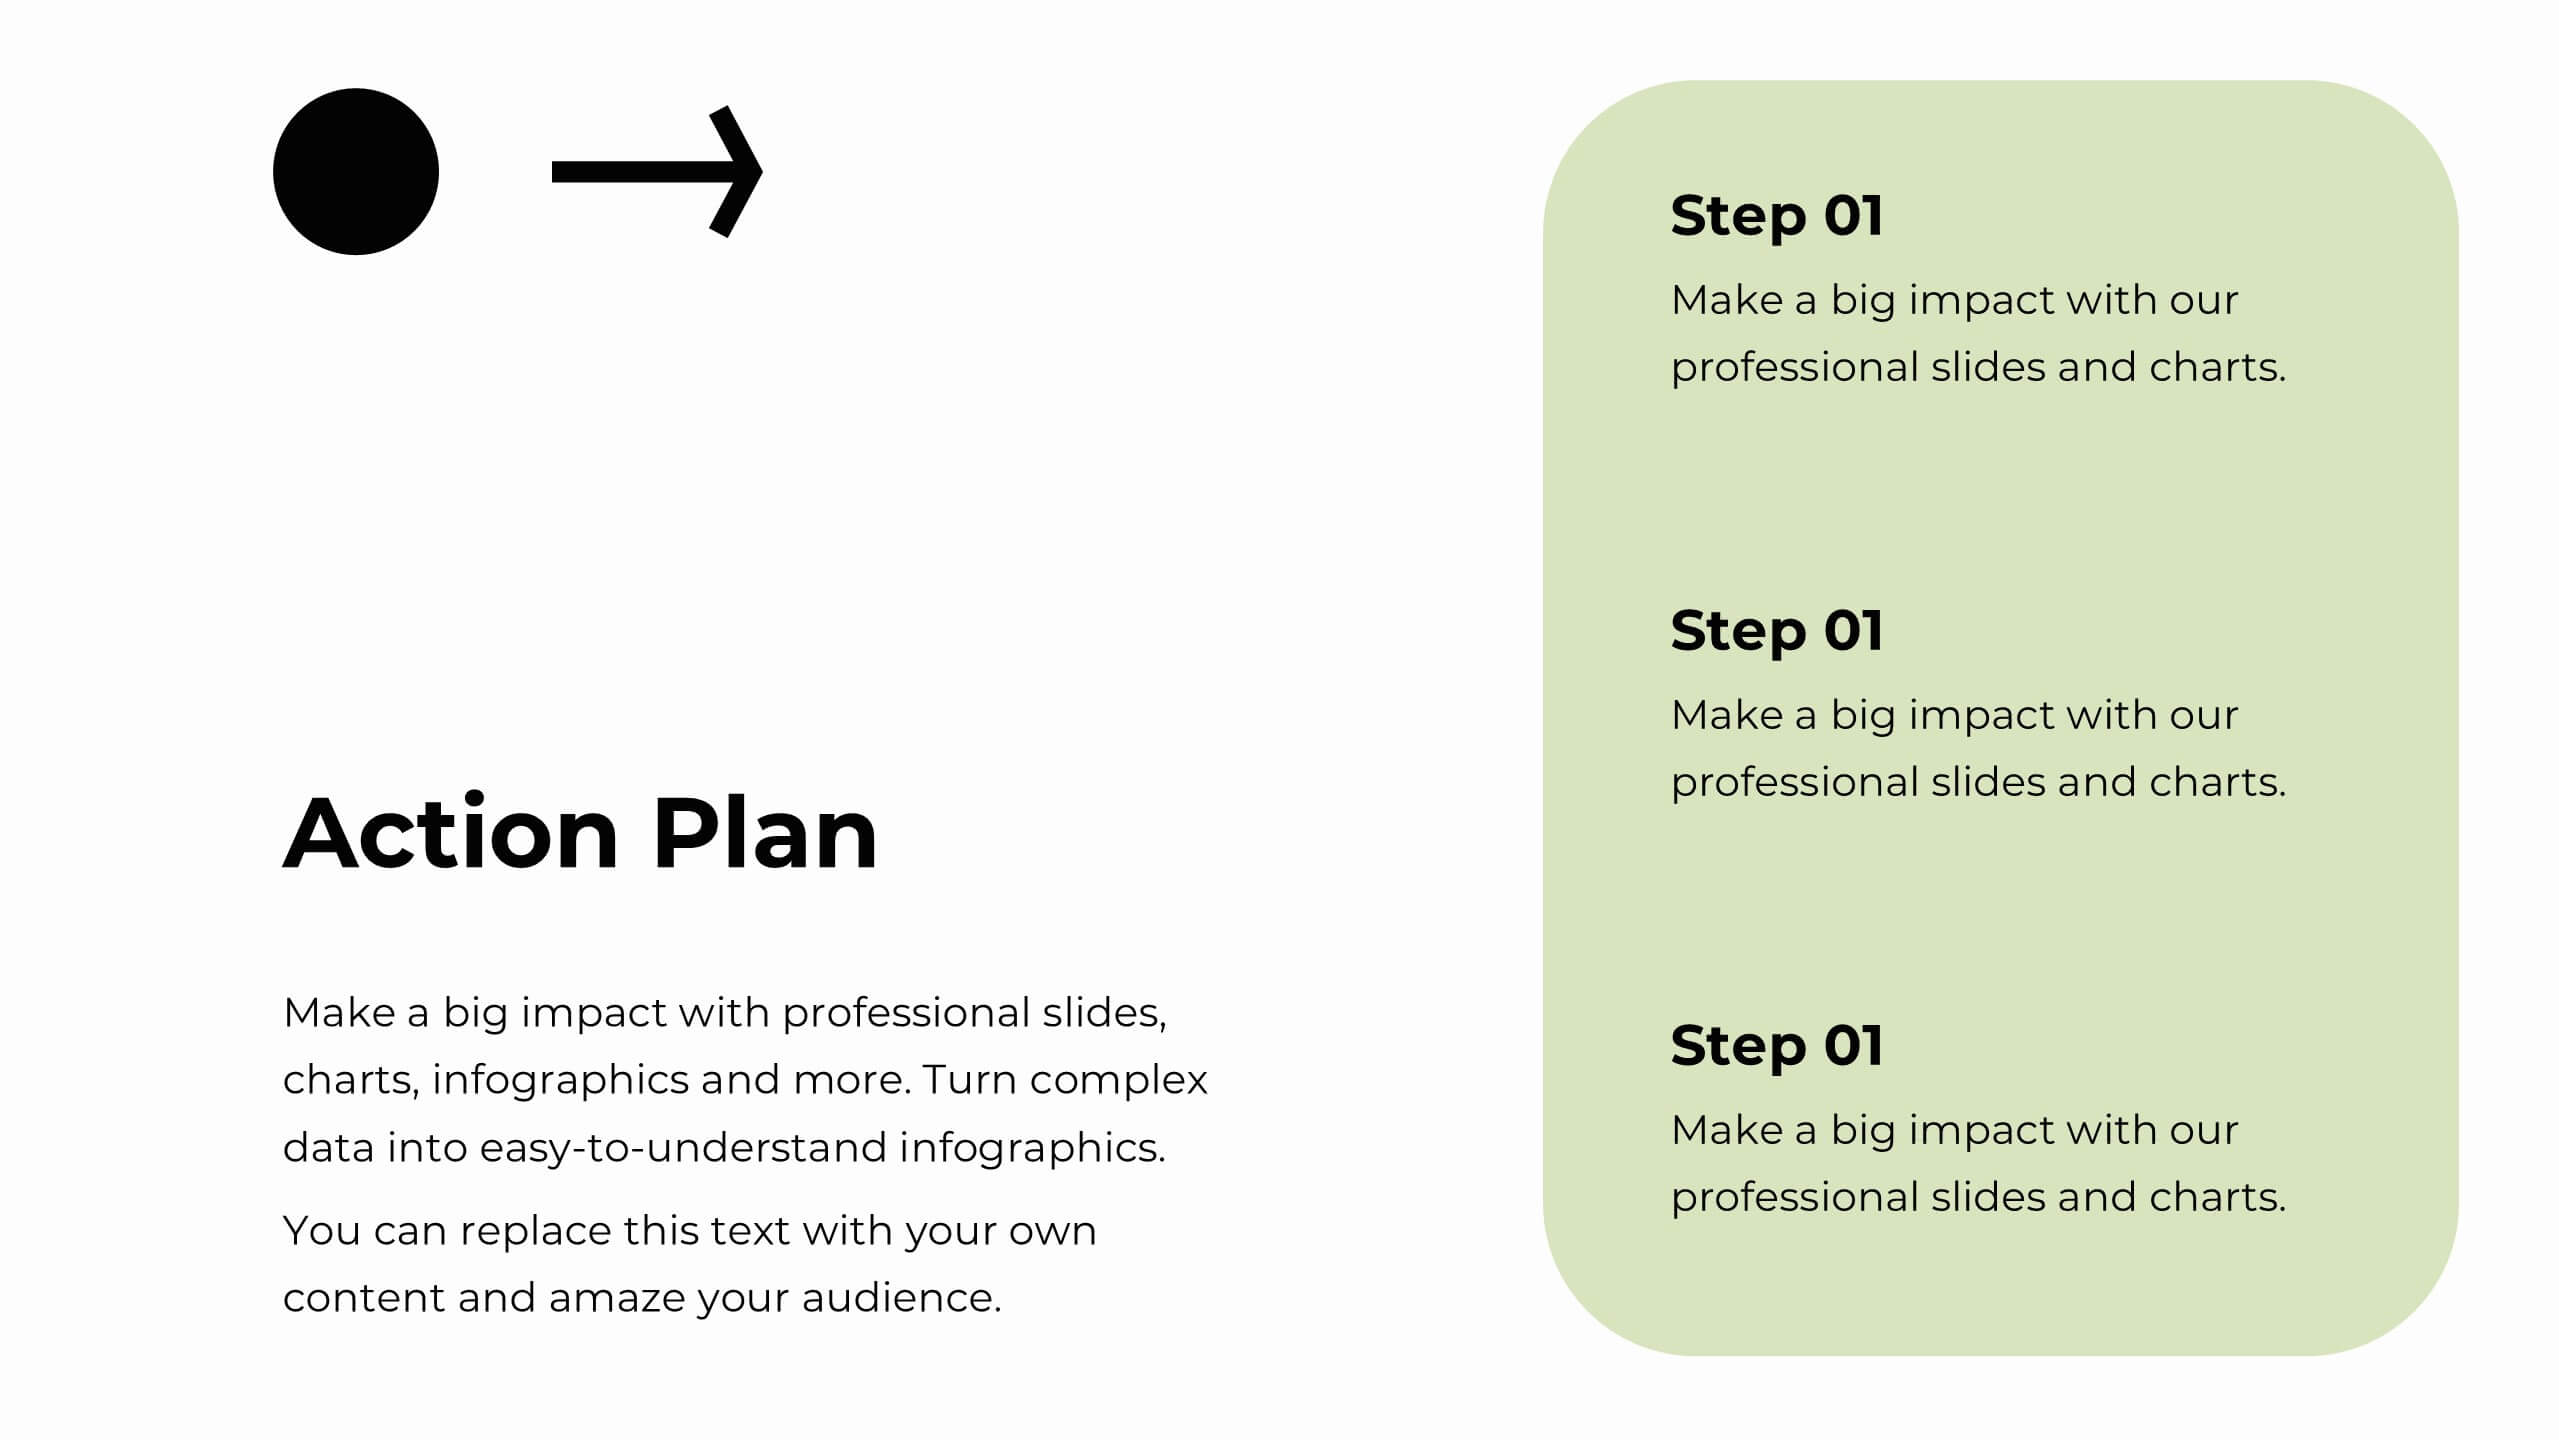
Meeting Minutes and Notes Presentation
Keep every discussion organized and every detail accounted for with this clean and structured layout. Perfect for summarizing key decisions, attendees, and next steps, it helps teams capture essential meeting insights efficiently. This easy-to-edit template works flawlessly with PowerPoint, Keynote, and Google Slides for a polished professional presentation.