


Features
- 5 Unique slides
- Fully editable and easy to edit in Microsoft Powerpoint, Keynote and Google Slides
- 16:9 widescreen layout
- Clean and professional designs
- Export to JPG, PDF or send by email


Do you have any questions?
Recommend


4 slides
Omnichannel Marketing Plan Overview Presentation
Visualize your cross-channel marketing strategy with this modern, megaphone-themed slide. Ideal for showcasing campaigns across multiple platforms, this layout helps communicate key marketing touchpoints in a clear and impactful format. Fully editable in PowerPoint, Keynote, and Google Slides—perfect for aligning marketing teams and presenting strategic plans with ease.


6 slides
Project Rollout Milestone Timeline Presentation
Visually map out your project phases with the Project Rollout Milestone Timeline Presentation. Featuring a modern cylinder path layout, this slide is perfect for showcasing five key milestones in sequential or strategic order. Ideal for project managers and teams, and fully editable in Canva, PowerPoint, Keynote, and Google Slides.


7 slides
Human Resources Process Infographic
Dive deep into the intricate world of HR with our human resources process infographic. Designed for clarity and ease of understanding, this infographic provides a streamlined look into the diverse steps and stages involved in efficient management. With a clean white canvas complemented by various shades of blue and a spectrum of colors for differentiation, this infographic promises an insightful journey. This is a tool for professionals aiming to present complex processes in a digestible format. Given its universal design, it's perfect for integration into PowerPoint, Keynote, or Google Slides presentations, ensuring that your content not only educates but also engages.


5 slides
The History of Beer Infographics
Beer has a long and fascinating history that dates back thousands of years, throughout its history beer has played a significant role in social, cultural, and economic contexts. These engaging infographics take viewers on a journey through the fascinating history of beer. It provides a comprehensive overview of the origins, evolution, and cultural significance of beer throughout different eras and regions. This visual resource is perfect for beer enthusiasts, historians, and anyone interested in the cultural and historical aspects of this beloved beverage. Compatible with Powerpoint, Keynote, and Google Slides.


5 slides
Puzzle-Based Team Alignment Strategy Presentation
Bring collaboration to the forefront with the Puzzle-Based Team Alignment Strategy Presentation. This creative layout uses interlocking puzzle pieces to represent interconnected team roles, milestones, or initiatives—perfect for showcasing synergy and strategic cohesion. Each section is color-coded and icon-enhanced for quick visual recognition, making it ideal for team briefings, onboarding, or workflow planning. Fully editable in PowerPoint, Keynote, and Google Slides.


21 slides
Parthenon Marketing Proposal Template Presentation
Create an impactful marketing proposal with this vibrant and modern presentation template! Covering key sections such as industry overview, consumer behavior, social media strategies, and emerging technologies, it helps you present your marketing insights with style. Fully customizable and perfect for data-driven marketing plans, this template is compatible with PowerPoint, Keynote, and Google Slides for seamless presentation delivery.


20 slides
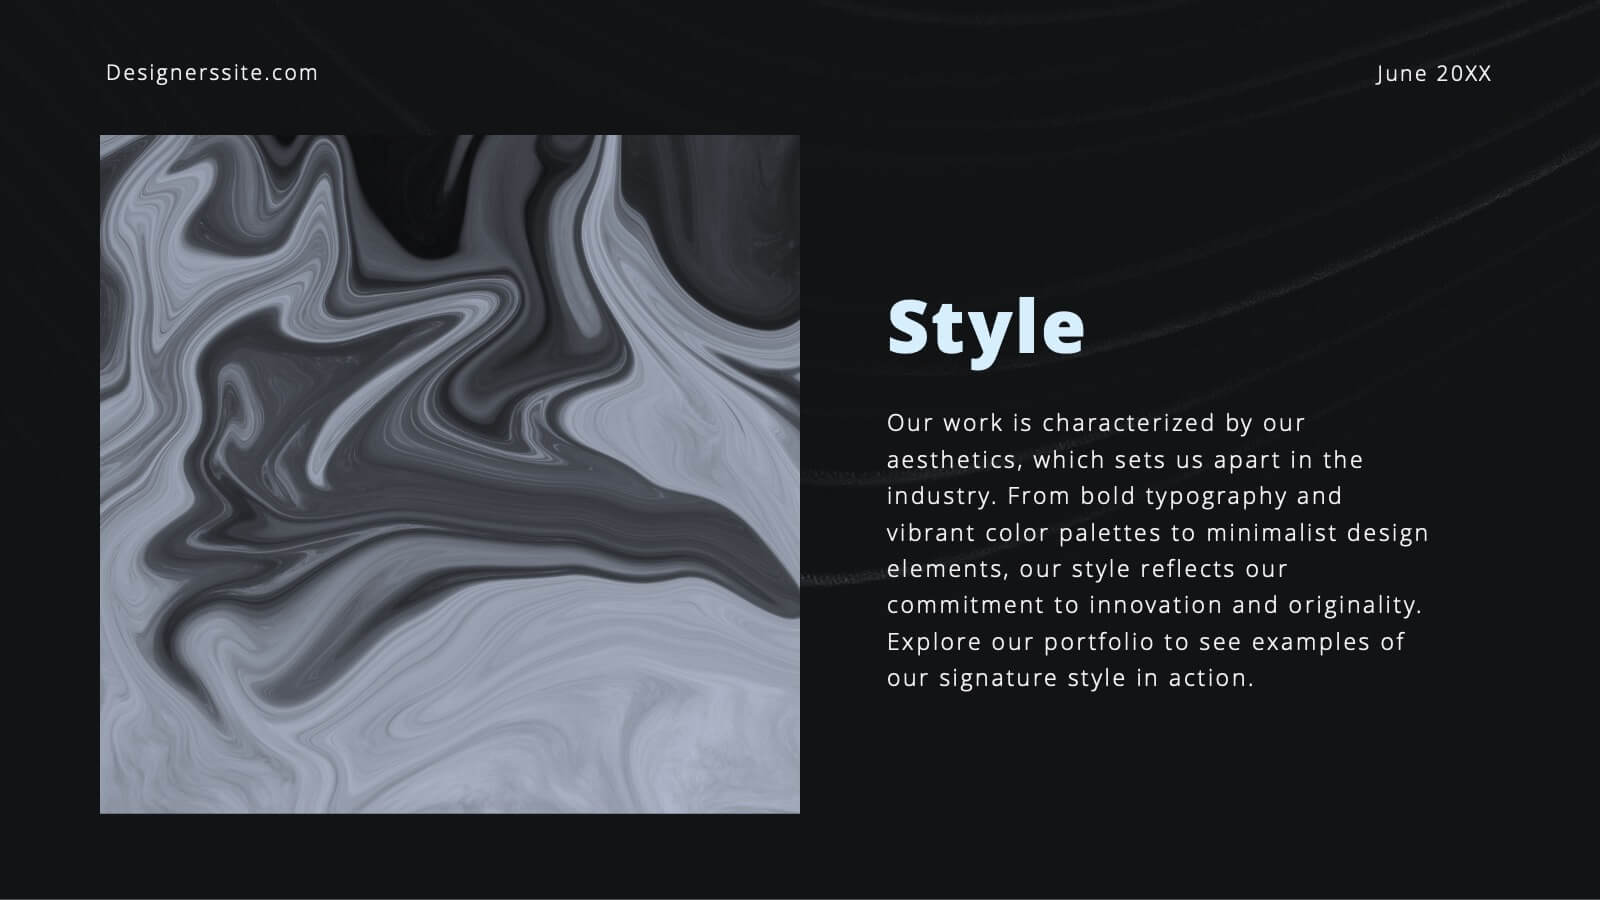
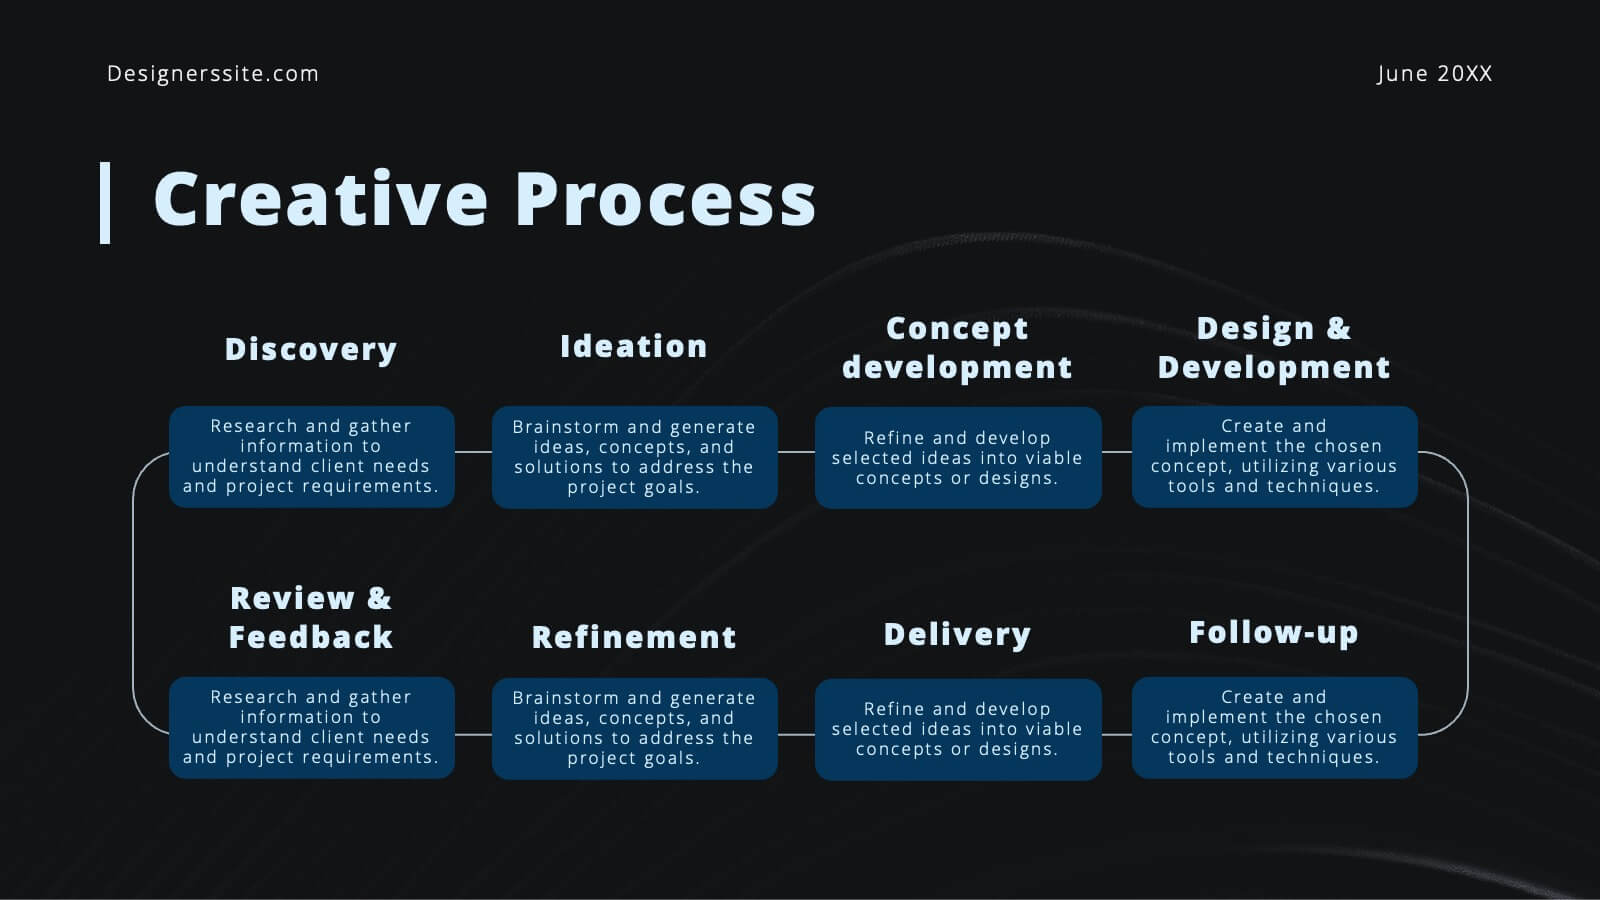
Bravo Creative Portfolio Presentation
Showcase your creative prowess with this sleek, modern portfolio presentation template. Perfect for highlighting featured projects, client testimonials, and your creative process, this template ensures your work shines. Its stylish design and professional layout make it ideal for impressing potential clients and collaborators. Compatible with PowerPoint, Keynote, and Google Slides, it's versatile for any platform.


4 slides
Crypto Investment and Trading Strategies Presentation
Visualize your crypto strategy with clarity using this modern, step-by-step slide. Featuring a rising arrow graph, coin icon, and shopping cart illustration, this layout is ideal for explaining investment phases, trading tactics, or market entry strategies. Editable in PowerPoint, Keynote, and Google Slides for maximum flexibility.


4 slides
Key Performance Indicators Presentation
Hit every target with a bold, visual layout that helps you present performance insights with clarity and impact. This presentation makes it easy to highlight goals, measure progress, and showcase meaningful data in a clean, modern design. Fully editable and compatible with PowerPoint, Keynote, and Google Slides.


6 slides
RACI Matrix Chart Infographic
The RACI matrix is a project management tool used to define roles and responsibilities for tasks and activities within a project. This infographic template is designed to clarify the roles and responsibilities of team members in a project or process. RACI stands for Responsible, Accountable, Consulted, and Informed, and the matrix helps define each team member's involvement in different tasks or activities. This includes a step-by-step guide on how to create a RACI matrix, including identifying tasks, defining roles, and assigning responsibilities. This will simplify your audience's understanding of the RACI matrix chart.


5 slides
Business Growth Cycle Presentation
Illustrate your company’s journey with the Business Growth Cycle slide. This dynamic layout features four sleek arrow segments that represent each phase of growth—from initiation to expansion. Color-coded steps and minimalist icons help guide the audience through your strategy clearly and efficiently. Ideal for outlining roadmaps, business stages, or workflow transitions. Fully editable and compatible with PowerPoint, Keynote, and Google Slides.


5 slides
SEO Techniques Infographics
SEO (Search Engine Optimization) techniques are strategies and practices used to improve a website's visibility and ranking in search engine results pages (SERPs). These infographic templates are designed to educate and inform about various techniques and strategies used in search engine optimization. With its eye-catching design and clear visual representations, the template helps convey complex SEO concepts in a concise and engaging manner. These provide a foundation for understanding the subsequent techniques discussed in the presentation. Throughout the infographic, best practices and tips are shared to help optimize SEO efforts.


26 slides
Cutting-Edge AI Breakthroughs Presentation
Step into the future with this exciting presentation on cutting-edge AI breakthroughs. Covering advancements in machine learning, automation, ethical AI, and real-world applications, this template helps you present complex innovations with clarity and impact. Fully customizable and compatible with PowerPoint, Keynote, and Google Slides for a seamless and engaging presentation experience.


10 slides
Financial Investment Strategy Presentation
Bring your financial ideas together with a clean, puzzle-style layout that instantly makes complex strategies feel organized and actionable. This presentation helps you explain key components, compare performance drivers, and present investment plans with clarity and confidence. Easy to edit and fully compatible with PowerPoint, Keynote, and Google Slides.


4 slides
Effective Team Communication
Break down communication impact with this data-driven walkie-talkie infographic. Perfect for showing percentage-based contributions, roles, or workflow efficiency across teams. Fully customizable in PowerPoint, Keynote, and Google Slides.


4 slides
Professional Business Meeting Agenda Presentation
Efficiently structure your next corporate gathering with the "Professional Business Meeting Agenda" presentation template. Its geometrically appealing layout organizes discussion points in a visually captivating manner, encouraging effective communication and engagement. Perfect for strategizing sessions, this template ensures that every item on your agenda is highlighted with clarity. Compatible across PowerPoint, Keynote, and Google Slides, it’s designed to make every meeting more productive.


5 slides
Agribusiness Market Strategy Overview
Showcase your market plan with the Agribusiness Market Strategy Overview Presentation. This engaging slide uses fresh produce illustrations to symbolize market growth, distribution, and agricultural planning. Perfect for farm business proposals, supply chain discussions, or food sector reports. Fully customizable and works seamlessly in PowerPoint, Keynote, and Google Slides.