


Features
- 6 Unique slides
- Fully editable and easy to edit in Microsoft Powerpoint, Keynote and Google Slides
- 16:9 widescreen layout
- Clean and professional designs
- Export to JPG, PDF or send by email


Do you have any questions?
Recommend


4 slides
Europe Market Expansion Visualization Presentation
Showcase your European growth strategy with the Europe Market Expansion Visualization Presentation. This map-based slide design allows you to clearly highlight regional opportunities, new market entries, and key expansion zones using icons and color-coded country markers. Ideal for strategic planning, investor updates, and sales overviews. Fully editable in PowerPoint, Keynote, Google Slides, and Canva.


7 slides
Consulting Business Strategy Infographic Presentation
A company’s business strategy is a plan that helps it achieve its goals and meet long-term objectives. A business strategy should be designed to fulfill the company’s mission, vision, and values. This template is designed to make your business or company plan, easy to understand and present in a professional way with the best design. This template can be used to present your company's strategic vision, long-term goals, and key initiatives. With its colorful and dynamic design, this can attract your audience’s attention, while also providing them with useful information about your strategy.


7 slides
Modern Education Infographic
Immerse yourself in the evolving world of learning with our Modern Education Infographic. With a crisp white canvas, the design incorporates an energizing mix of orange, the trust-building hue of blue, and a dash of passionate red. This template boasts modern infographics, bespoke icons, and versatile image placeholders, offering a visual guide to contemporary educational methods, tools, and trends. Precision-made for Powerpoint, Keynote, or Google Slides. Ideal for educators, curriculum developers, edtech startups, or any professional keen on showcasing the transformation in learning techniques.


8 slides
Product Showcase on Devices Presentation
Present your features in a sleek, mobile-first layout with the Product Showcase on Devices Presentation. This vertical slide design mimics a smartphone screen, making it ideal for displaying app features, service tiers, or digital tool highlights. Each section is clearly segmented, perfect for comparisons or step-by-step product walkthroughs. Fully editable in PowerPoint, Keynote, Canva, and Google Slides.


22 slides
Tempest Product Strategy Report Presentation
Accelerate your product strategy with this bold presentation template! Ideal for outlining your product's market opportunity, unique selling proposition, and revenue model, it includes slides for competitive analysis, marketing strategy, and financials. Impress stakeholders with dynamic visuals and clear, structured content. Compatible with PowerPoint, Keynote, and Google Slides for seamless presentations on any platform.


20 slides
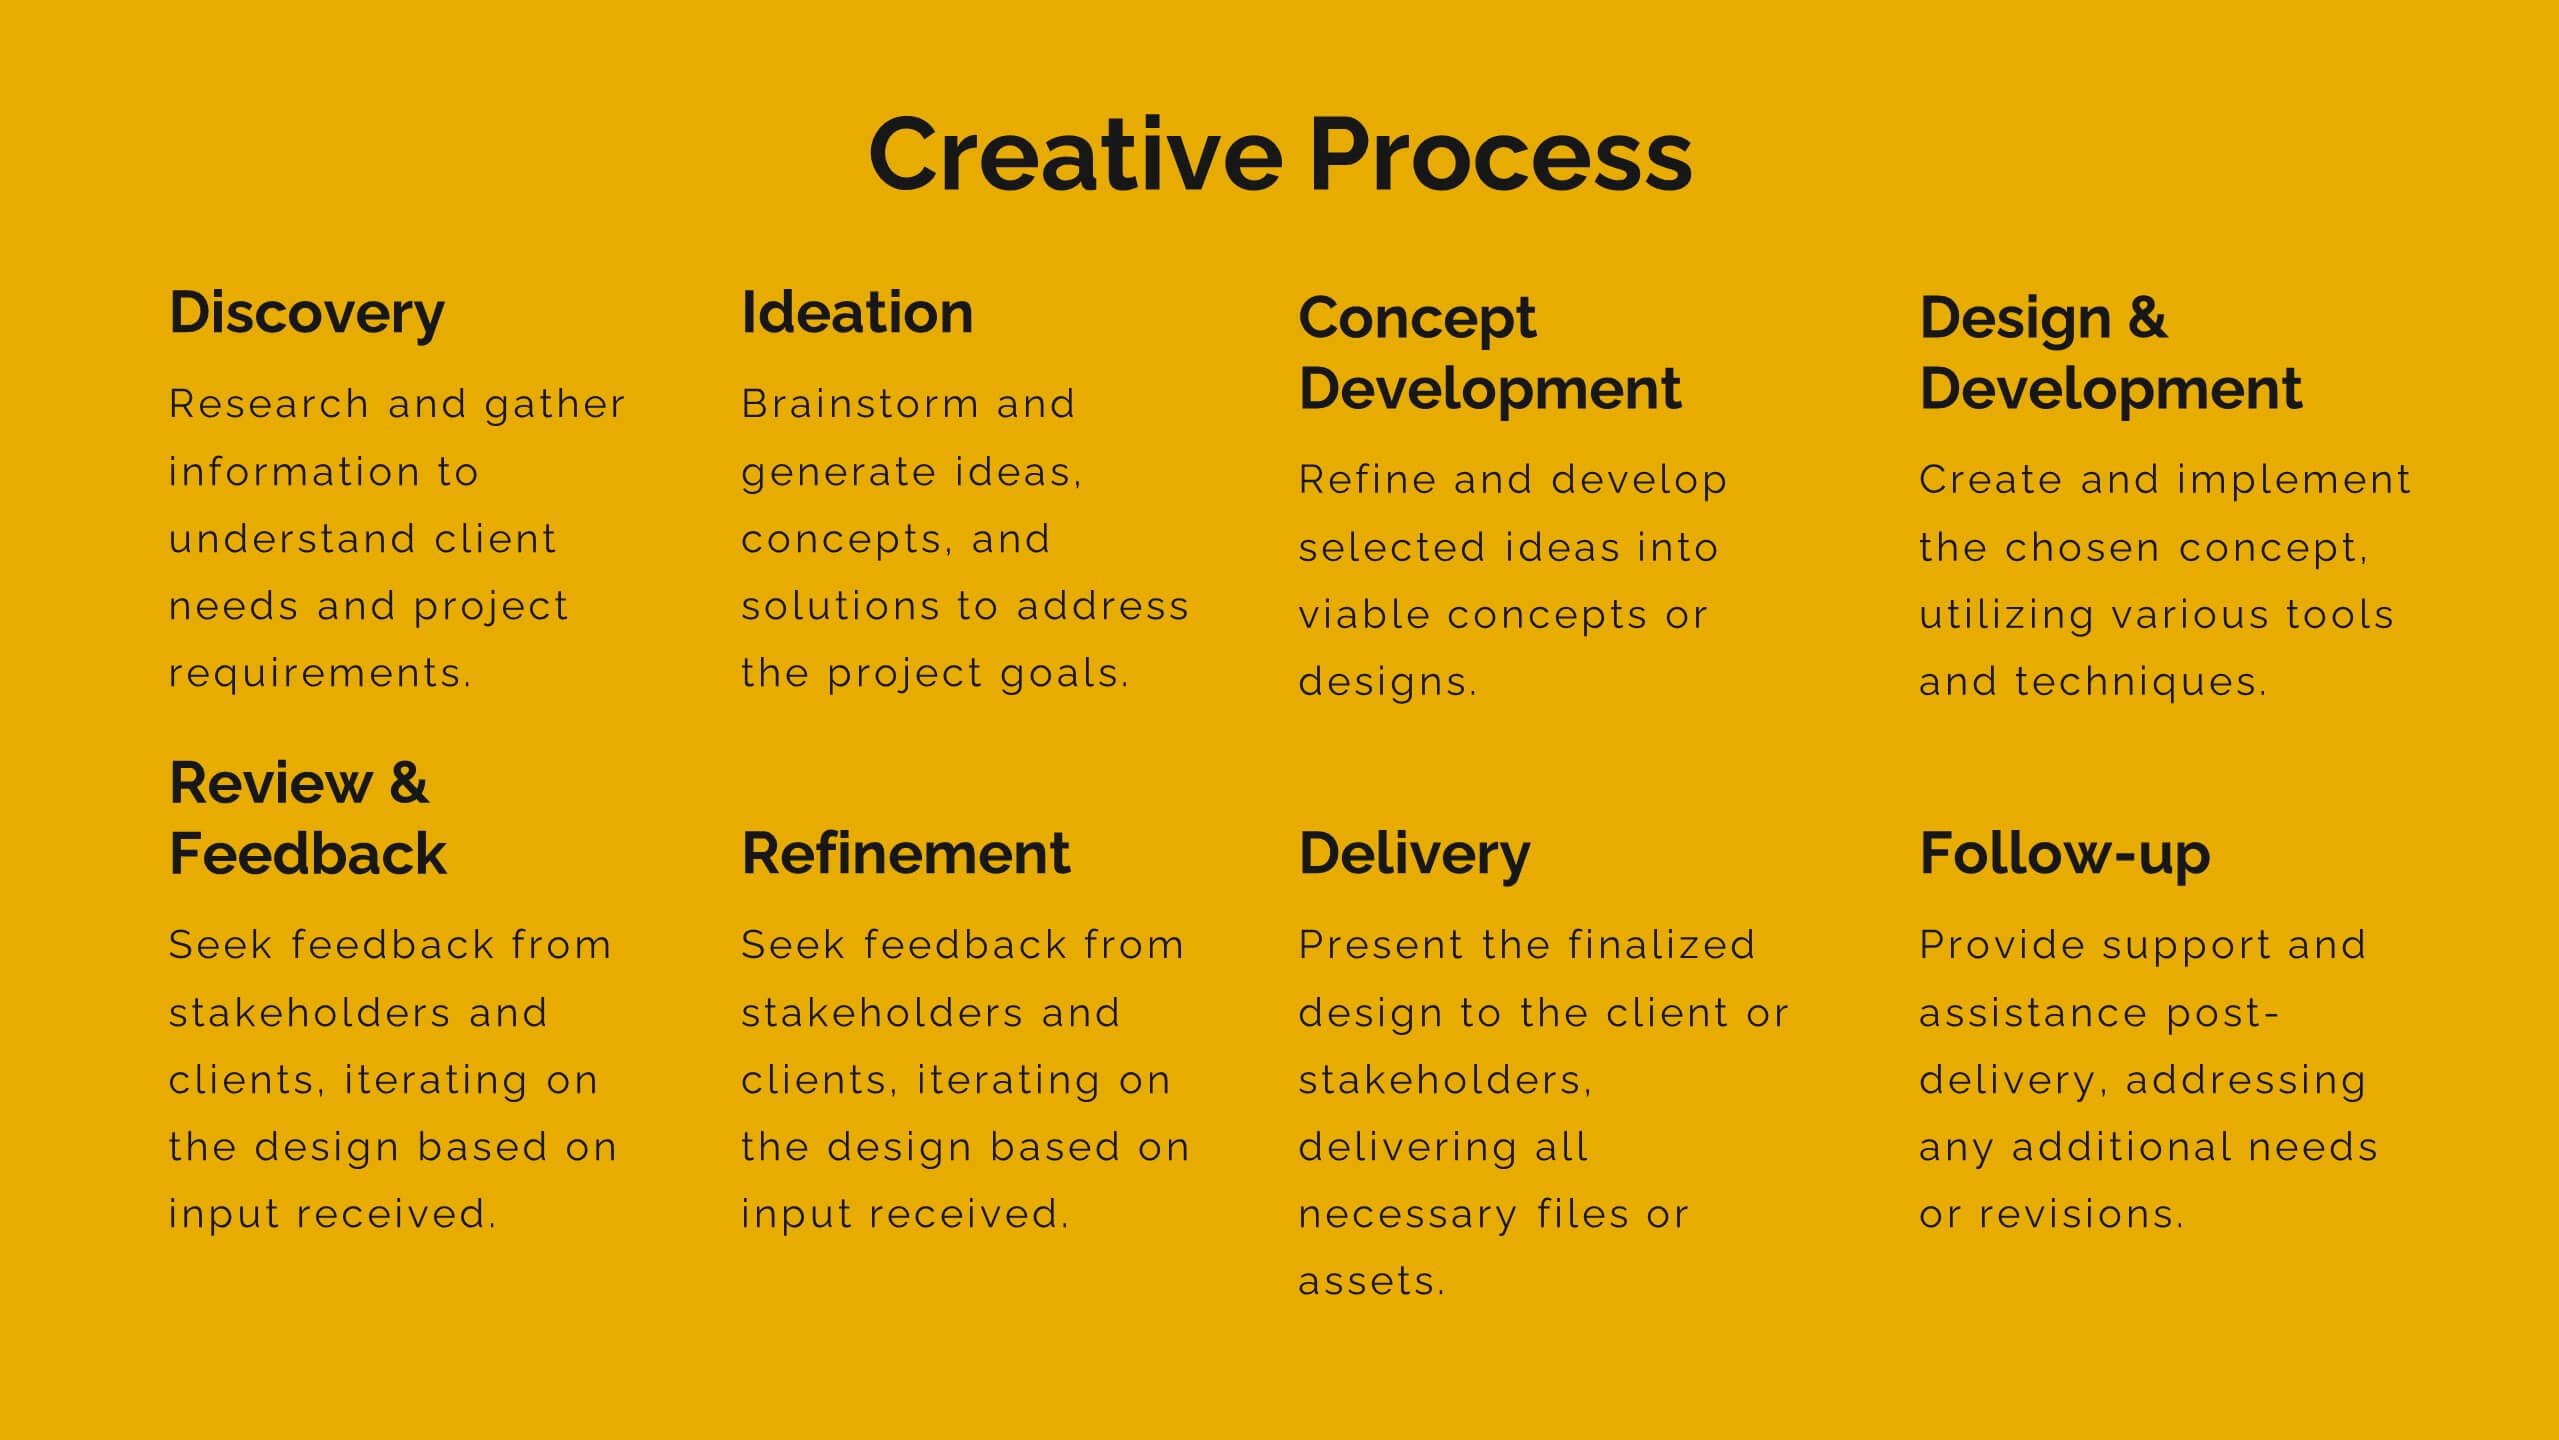
Vortex Artist Portfolio Template Presentation
Showcase your artistic brilliance with this eye-catching portfolio presentation template! Perfect for highlighting your projects, creative process, and awards, it features vibrant slides for your philosophy, collaborations, and client testimonials. Impress potential clients and collaborators with a stunning, well-organized portfolio. Compatible with PowerPoint, Keynote, and Google Slides for seamless presentations on any platform.


4 slides
Veterinary Practice Overview Presentation
Give your veterinary insights a professional touch with this clean, modern infographic layout. Designed to showcase workflows, patient care processes, and team structures, it helps present information clearly and visually. Fully customizable and compatible with PowerPoint, Keynote, and Google Slides for easy editing and seamless presentation design.


7 slides
Social Media Engagement Infographic
Social media is the most influential tool in today's world. This infographic template is a great way to share the benefits of your services in an easy-to-read format that's sure to get your audience excited about what you have to offer. Whether you're looking to promote a new product line or simply want to provide information to your customers so they can make informed decisions, this infographic will be perfect for your needs. This infographic will help you understand how to use social media to engage with your audience and drive traffic to your site. Fully customizable and compatible with Powerpoint, Keynote, and Google Slides.


5 slides
Cyber Security Best Practices Infographics
Navigate the digital landscape safely with our cyber security best practices infographics. Crafted in a striking combination of black with colorful accents, this creative, vertical template is a powerhouse of cyber safety education. It's an indispensable resource for IT professionals, and educators seeking to propagate security protocols. The design encapsulates compelling graphics, intuitive icons, and dedicated placeholders. Compatible with Powerpoint, Keynote, and Google Slides. By employing this infographic, users can foster a culture of digital vigilance and defense, making it an asset in the fight against online threats.


6 slides
Measuring User Experience with Smile Ratings Presentation
Visualize customer sentiment with this Smile Rating UX slide. Featuring vertical smile meter graphics with corresponding percentages and descriptions, it’s ideal for product feedback, service evaluations, or usability reports. Clearly distinguish satisfaction levels across three stages or categories. Fully customizable in PowerPoint, Keynote, and Google Slides.


20 slides
Illumira Design Proposal Presentation
Impress clients with this modern and professional design proposal presentation template. It covers key sections such as project summary, objectives, budget breakdown, and action plans. Fully customizable with clean layouts and engaging visuals, perfect for showcasing your design solutions effectively. Compatible with PowerPoint, Keynote, and Google Slides.


21 slides
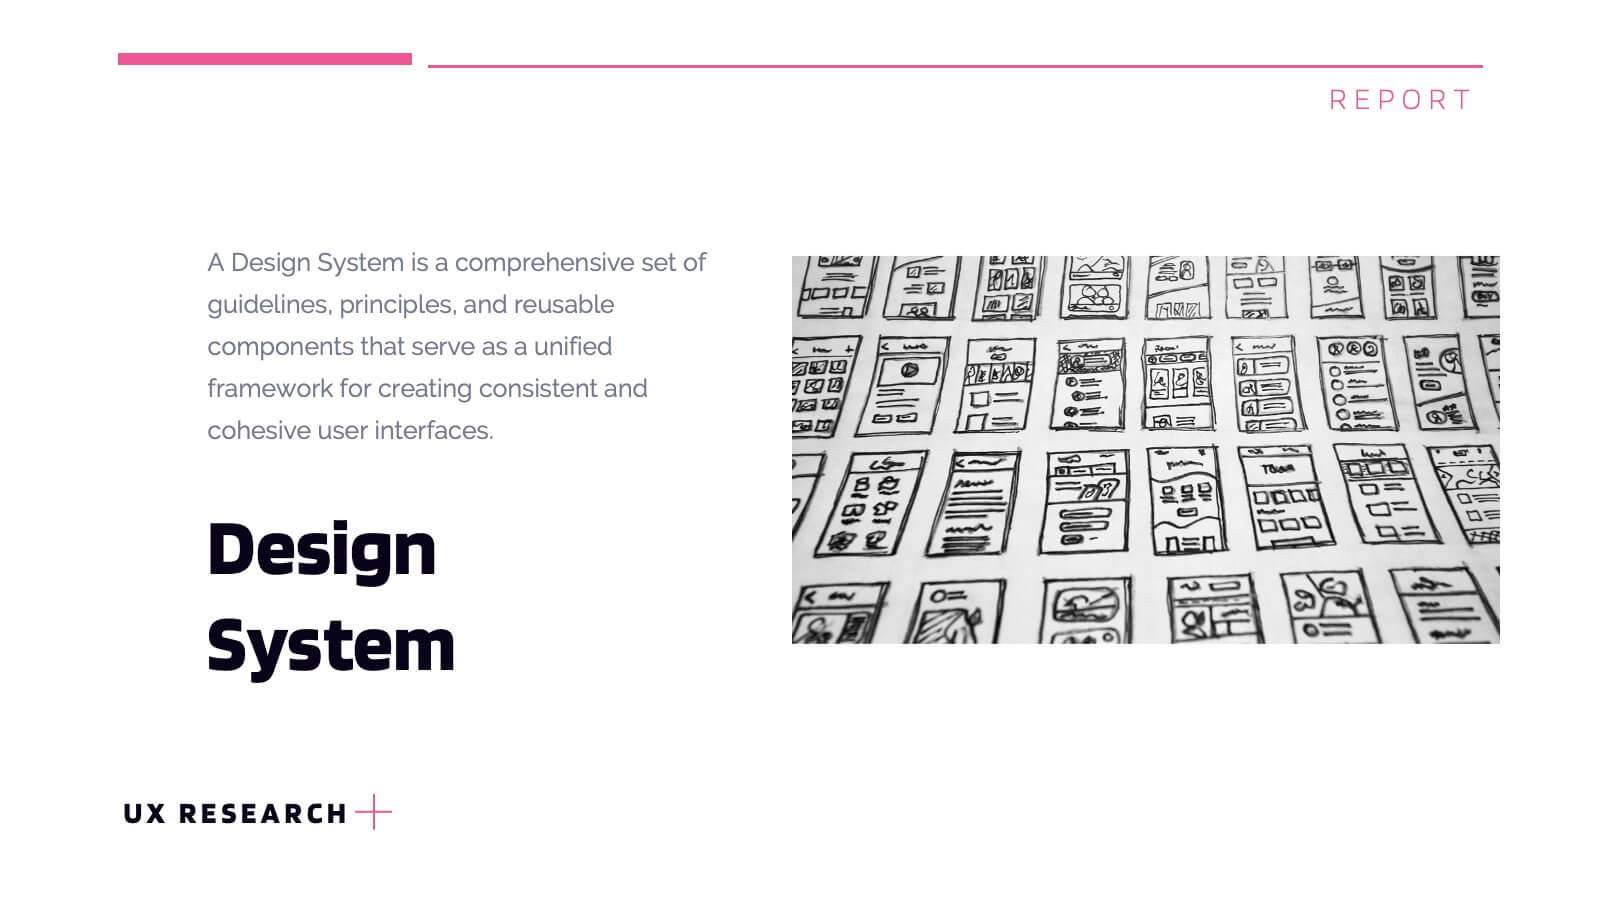
Lumascend UX Research Report Presentation
Present your UX research findings with clarity using this engaging and organized template! Covering key areas like user personas, wireframes, testing, and interaction design, it ensures all aspects of your design process are communicated effectively. Perfect for UX teams, stakeholders, or client presentations, this template works seamlessly with PowerPoint, Keynote, and Google Slides.


5 slides
Final Thoughts and Project Recap Presentation
Wrap up your presentation with clarity using this Final Thoughts and Project Recap Presentation. Designed with a modern vertical hexagon layout, this slide highlights four key conclusions or reflections with matching icons and clean text alignment. It's perfect for summarizing insights, actions, or final outcomes. Fully editable in PowerPoint, Keynote, Google Slides, and Canva.


5 slides
USA Economic Map Infographic
Navigate the complexities of the American economy with our USA economic map infographic. Crafted in shades of blue and diverse colors, this creative, vertical infographic is a boon for economists, researchers, and educators. It's designed to dissect financial data across states, highlighting economic indicators vividly. From GDP growth, employment rates to industry-specific insights, make economic trends accessible. This template, beneficial for anyone addressing economic audiences, features intuitive graphics, state icons, and designated areas for relevant imagery, ensuring each economic facet is visually compelling and information-rich.


26 slides
Building Community Networks Presentation
Strengthen connections and foster collaboration with this engaging presentation on building community networks. Covering key topics like social engagement, resource sharing, grassroots initiatives, and digital networking, this template helps highlight strategies for creating meaningful relationships. Fully customizable and compatible with PowerPoint, Keynote, and Google Slides for a seamless and impactful presentation experience.


5 slides
Home Investment and Property Value Presentation
Visualize key real estate insights with this skyline-themed slide, ideal for showcasing home investment data and market value trends. Designed for realtors, analysts, or housing consultants, it features a cityscape layout for clear comparison. Fully editable in PowerPoint, Keynote, and Google Slides for effortless customization and polished presentations.


7 slides
College Statistics Infographic Presentation
A College Statistics Infographic is a visual representation of key data and statistics related to a college. This template can provide a quick and easy-to-understand overview of various aspects of the institution, such as enrollment figures, graduation rates, student demographics, and academic performance metrics. Featured are icons, illustrations, diagrams, and other design elements to enhance the visual appeal of this infographic and make it more engaging for your viewers. This template can be a useful tool for students, teachers, and others interested in learning more about a college.