


Features
- 5 Unique slides
- Fully editable and easy to edit in Microsoft Powerpoint, Keynote and Google Slides
- 16:9 widescreen layout
- Clean and professional designs
- Export to JPG, PDF or send by email


Do you have any questions?
Recommend


5 slides
Customer Experience Empathy Map Presentation
Enhance Customer Understanding with the Empathy Map Presentation! This Customer Experience Empathy Map template is designed to help businesses visualize customer needs, thoughts, emotions, and behaviors for improved engagement and strategy. Featuring a clear quadrant-based layout, this template allows you to map out customer insights, pain points, and expectations for more effective decision-making. Ideal for marketers, UX designers, and business strategists, this fully editable template is compatible with PowerPoint, Keynote, and Google Slides, making


7 slides
5G Benefits Infographic
Step into the ultra-fast world of 5G with our vibrant 5G benefits infographic. Set against a lively pink backdrop with bursts of other vivid colors, this infographic captures the essence of dynamism and speed. Sleek icons paired with concise descriptions highlight the myriad advantages of 5G, from lightning-fast downloads to broader bandwidth. This modern, innovative infographic is ideal for telecom companies, tech enthusiasts, businesses leveraging 5G, and educators discussing modern communication technologies. Designed for adaptability, it's compatible with PowerPoint, Keynote, and Google Slides.


20 slides
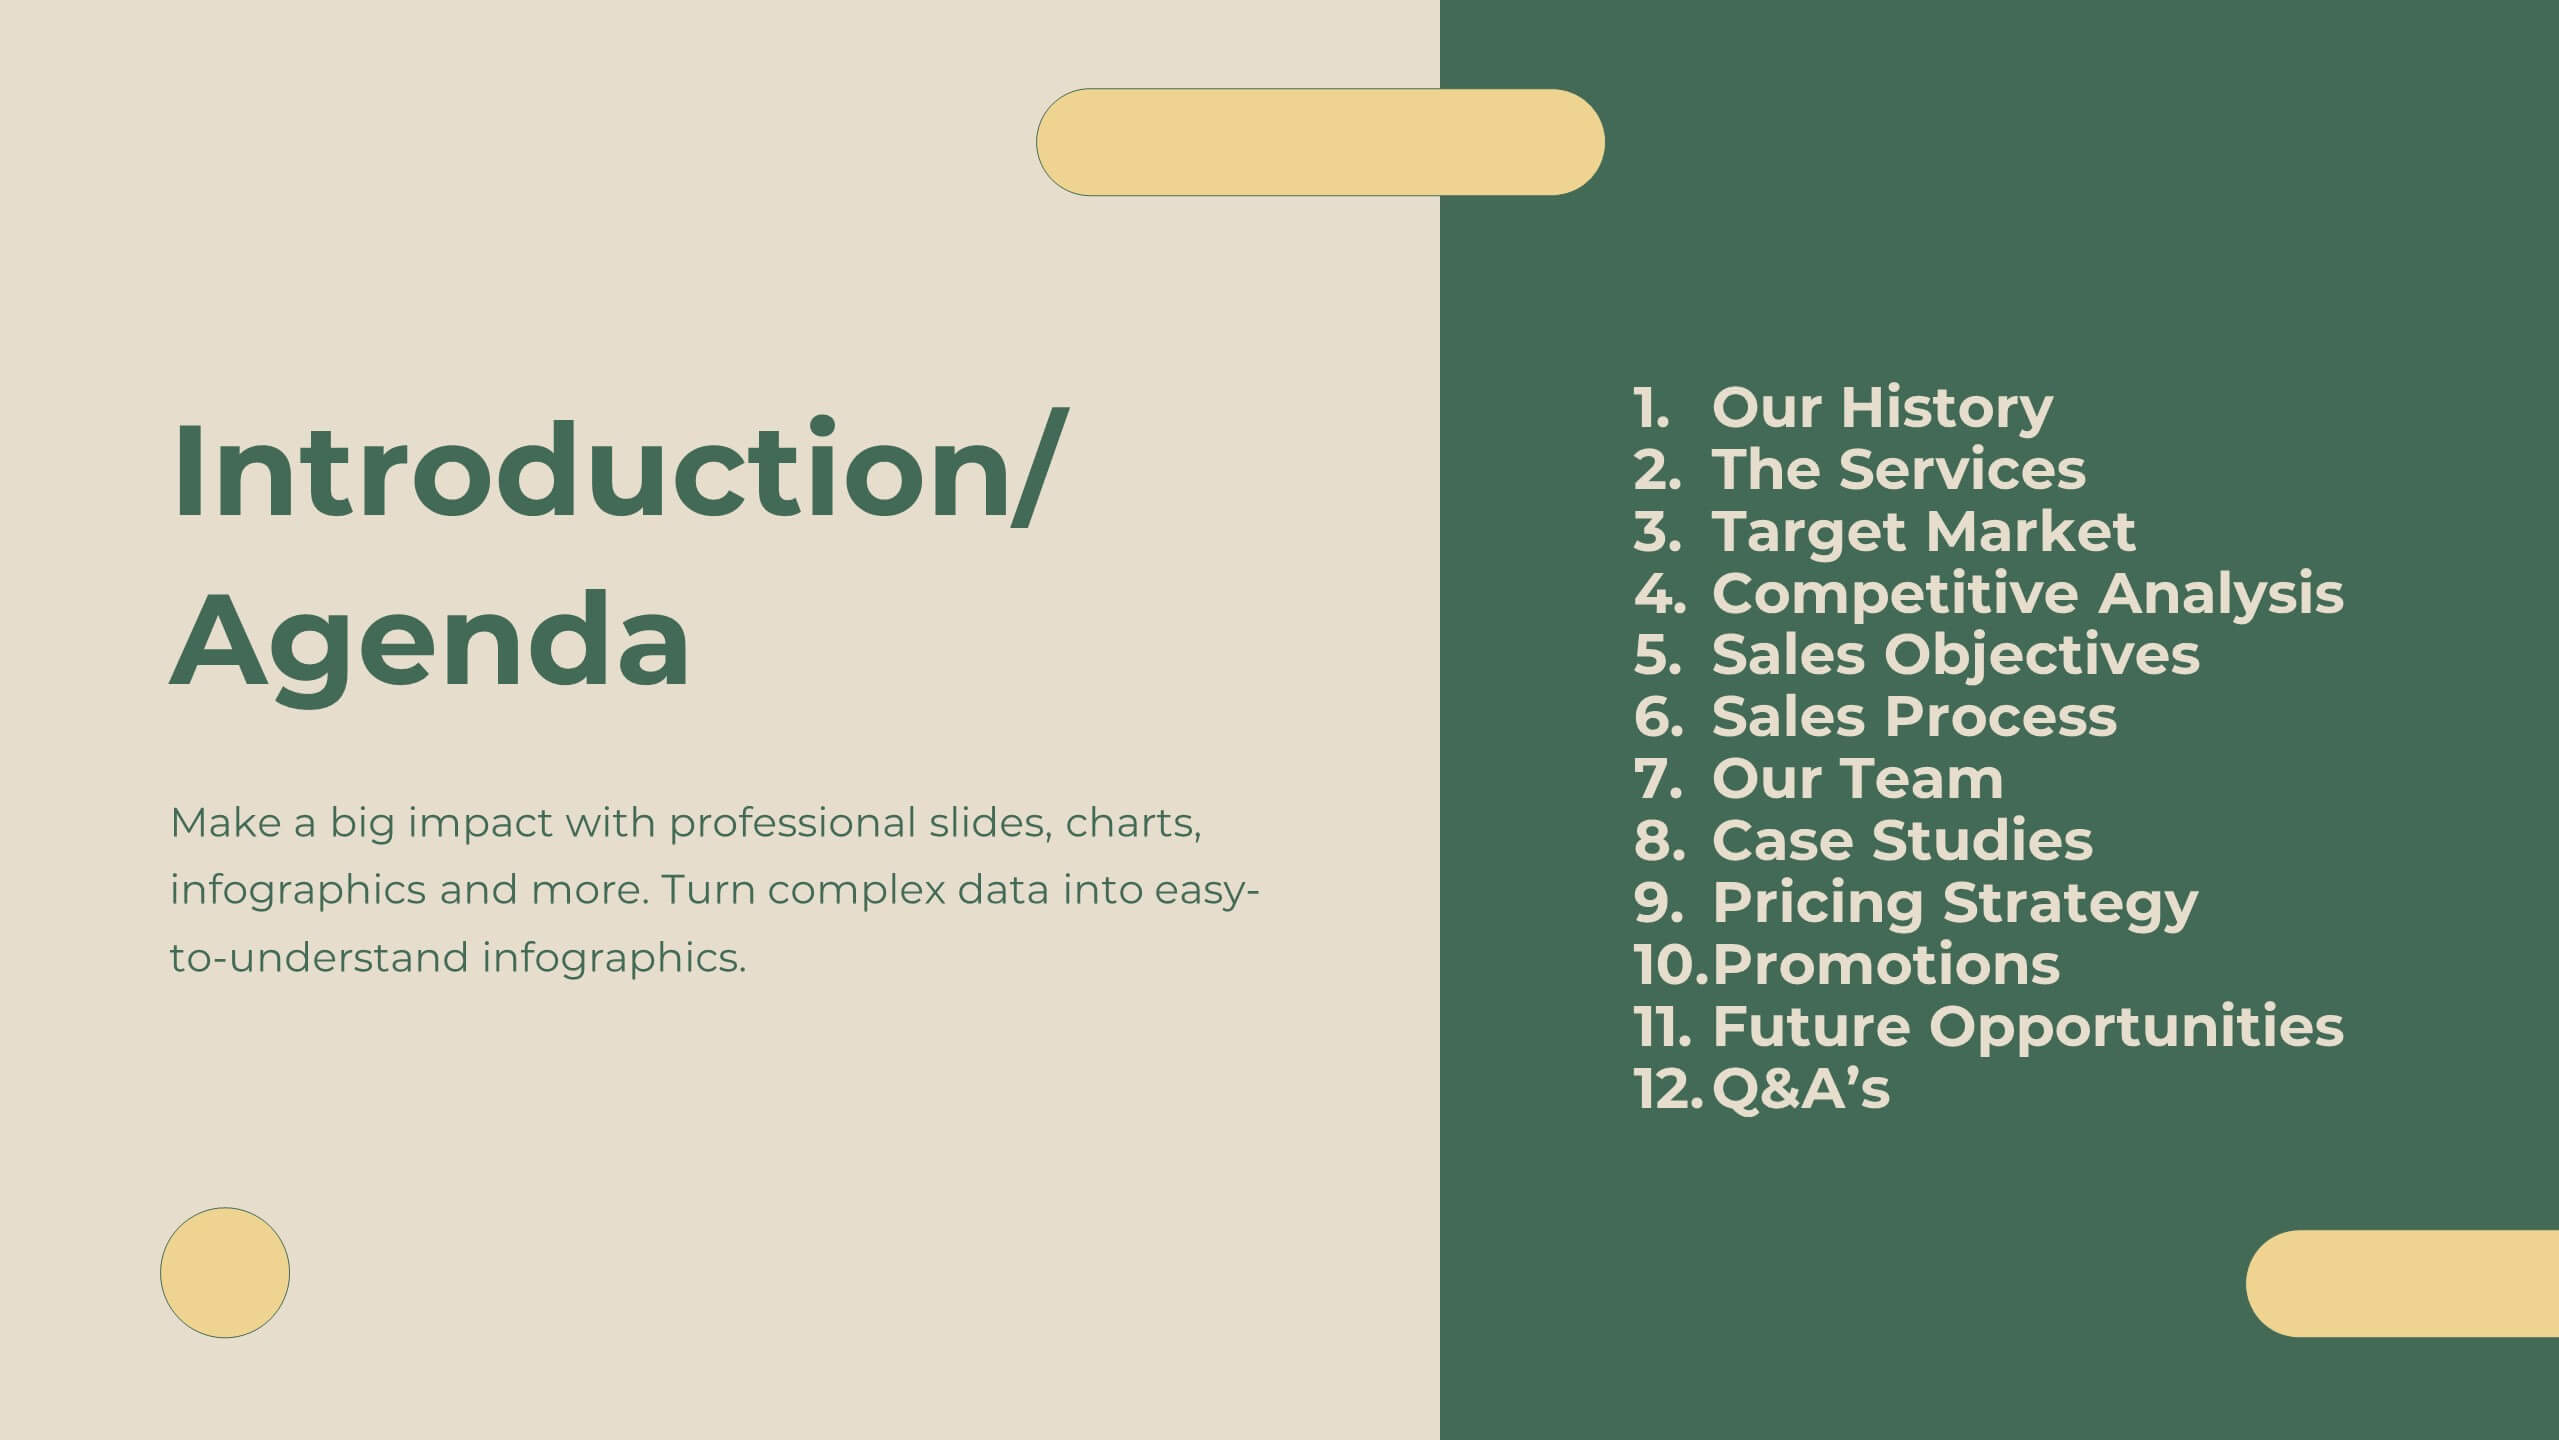
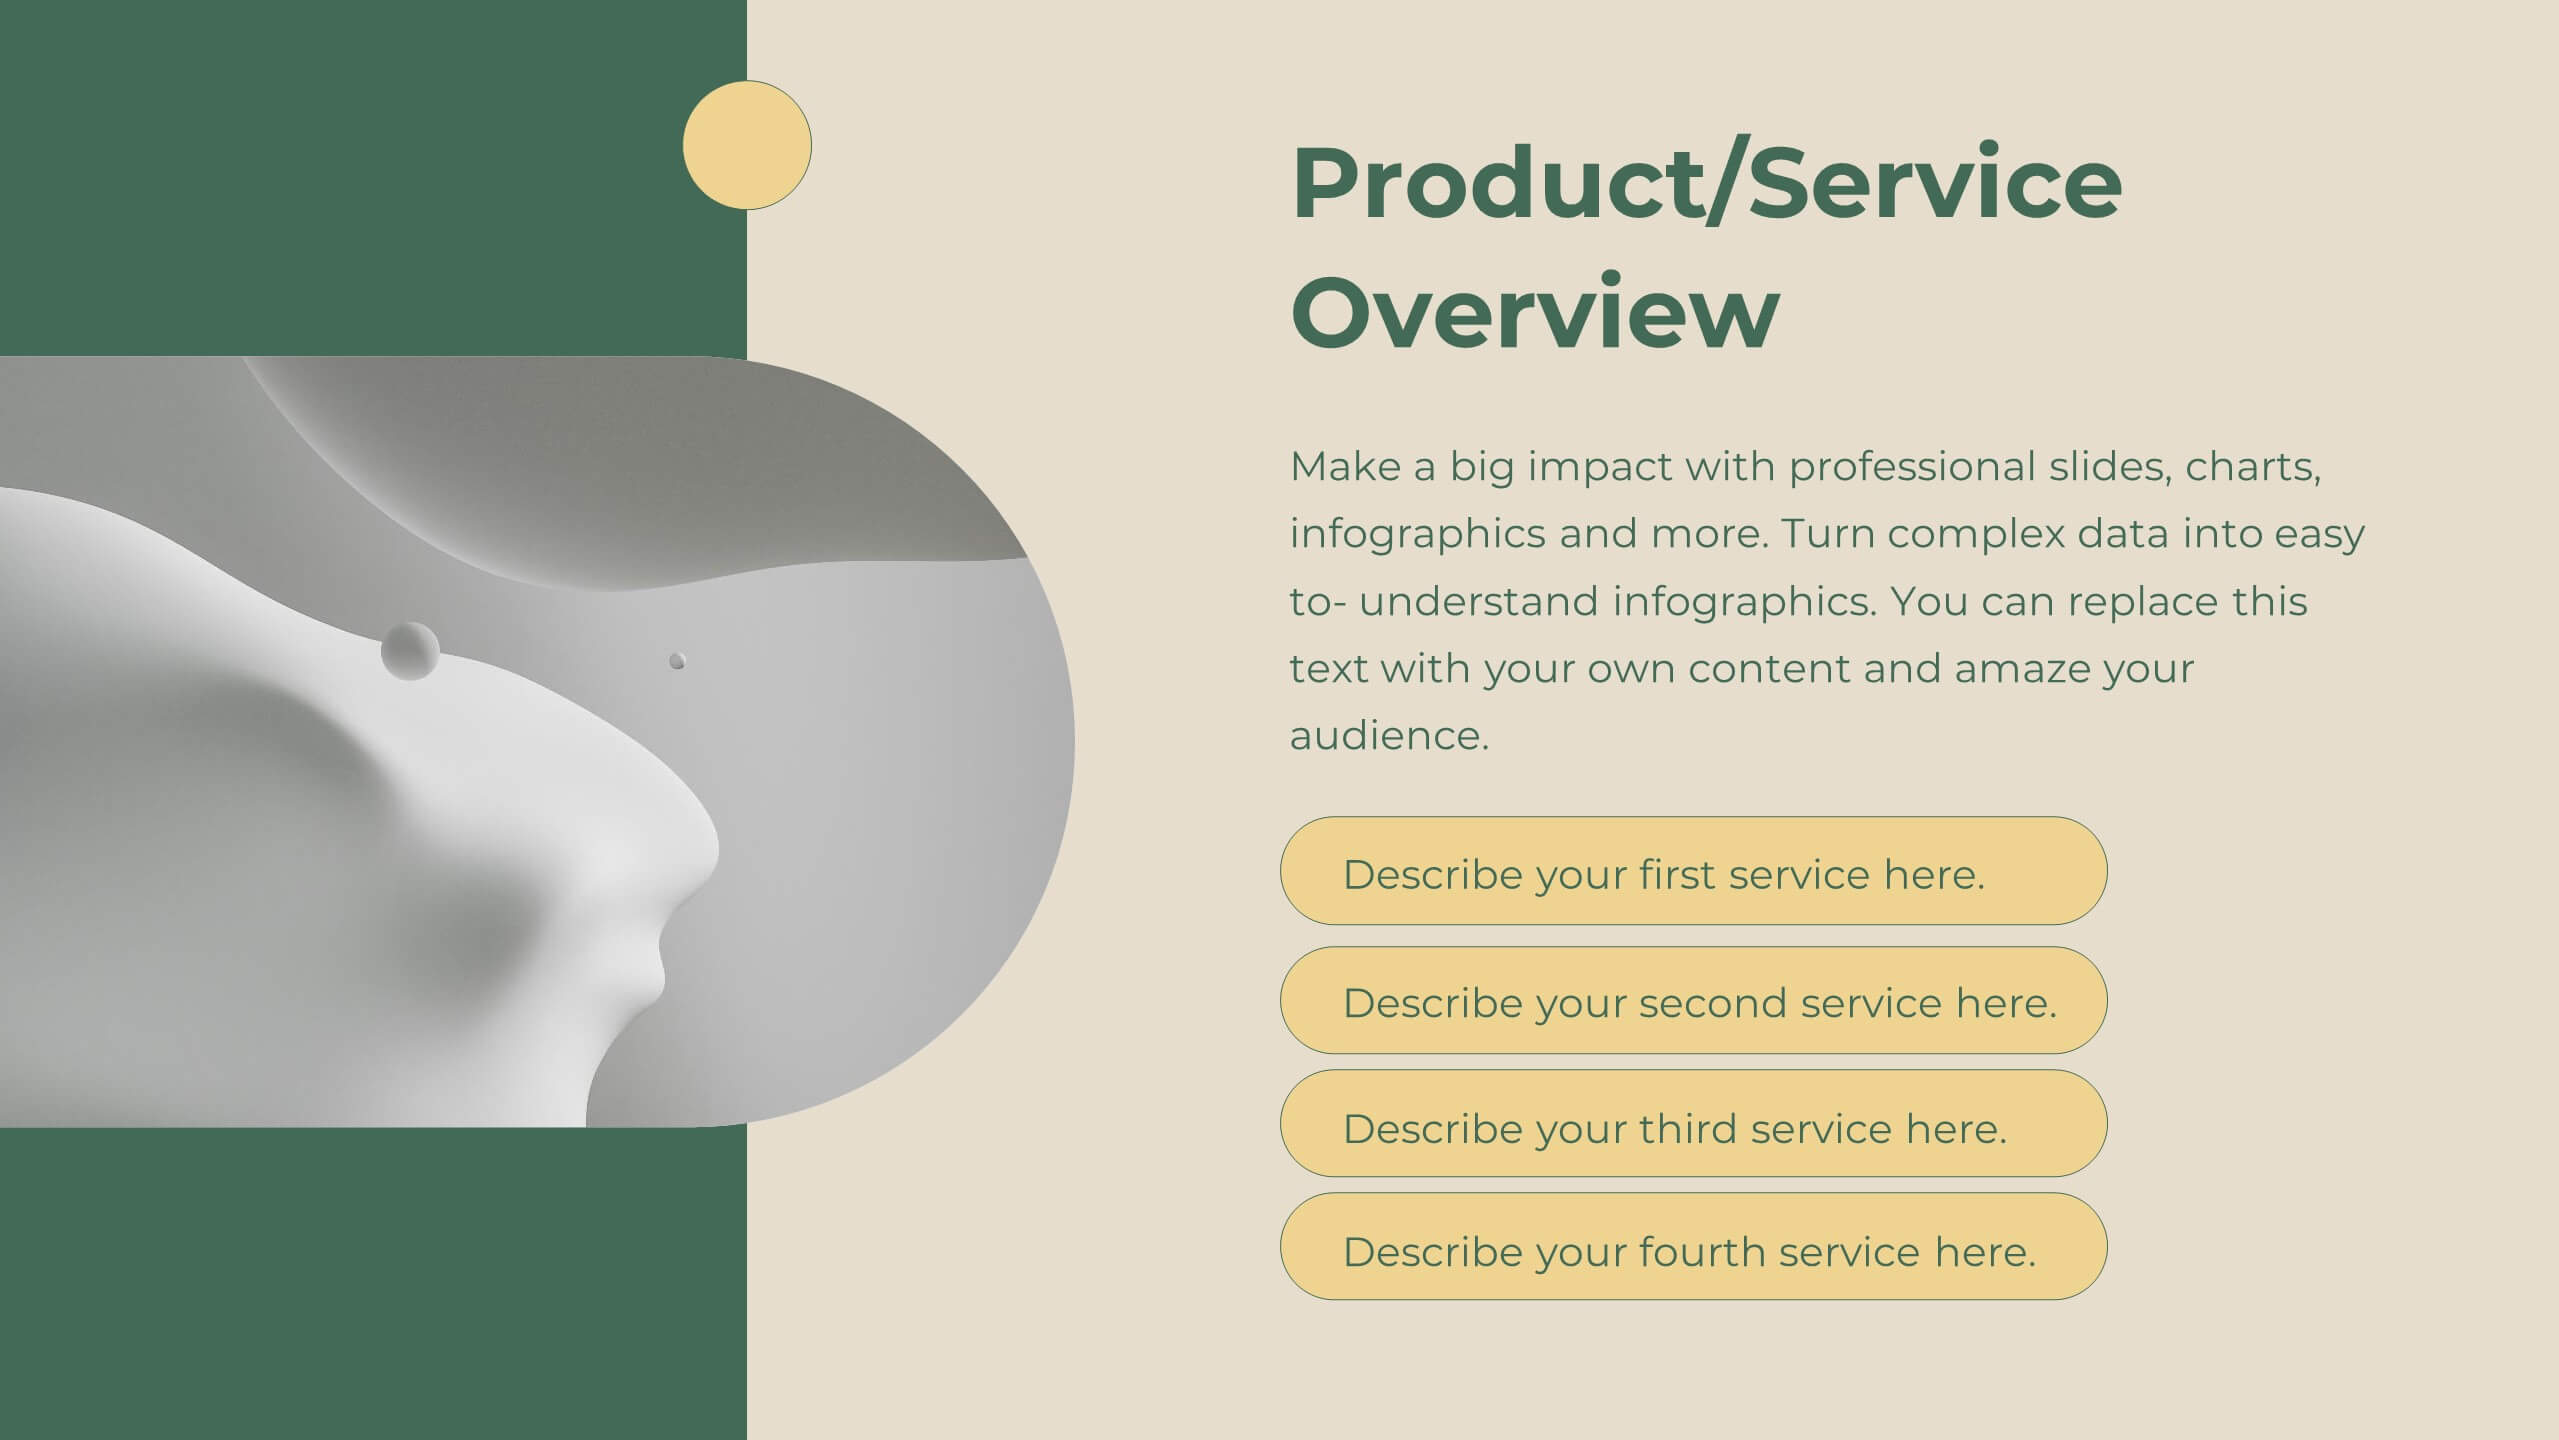
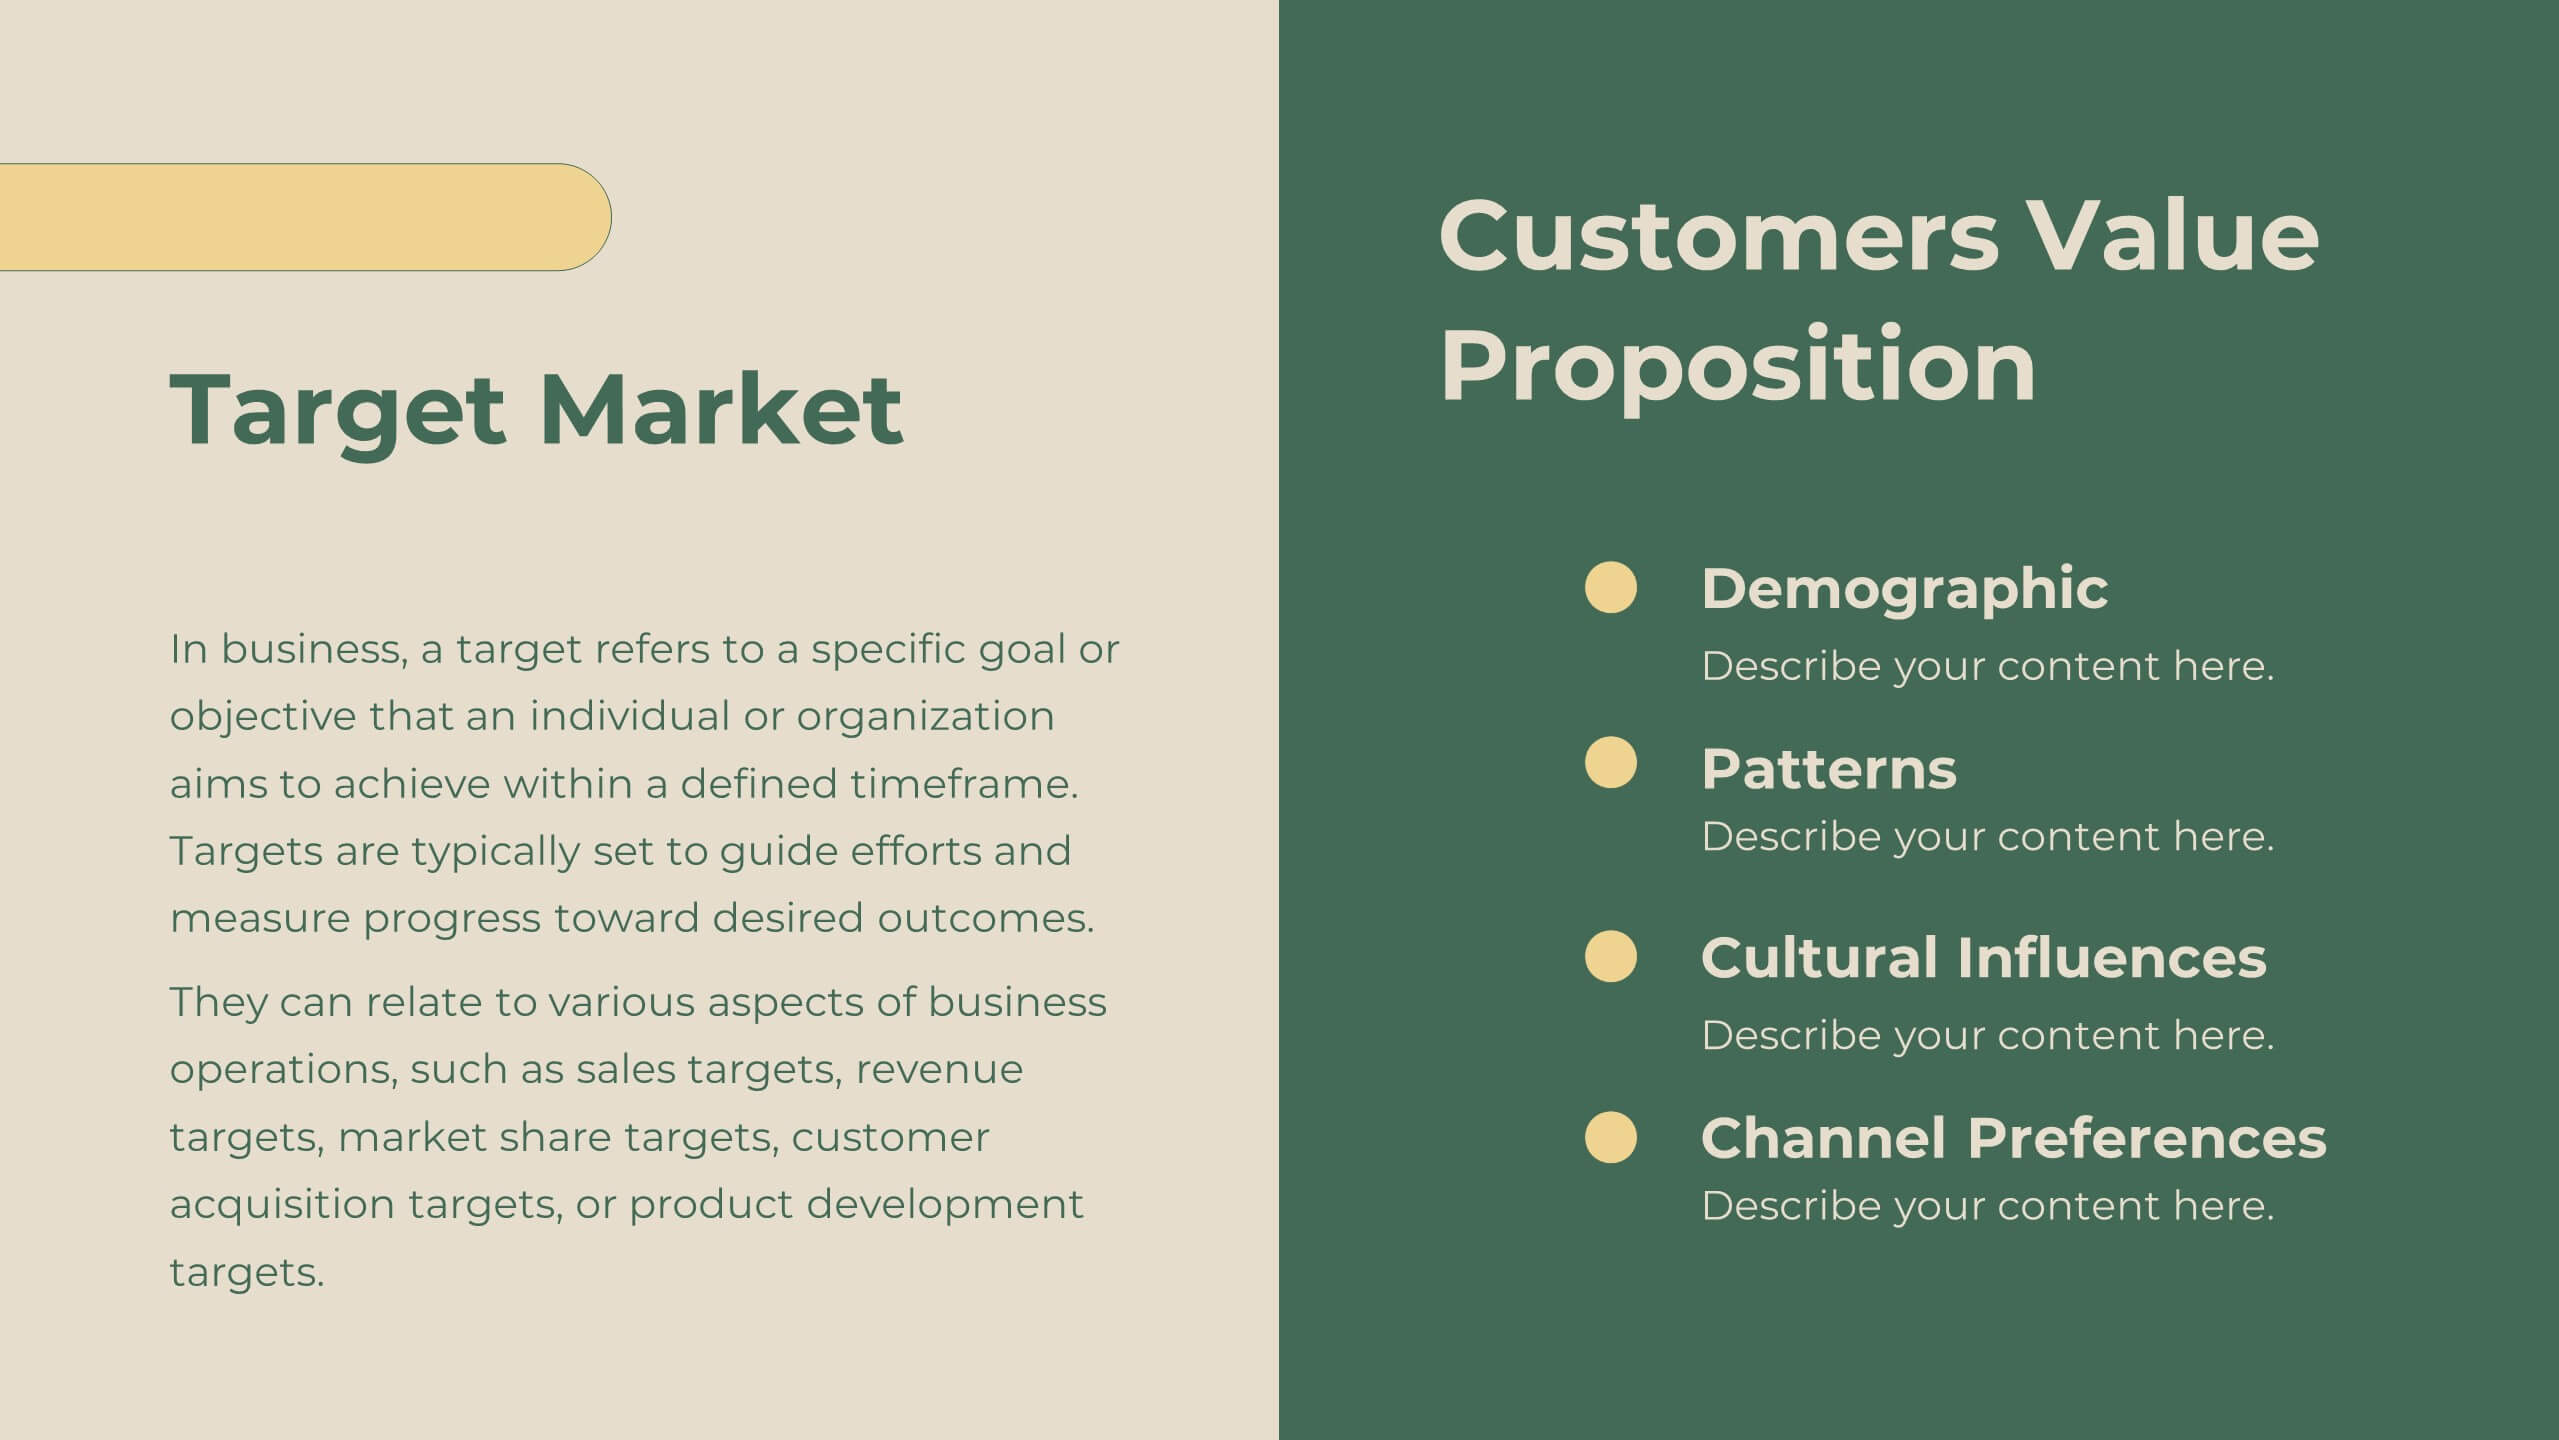
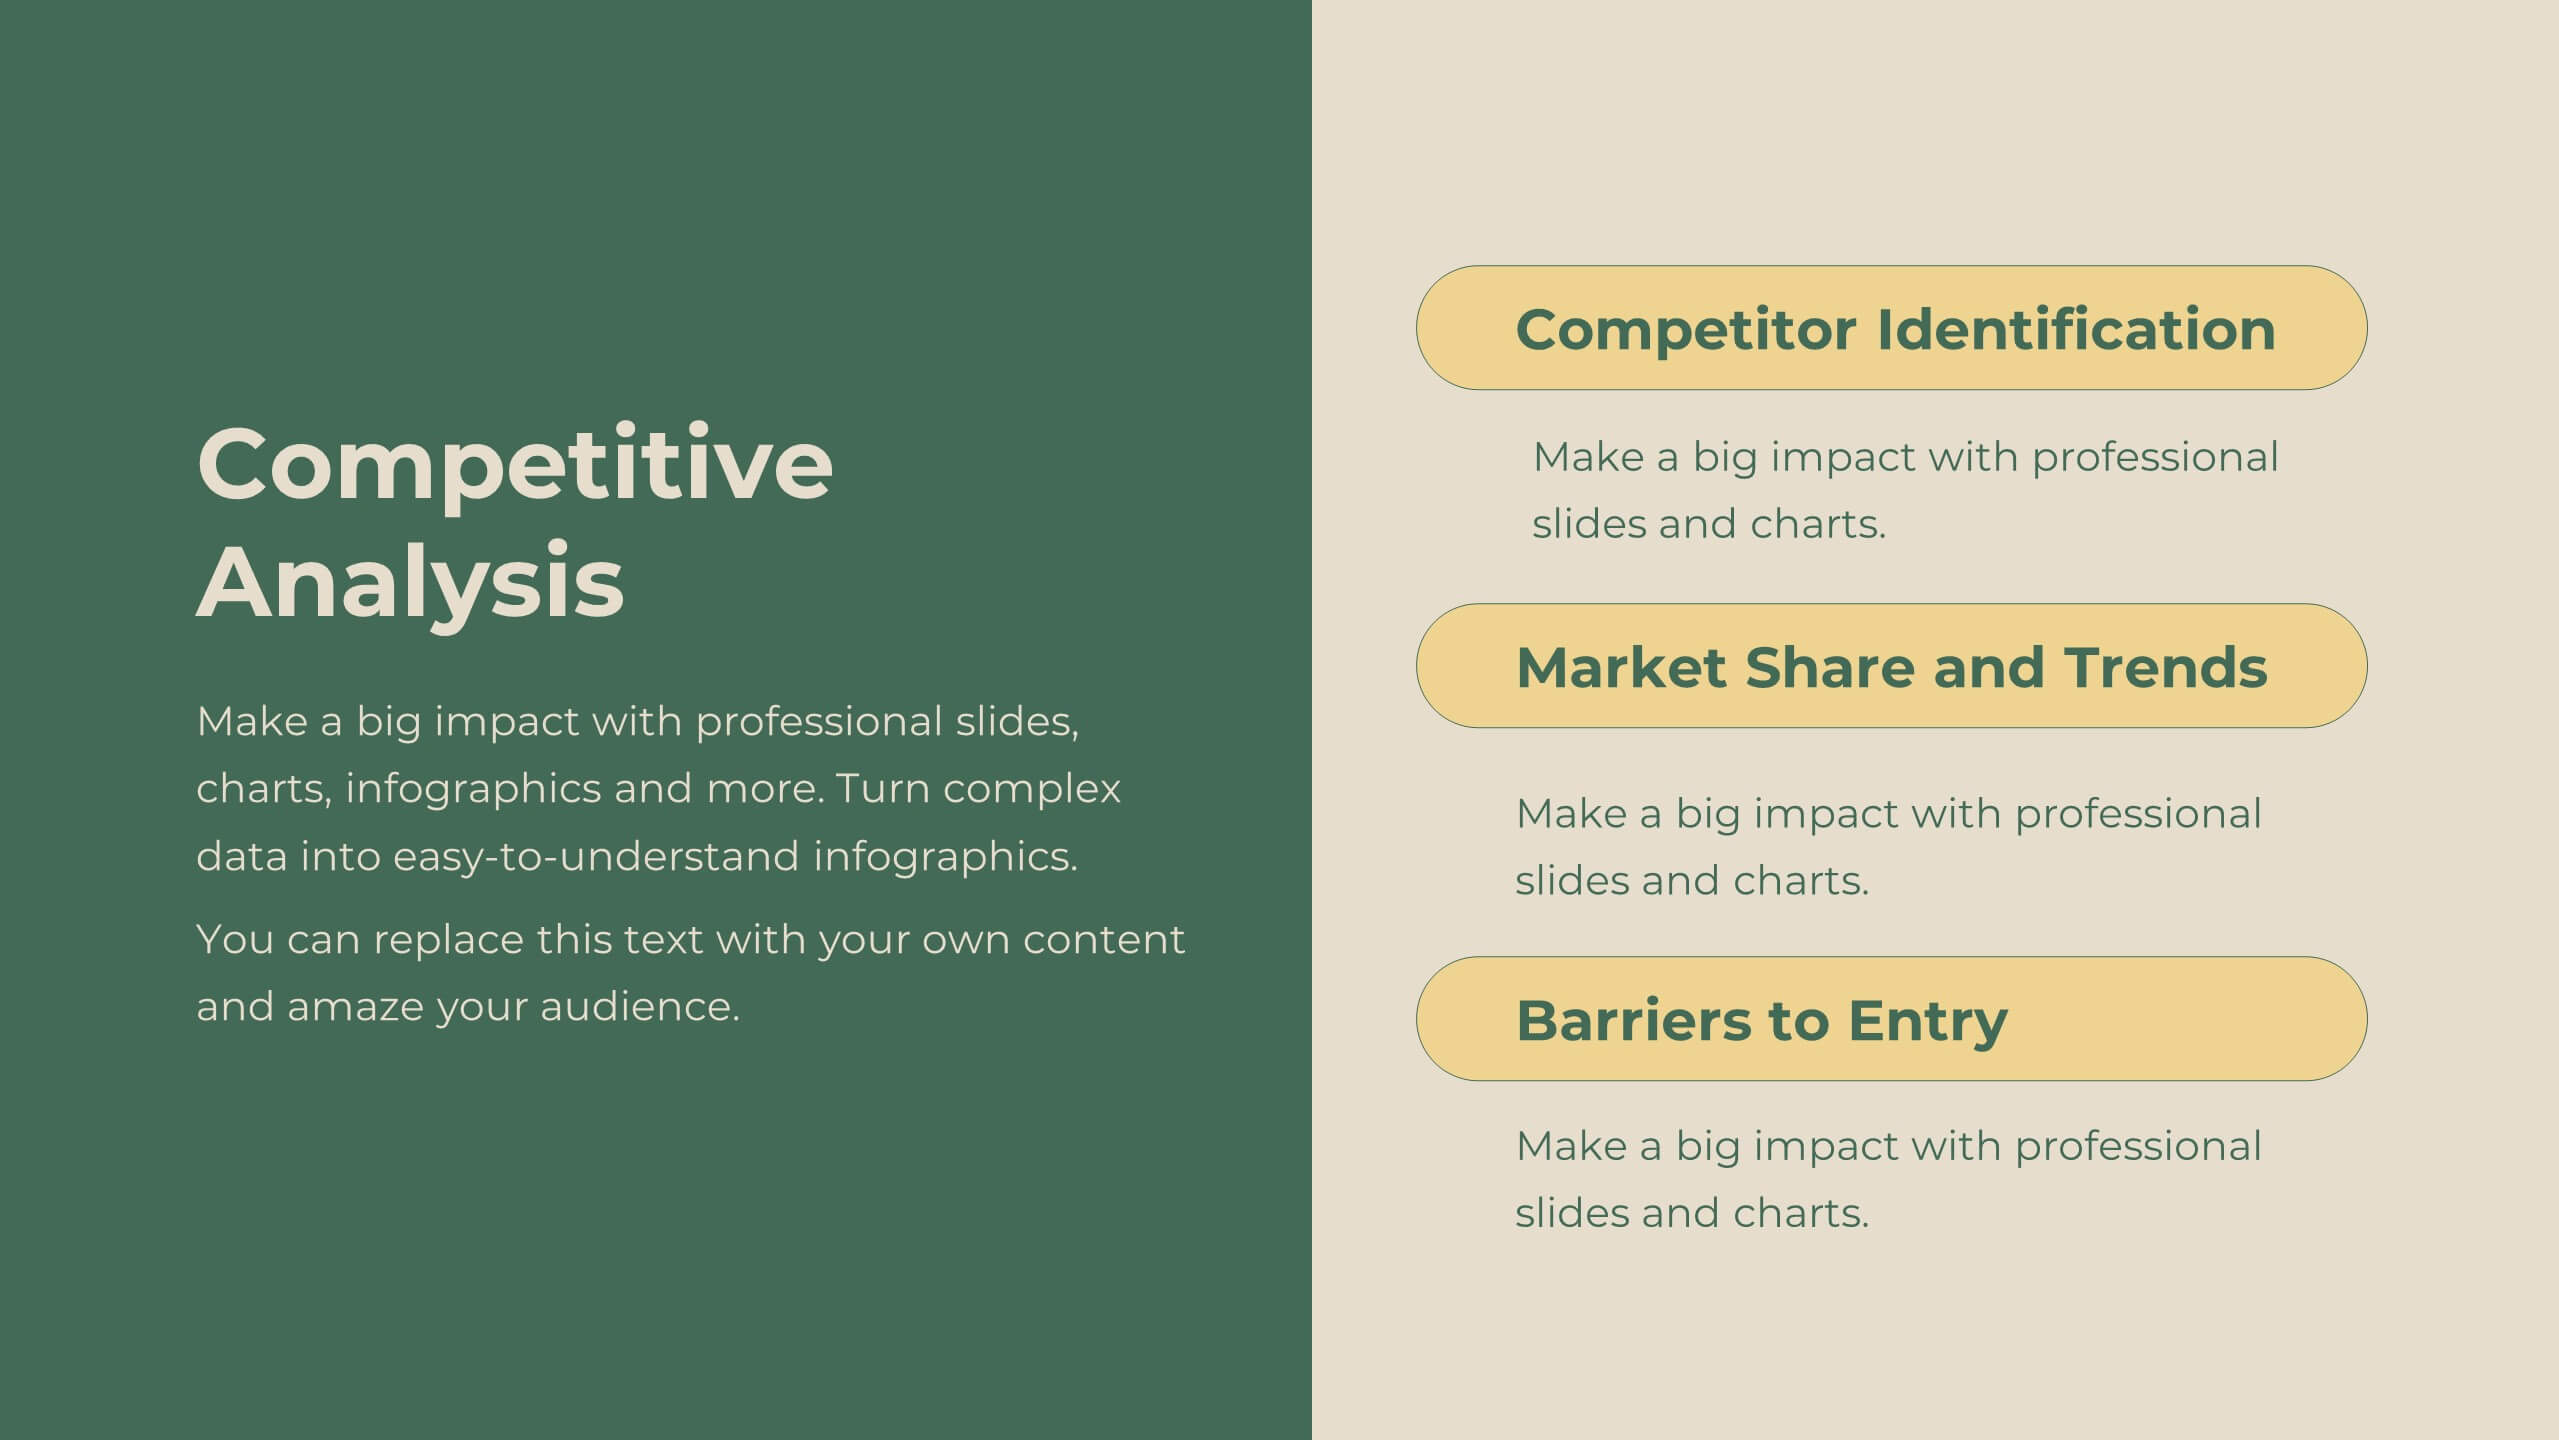
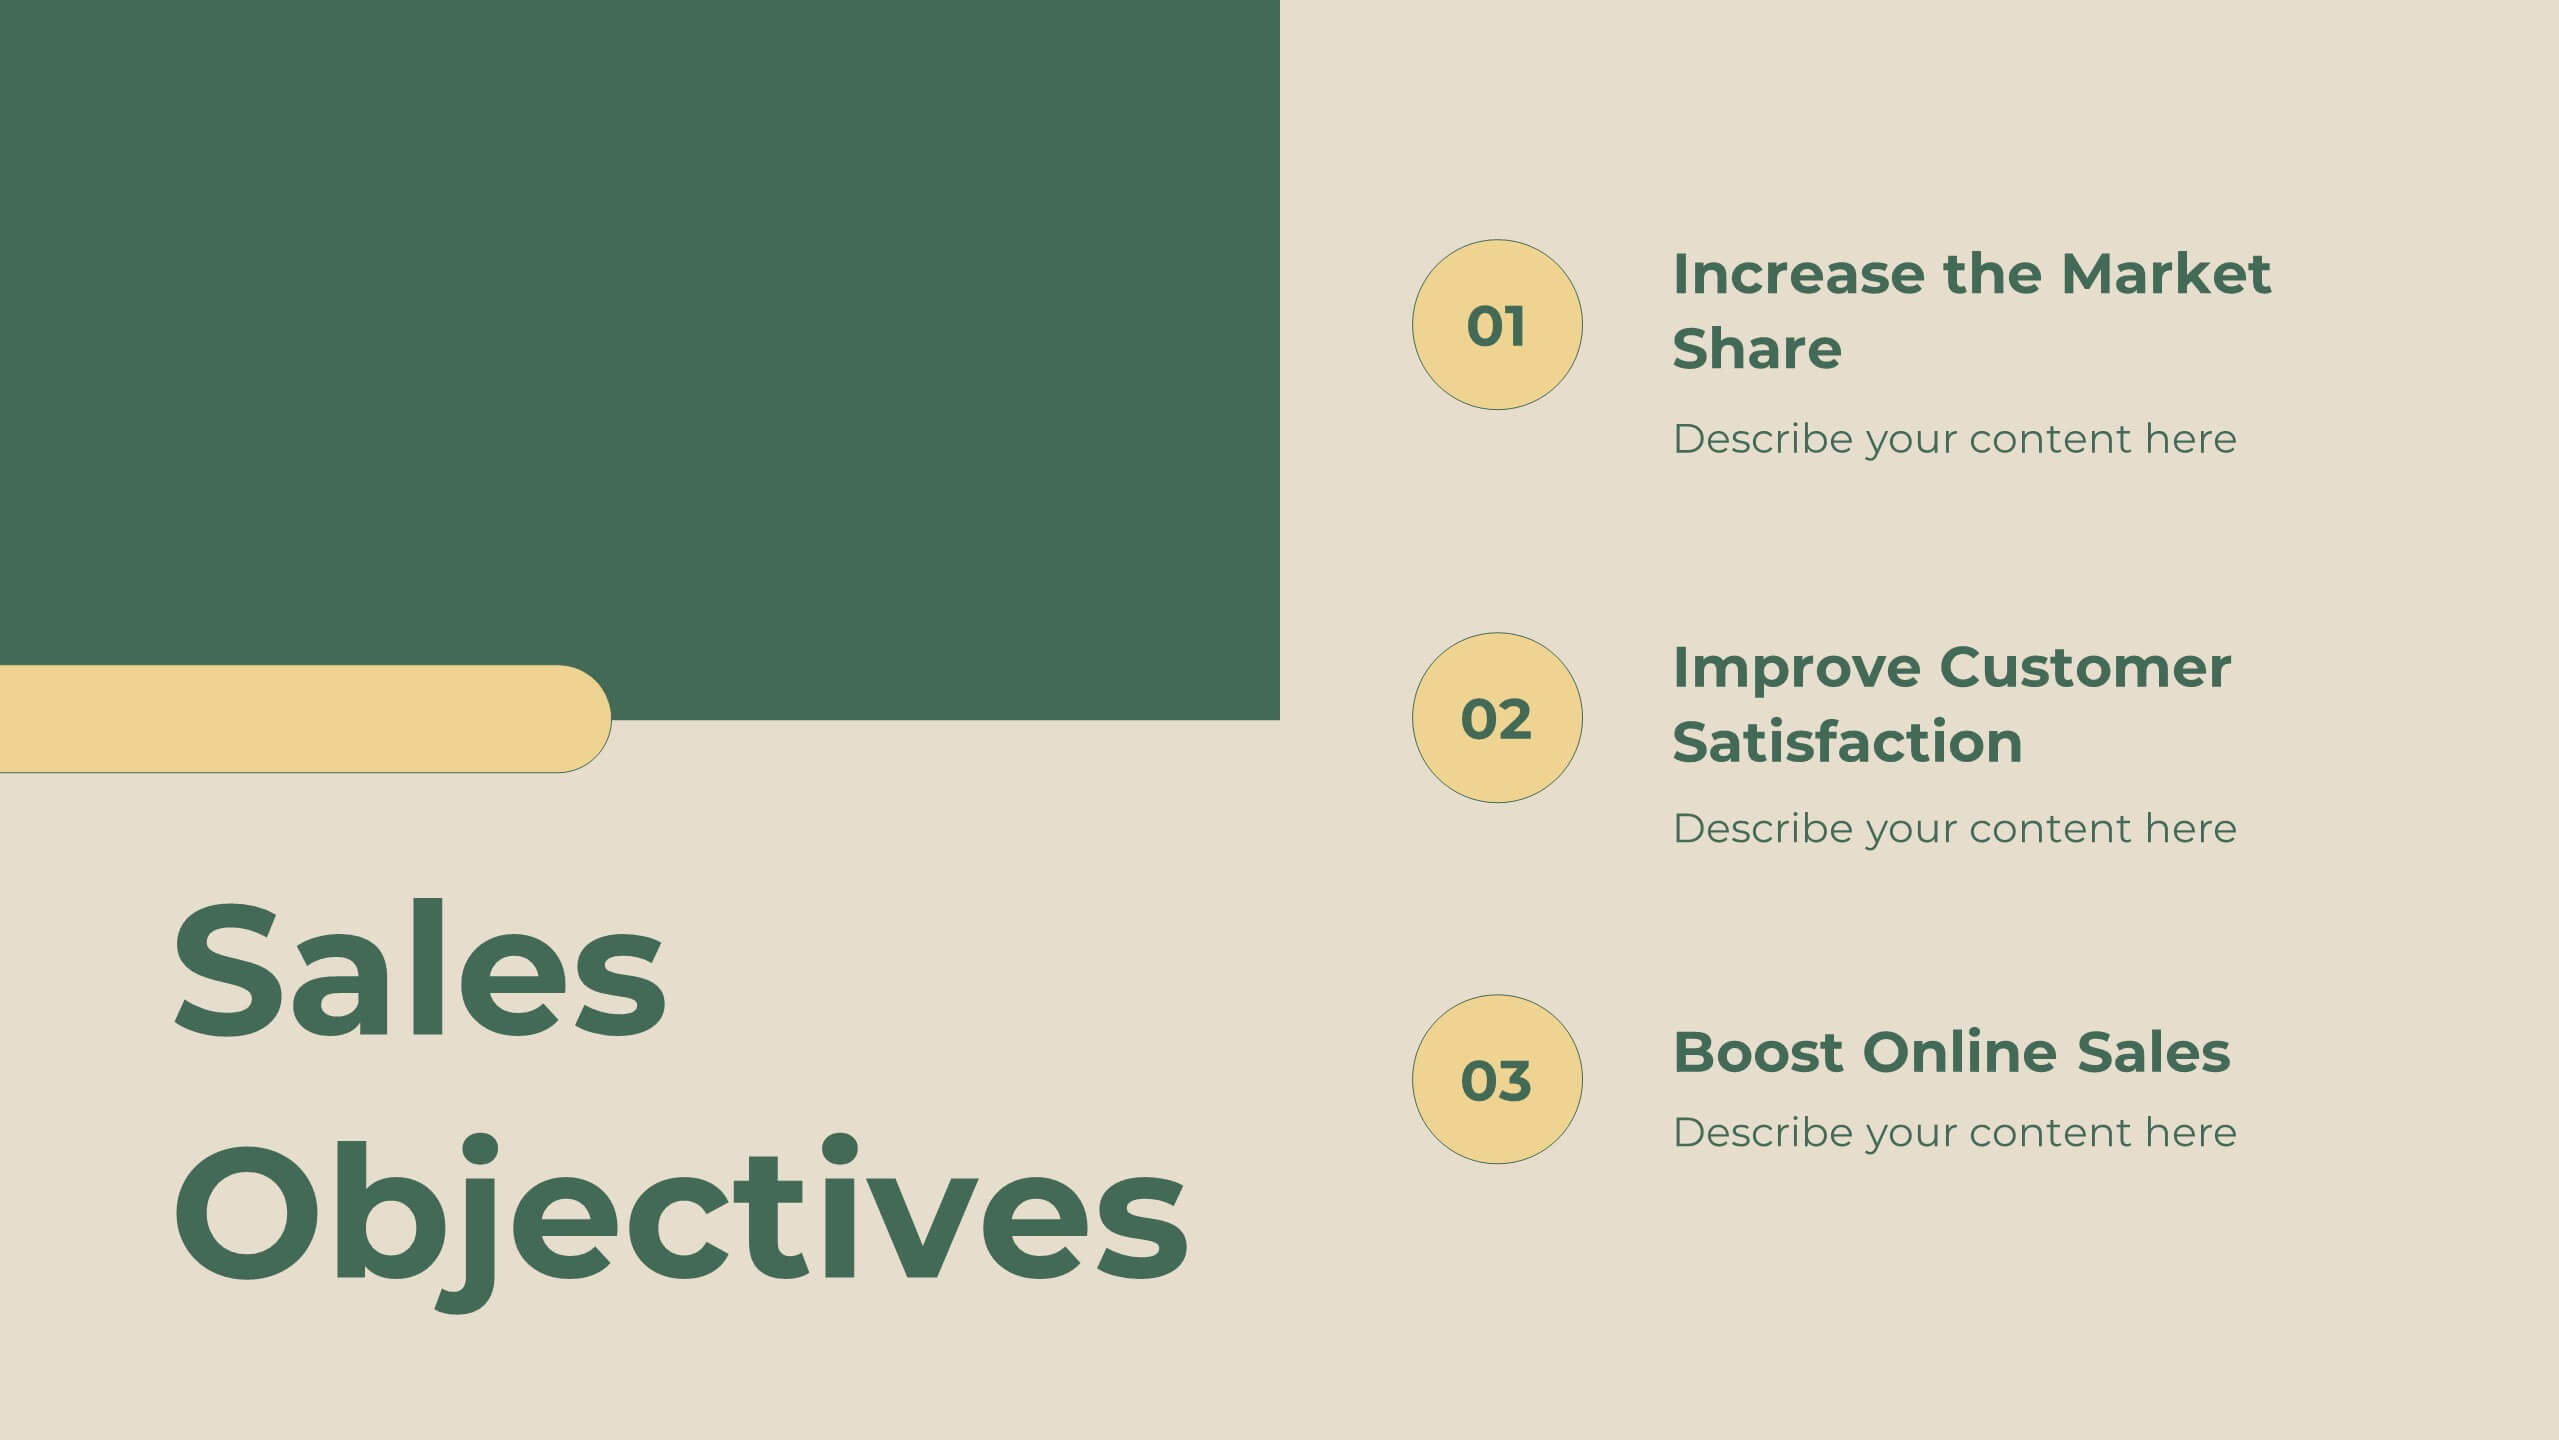
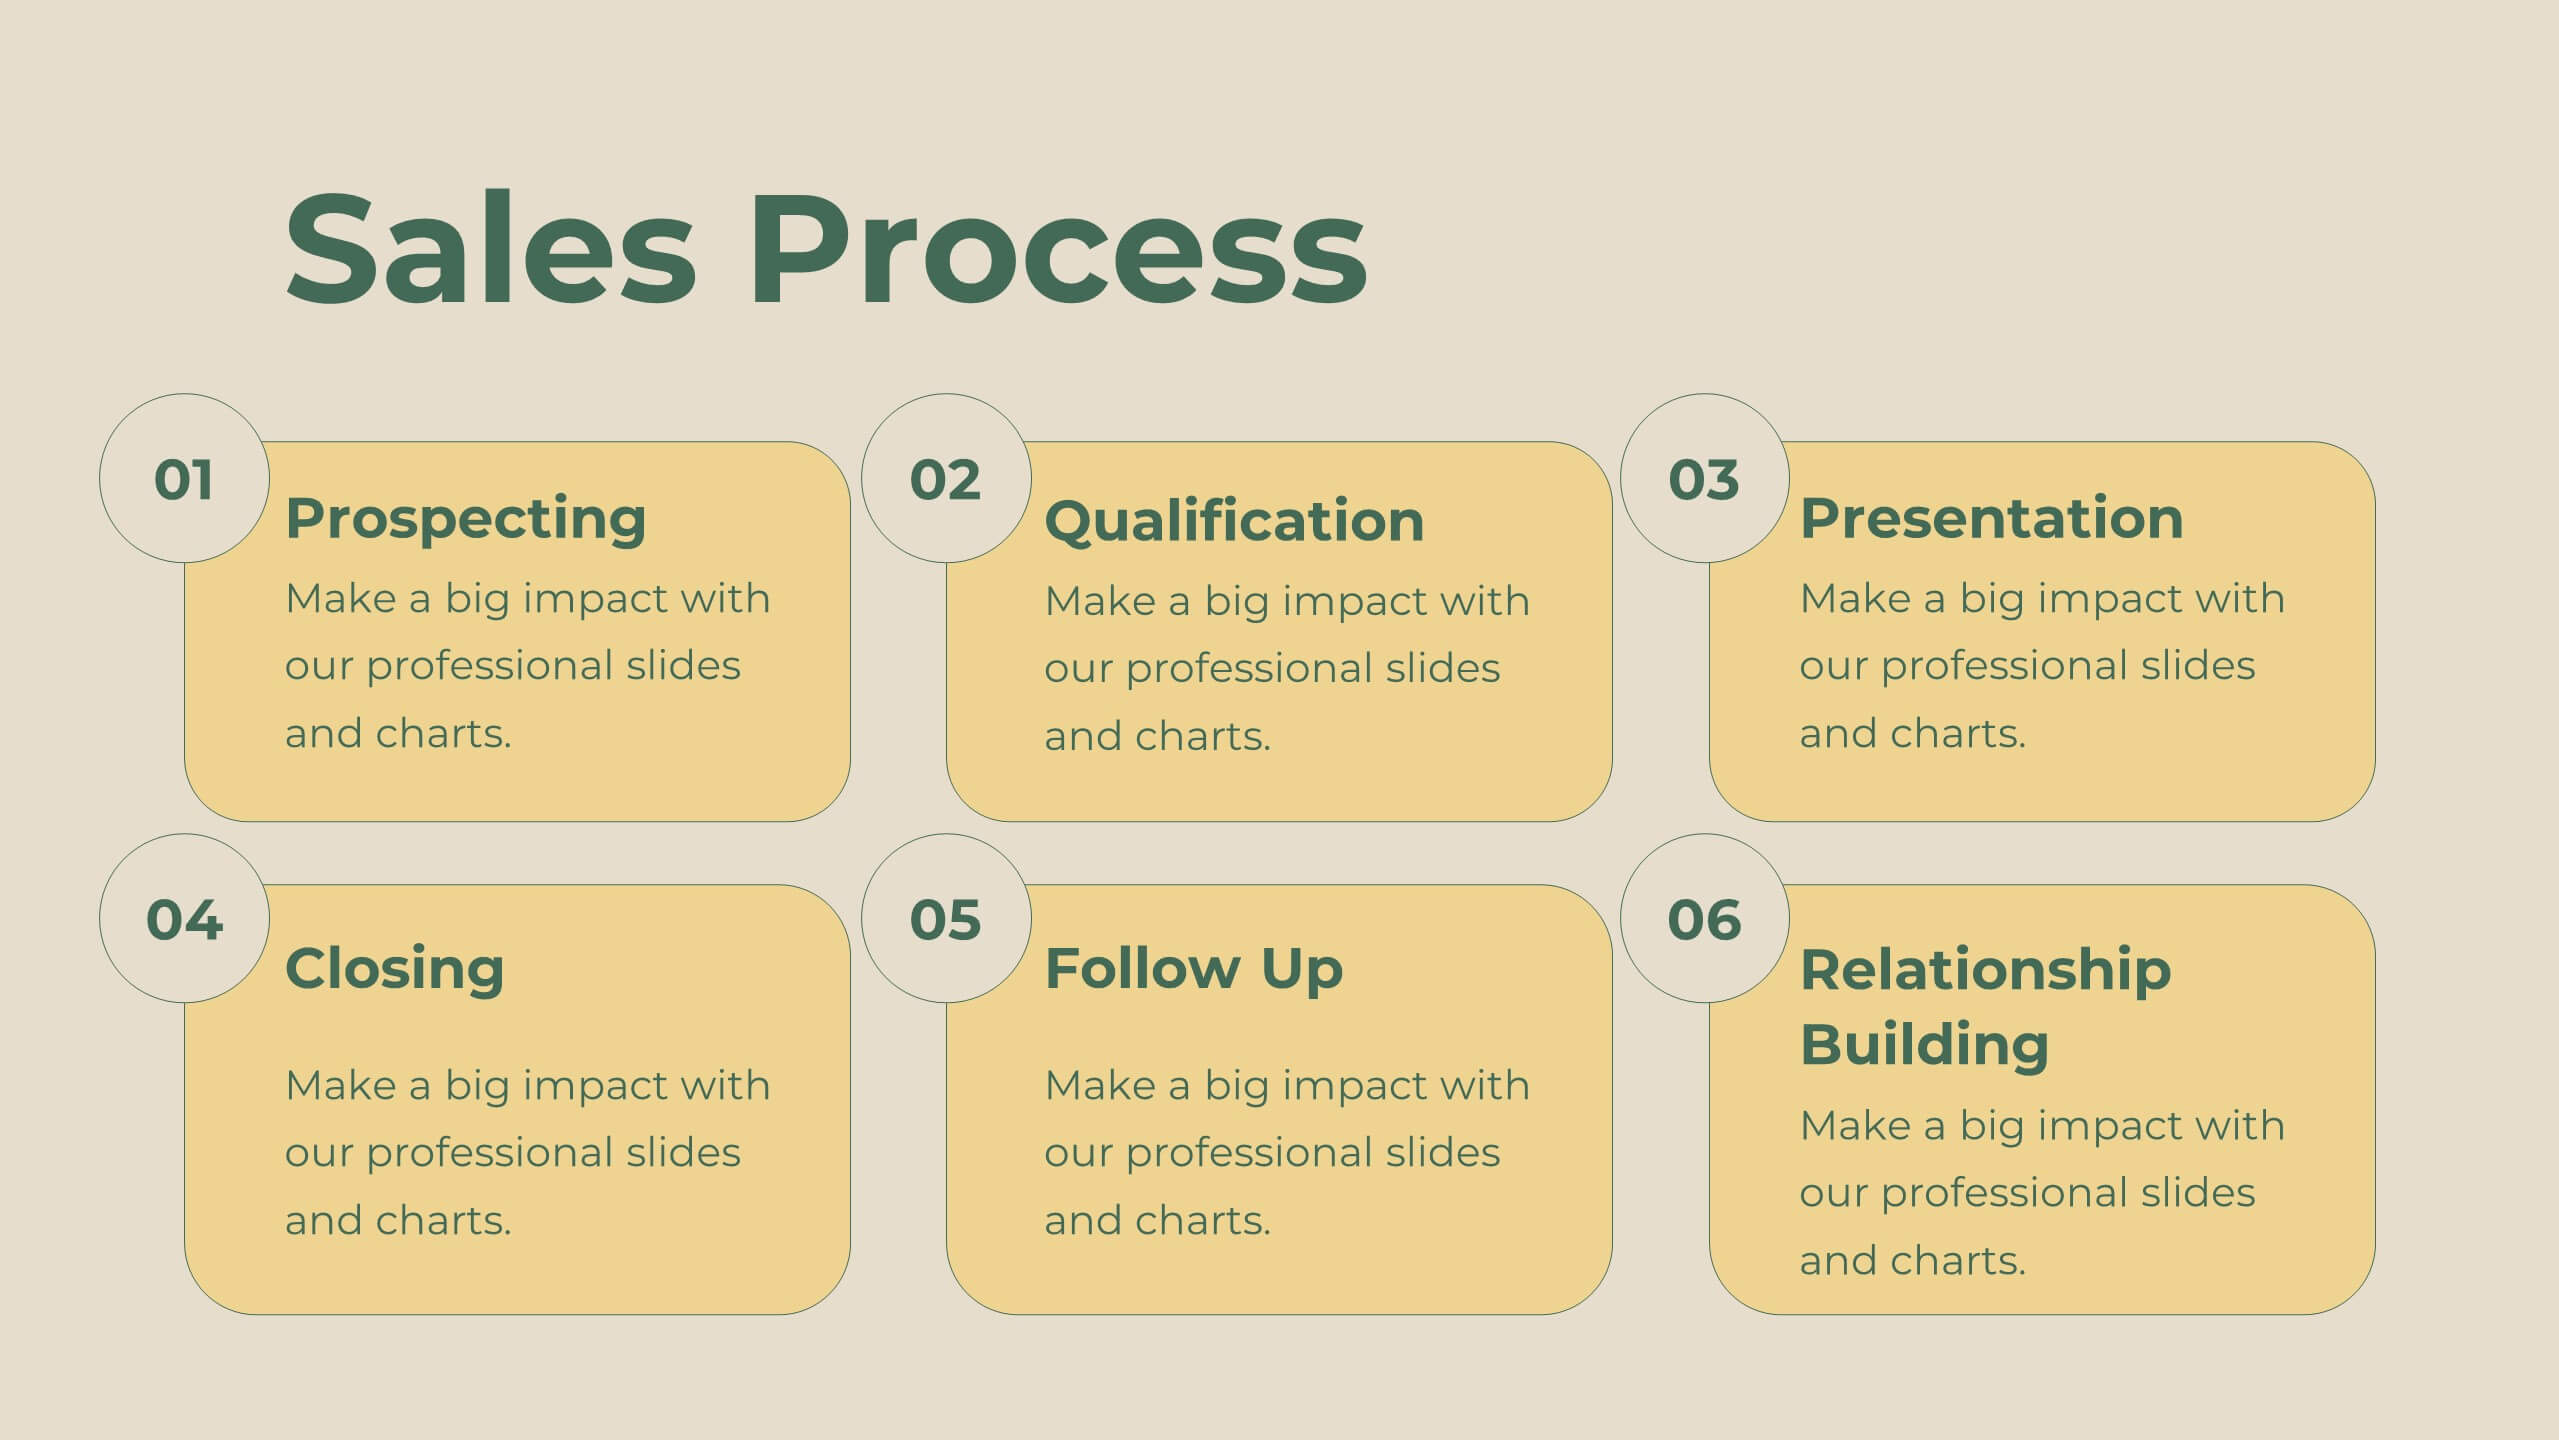
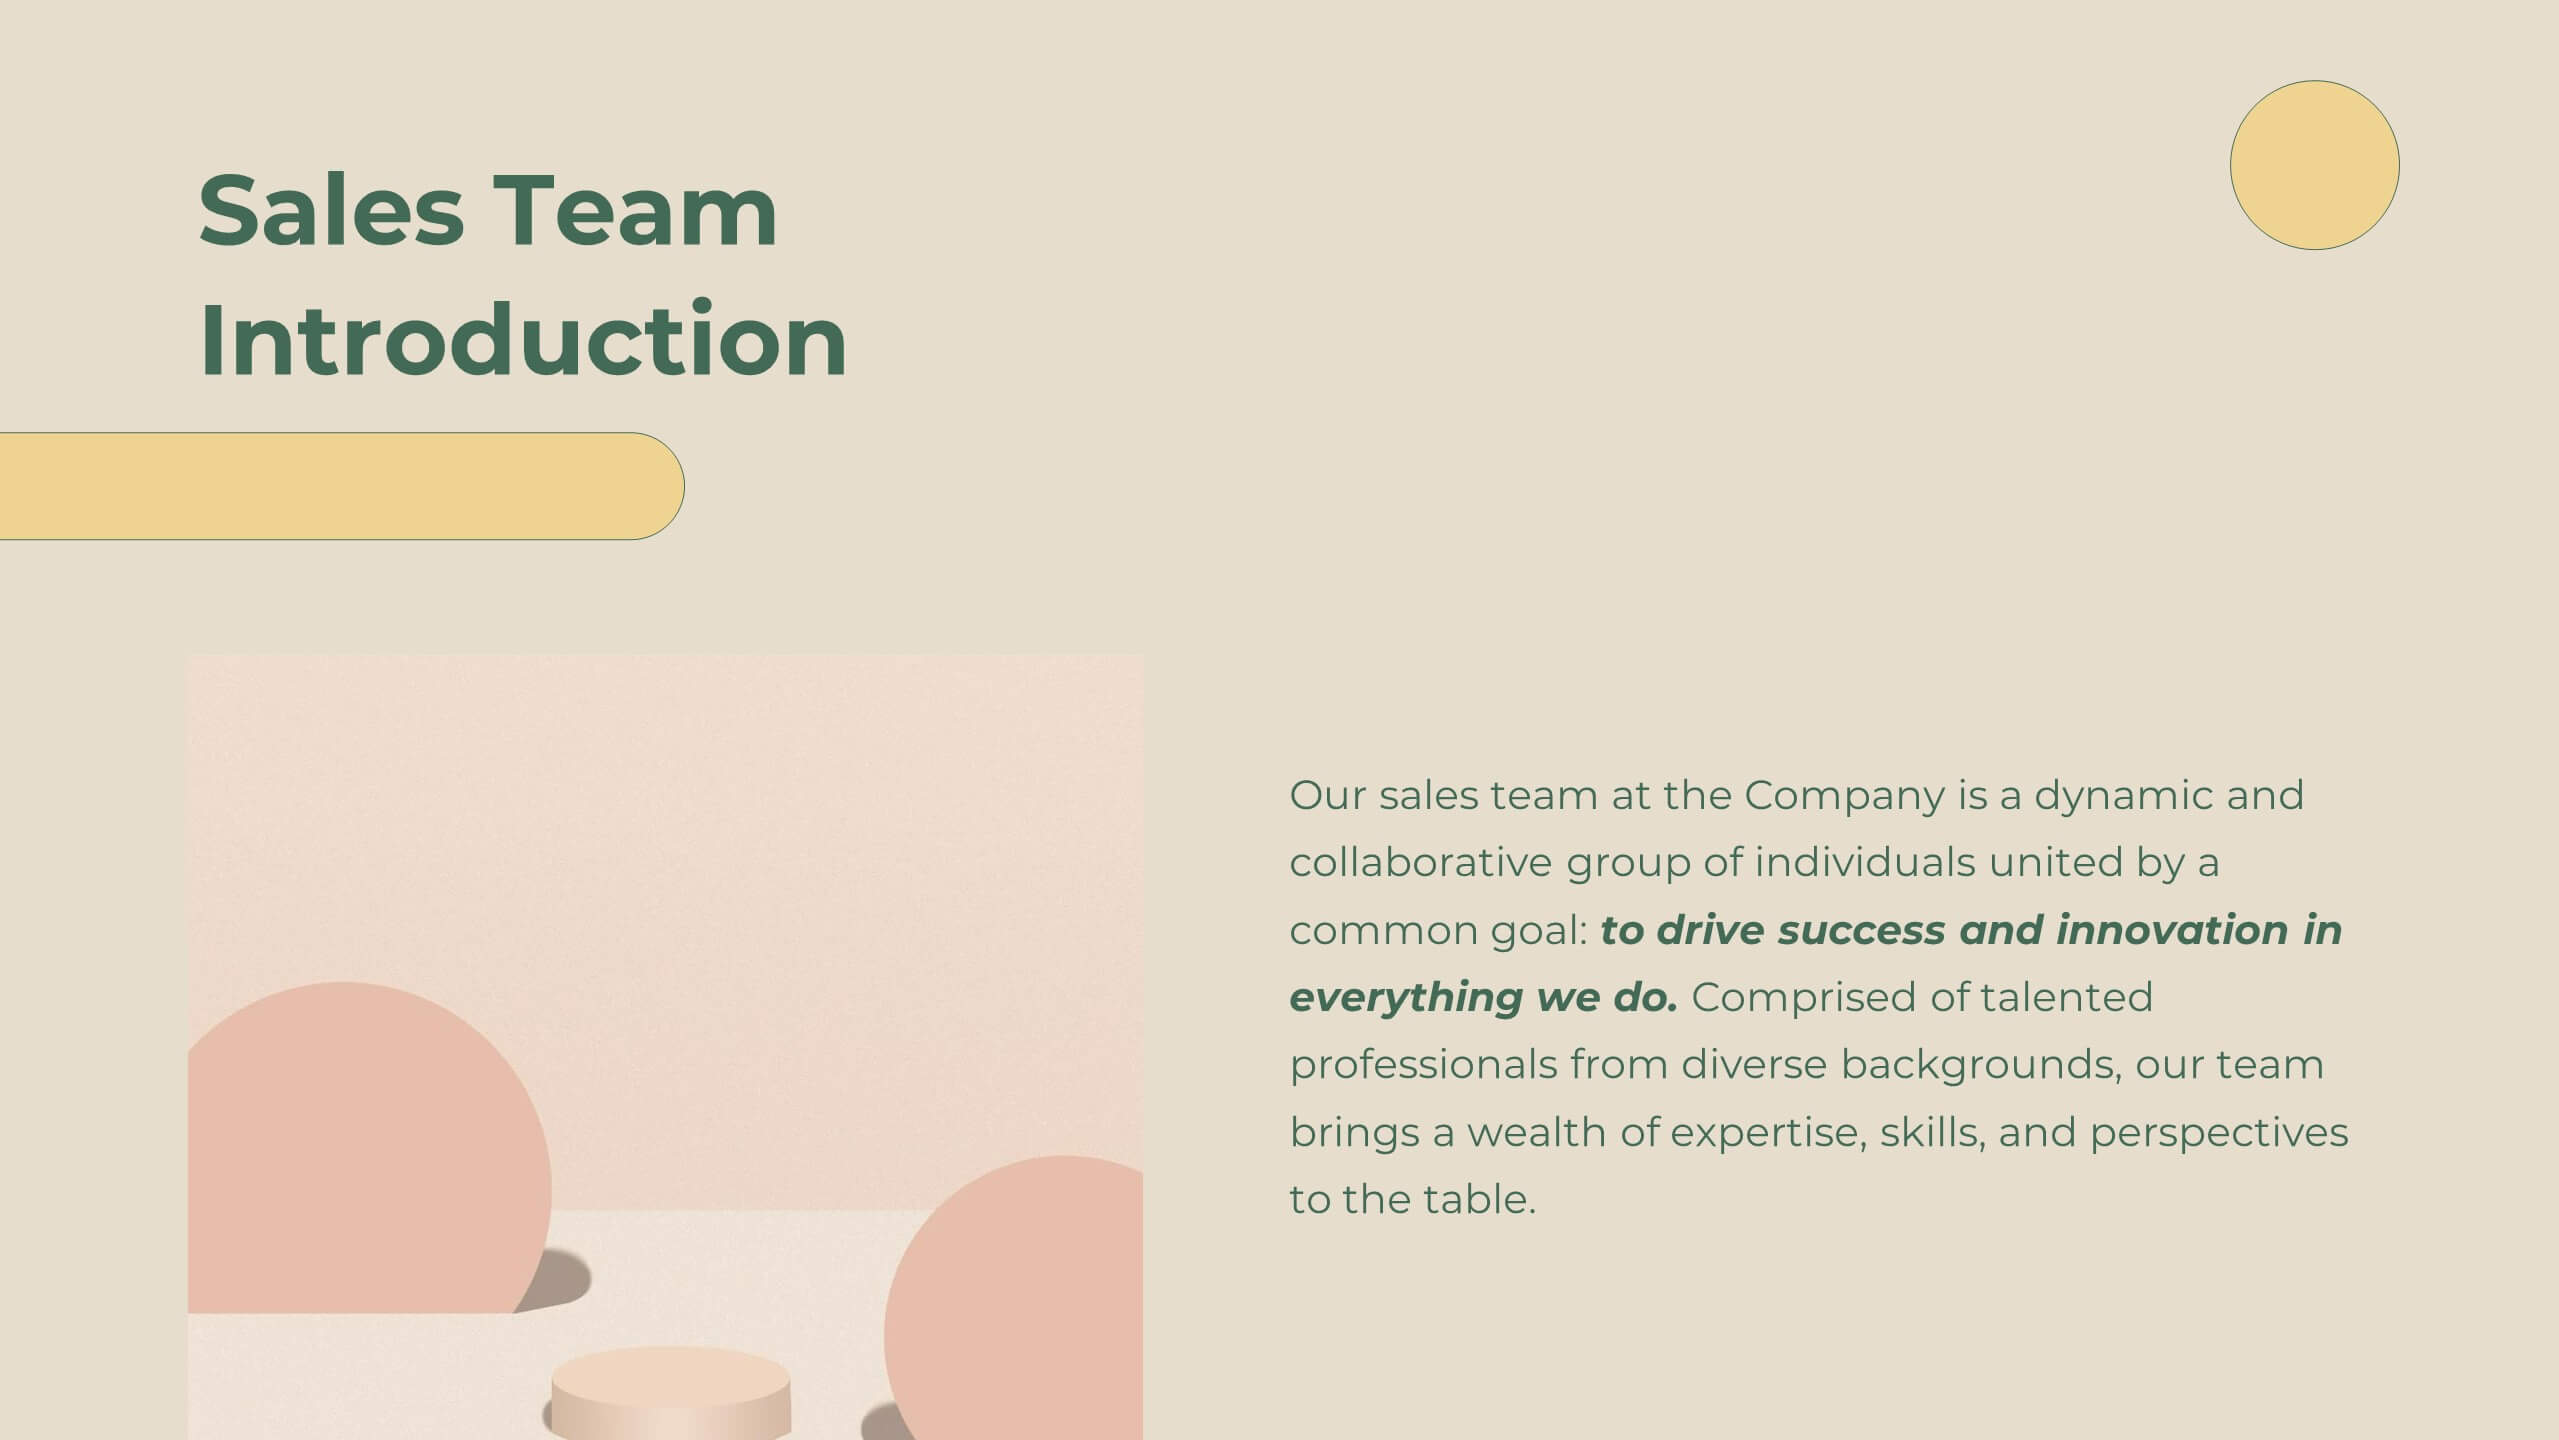
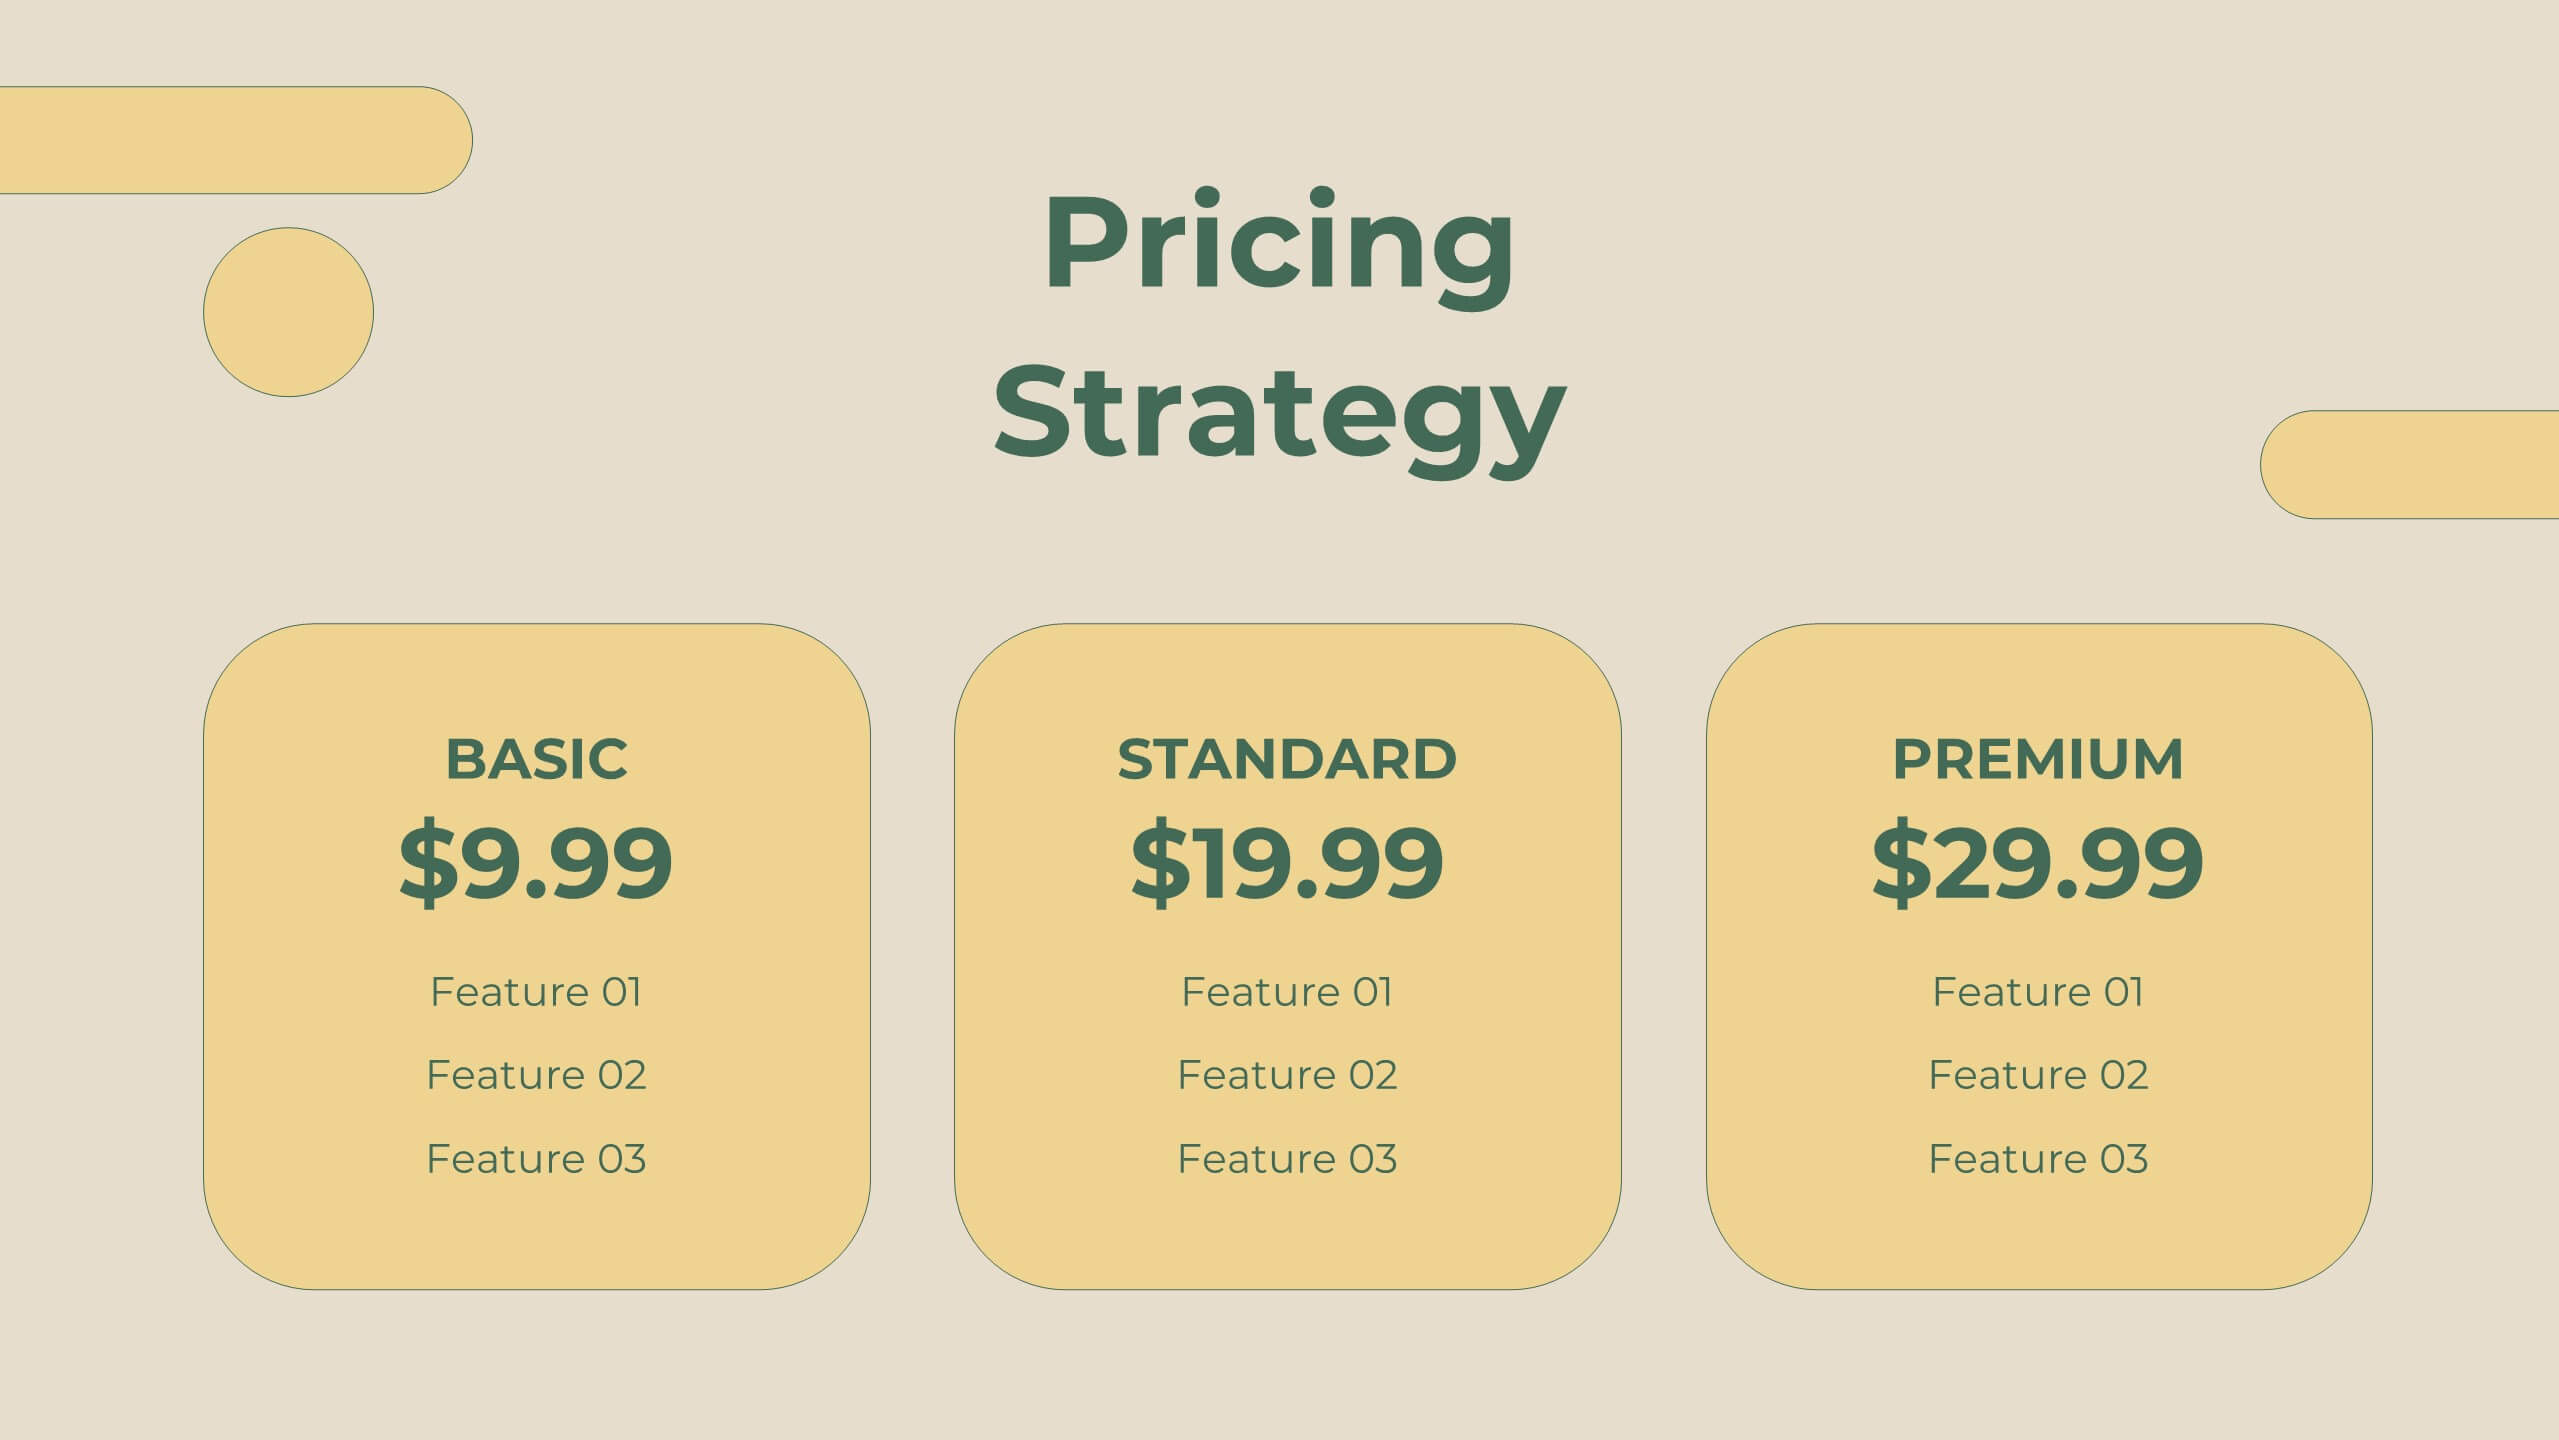
Legacy Sales Strategy Presentation
Boost your sales presentations with this modern template! It features sections for objectives, process, team introduction, customer testimonials, and performance metrics. Ideal for outlining strategies, opportunities, and pricing. Engage your audience with a professional, clean design. Compatible with PowerPoint, Keynote, and Google Slides for seamless integration. Make your sales strategy stand out!


4 slides
Identifying Performance Gaps
Clearly showcase the steps needed to bridge critical performance gaps with this modern template. Ideal for strategic planning, business reviews, and goal-setting sessions. Highlight each stage of growth with dynamic visuals. Fully customizable for PowerPoint, Keynote, and Google Slides.


7 slides
Development Bubble Map Infographic
The Development Bubble Map Infographic you've provided appears to be a visual tool used to organize and represent information in a connected, yet clustered format. Bubble maps are commonly used to illustrate relationships and relative importance among concepts, making them useful for brainstorming, concept mapping, and planning. Each bubble in the map may contain a single concept, idea, or data point, with the size of the bubble often corresponding to the significance or amount of data related to the concept. The connecting lines indicate relationships or pathways between these ideas. Such an infographic could be used in various settings, such as educational environments for teaching, business meetings to discuss project development, or personal planning to visually map out ideas and their interconnections. It helps to visually break down complex systems or concepts into more manageable parts, enabling better understanding and analysis.


2 slides
Professional Closing Thank You Presentation
End your presentation on a high note with this professional thank-you slide template! Featuring a clean and modern layout, this design includes space for contact details and a call to action, making it perfect for business meetings, proposals, and networking events. Fully customizable and compatible with PowerPoint, Keynote, and Google Slides.


6 slides
Managing Product Maturity and Decline Presentation
Explore the critical phases of 'Managing Product Maturity and Decline' with this detailed presentation template. It's designed for professionals in product management, illustrating strategies to handle product lifecycle stages effectively. This template is a must-have for seminars and workshops focusing on prolonging product lifespan and maximizing returns.


7 slides
Enterprise Sales Infographic
Enterprise sales, often referred to as B2B (business-to-business) sales, involves selling products or services to larger organizations and enterprises. Prepare for an exhilarating journey through our sales infographic - a high-energy presentation designed to fuel your enterprise sales like never before. Illuminate the path to a seamless customer experience, leading to a galaxy of satisfaction. This infographic is fully customizable and compatible with Powerpoint, Keynote, and Google Slides. This template isn't just a sales roadmap; it's a launchpad to your unparalleled success!


26 slides
Coffee Shop Warm Company Profile Presentation
Coffee shops have become an important part of modern culture, especially in urban areas, and they come in various styles and themes. This presentation template is designed to bring the essence of your coffee haven to life. From the first sip to the last drop, let this presentation showcase the soul-warming experience your coffee shop provides. Fully customizable and compatible with Powerpoint, Keynote, and Google Slides. Utilize warm colors like browns, oranges, and yellows to evoke a cozy, comforting atmosphere. The template integrates coffee cup icons, latte art, and coffee bean graphics for a coffee-centric theme.


6 slides
Strategic Business Planning Presentation
Bring your ideas to life with a slide design that makes strategic planning feel bold, focused, and easy to follow. This presentation walks through key business objectives, priorities, and action steps using clean visuals and intuitive layouts. Perfect for teams presenting strategy, goals, and long-term planning. Fully compatible with PowerPoint, Keynote, and Google Slides.


20 slides
Cinderbark Product Launch Pitch Deck Presentation
Showcase your product launch with a sleek, modern, and professional pitch deck template. This design empowers you to captivate stakeholders by clearly presenting your problem statement, unique solutions, and market opportunity. Effectively highlight your target audience, revenue model, and competitive landscape to demonstrate market viability. Create impact with visuals detailing your sales strategy, growth projections, and financial summary, ensuring transparency and confidence in your business plan. Timeline and milestone slides keep the focus on key achievements and future goals, while team introduction pages establish credibility and expertise. Fully customizable and compatible with PowerPoint, Google Slides, and Keynote, this template is ideal for startups, entrepreneurs, and product managers aiming for a polished and compelling presentation. Tailor it to your needs and deliver your vision with clarity and style.


6 slides
Funnel Stages Infographic
In marketing and sales, the term "funnel stages" refers to the different stages or steps that a potential customer goes through in their journey from initial awareness of a product or service to making a purchase decision. These infographics visualize and help you understand the customer's progression through these stages. They aim to help businesses and professionals understand the customer journey and optimize their strategies for each stage of the funnel. Whether used in sales presentations, marketing workshops, or educational materials, this template helps businesses build successful sale funnels and maximize their revenue potential.


5 slides
RAPID Framework for Business Strategy
Clarify decision-making roles with confidence using this vibrant business strategy framework. This template visualizes the RAPID model—Recommend, Agree, Perform, Input, Decide—in a clear flow that simplifies collaboration and speeds up strategy execution. Ideal for leadership teams and cross-functional planning. Works seamlessly in PowerPoint, Keynote, and Google Slides.


6 slides
Sports Equipment Infographics
The "Sports Equipment" infographic template is a dynamic and engaging tool, perfectly crafted for PowerPoint, Keynote, and Google Slides. This template is an excellent choice for sports retailers, equipment manufacturers, and fitness enthusiasts who wish to showcase a range of sports gear and its features. The template vividly displays various types of sports equipment, detailing their use, benefits, and technical specifications. It's designed to highlight product features, usage tips, and maintenance advice, making it highly useful for product demonstrations, sales presentations, and customer education. With a vibrant and energetic design, the color scheme of the template is tailored to capture the spirit of sports and fitness. This not only makes the presentation visually striking but also aligns with the themes of activity, energy, and health. Whether used in a retail setting, a trade show, or a fitness workshop, this template ensures that the diverse range of sports equipment is presented in a visually appealing, organized, and informative manner.


5 slides
Procurement Strategy Presentation
ChatGPT PlusBring clarity and structure to your business process with this modern, visually engaging presentation. Perfect for outlining purchasing plans, supplier relationships, and cost-saving strategies, it helps convey information with precision and flow. Fully customizable and compatible with PowerPoint, Keynote, and Google Slides for seamless editing and professional results.


21 slides
Kinetic Startup Funding Proposal Presentation
Get ready to impress potential investors with the Kinetic Startup Funding Proposal template! This dynamic and modern template is designed to help you present your startup's vision, mission, and growth potential in the most compelling way possible. From introducing your team and services to highlighting your unique value proposition and business model, every slide is crafted to showcase your startup's strengths. The template includes sections for market analysis, customer needs, and pain points, ensuring your presentation is data-driven and focused on solving real problems. With slides dedicated to your marketing strategy, sales channels, and financial overview, you can provide a comprehensive plan for success. The sleek design, combined with easy-to-edit slides, allows you to customize the presentation to reflect your startup's brand identity. Whether you're pitching to angel investors or venture capitalists, the Kinetic Startup Funding Proposal template will help you stand out and secure the funding you need. Compatible with PowerPoint, Keynote, and Google Slides, this template is your key to delivering a winning pitch.


12 slides
Employee Feedback Smile Score Presentation
Track employee sentiment with this engaging employee feedback smile score template! Featuring a visually intuitive gauge design, this layout helps HR teams and managers assess workplace satisfaction and identify areas for improvement. Ideal for performance reviews, team surveys, and organizational assessments. Fully customizable and compatible with PowerPoint, Keynote, and Google Slides.