


Features
- 10 Unique Slides
- Fully editable and easy to edit in Microsoft Powerpoint, Keynote and Google Slides
- 16:9 widescreen layout
- Clean and professional designs
- Export to JPG, PDF or send by email


Do you have any questions?
Recommend


5 slides
IT Security and Data Protection Presentation
Communicate your cybersecurity objectives with impact using this clean, shield-based visual layout. This presentation slide features five distinct steps with matching icons, perfect for detailing protocols like data governance, firewall strategies, or access control measures. Ideal for IT professionals, network admins, or compliance teams. Fully customizable and compatible with PowerPoint, Keynote, and Google Slides.


2 slides
Professional Closing Thank You
End your presentation with clarity and professionalism using this bold yet minimalist "Thank You" slide. Designed with modern aesthetics and contact detail placeholders, it’s ideal for business reports, marketing decks, and corporate pitches. Fully customizable in PowerPoint, Keynote, and Google Slides.


5 slides
Ishikawa Fishbone Diagram Presentation
Bring clarity to problem-solving with a visual that makes root-cause analysis feel simple and intuitive. This presentation helps you map issues, organize insights, and highlight contributing factors with clean, structured design. Perfect for workshops, audits, and process improvement. Fully compatible with PowerPoint, Keynote, and Google Slides.


21 slides
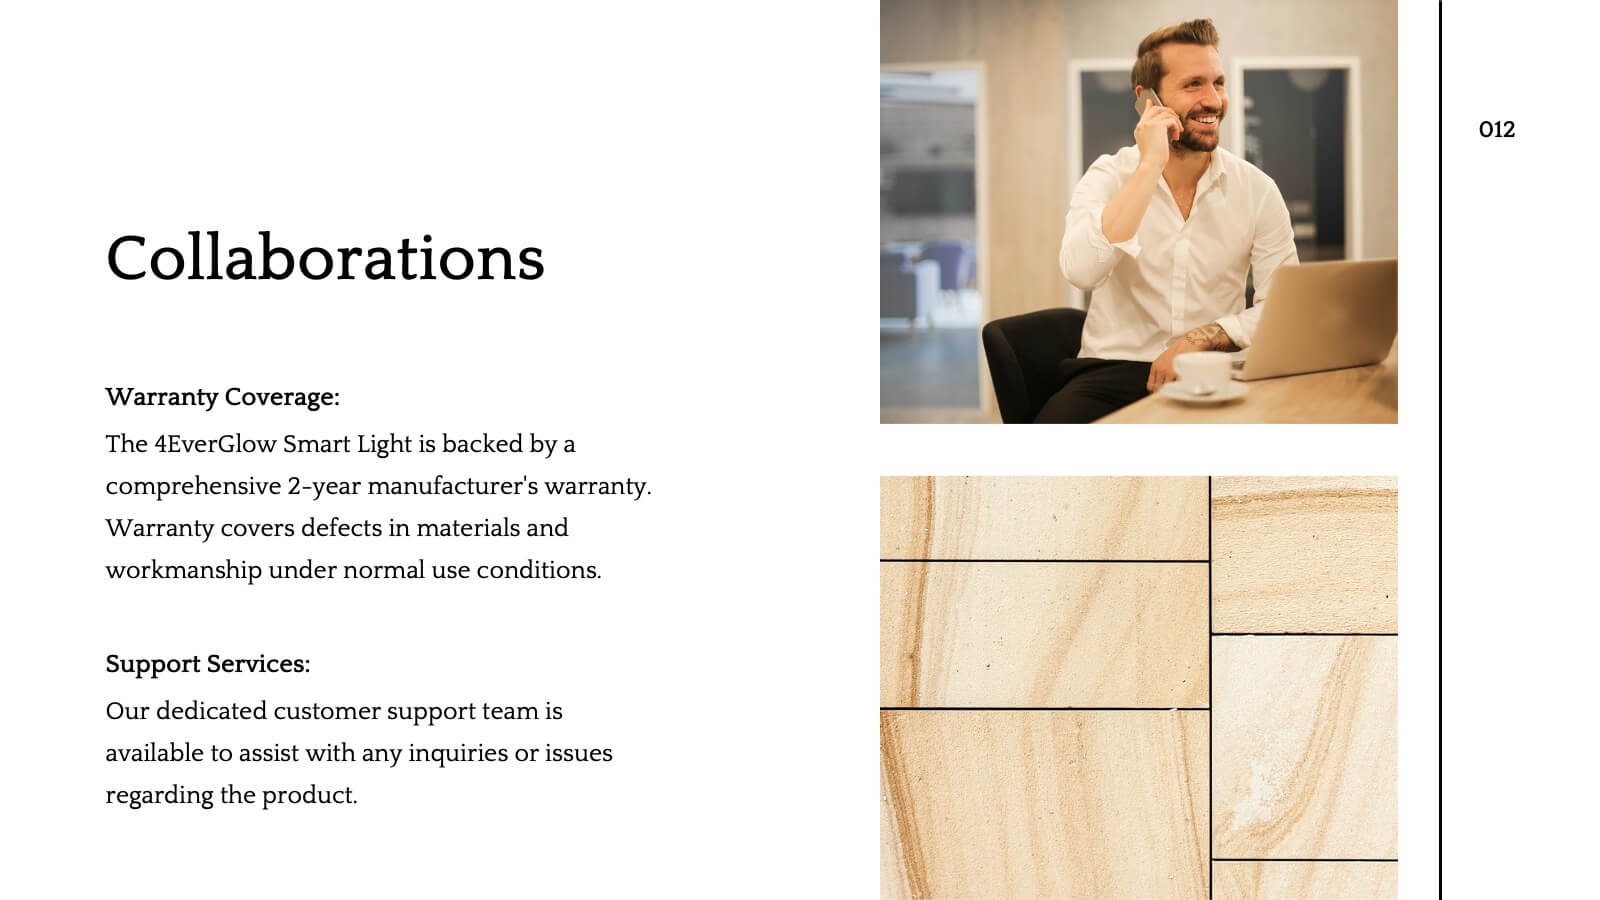
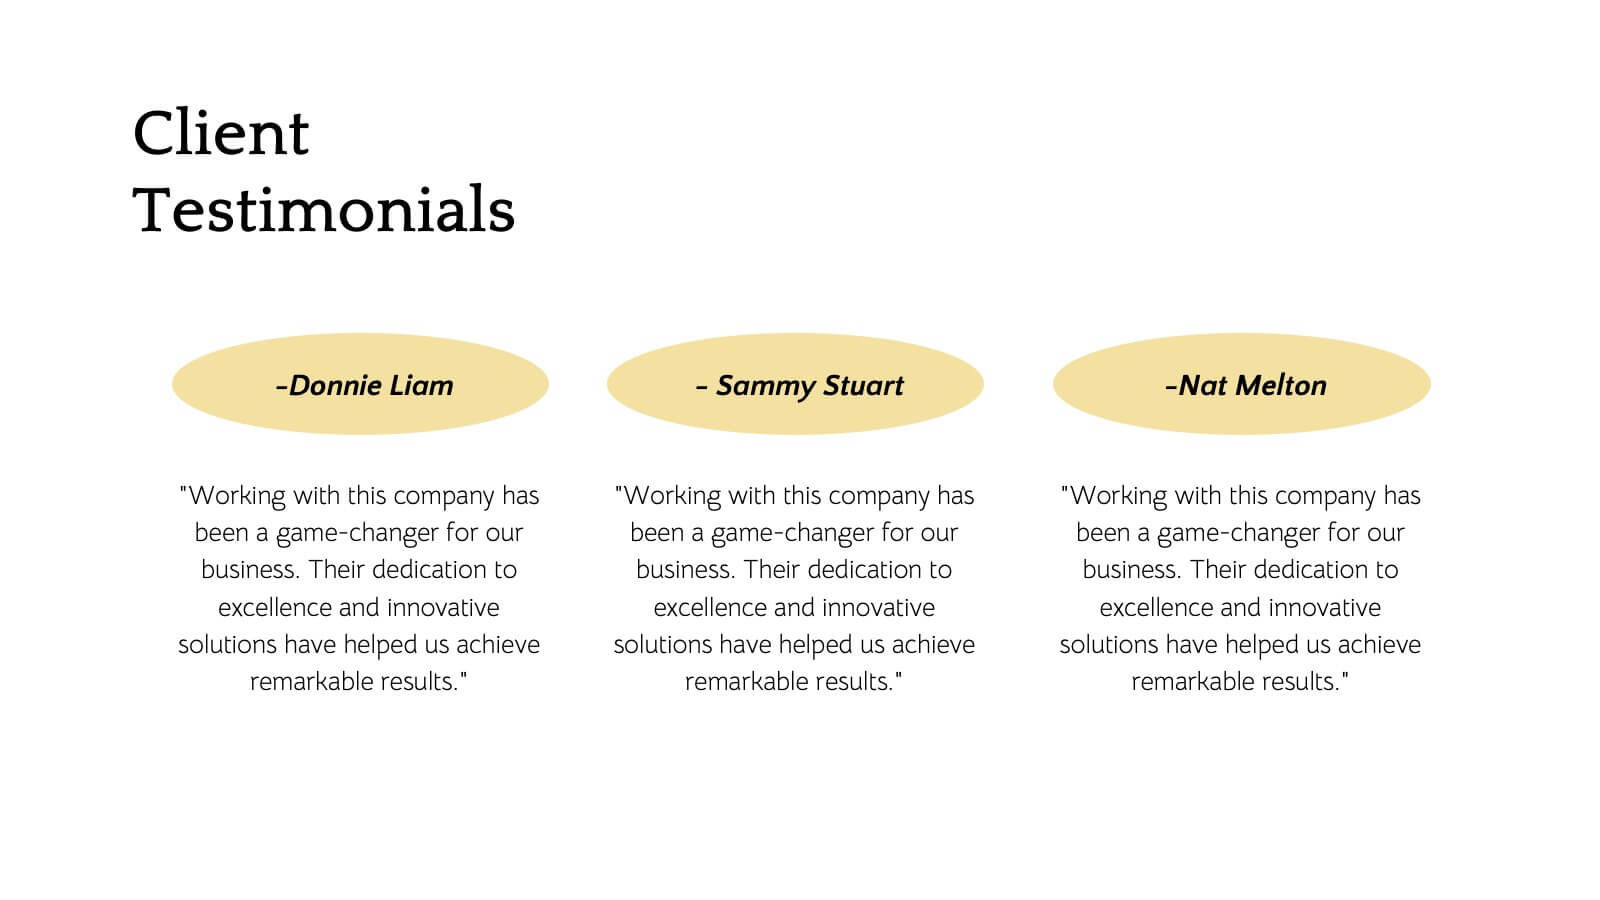
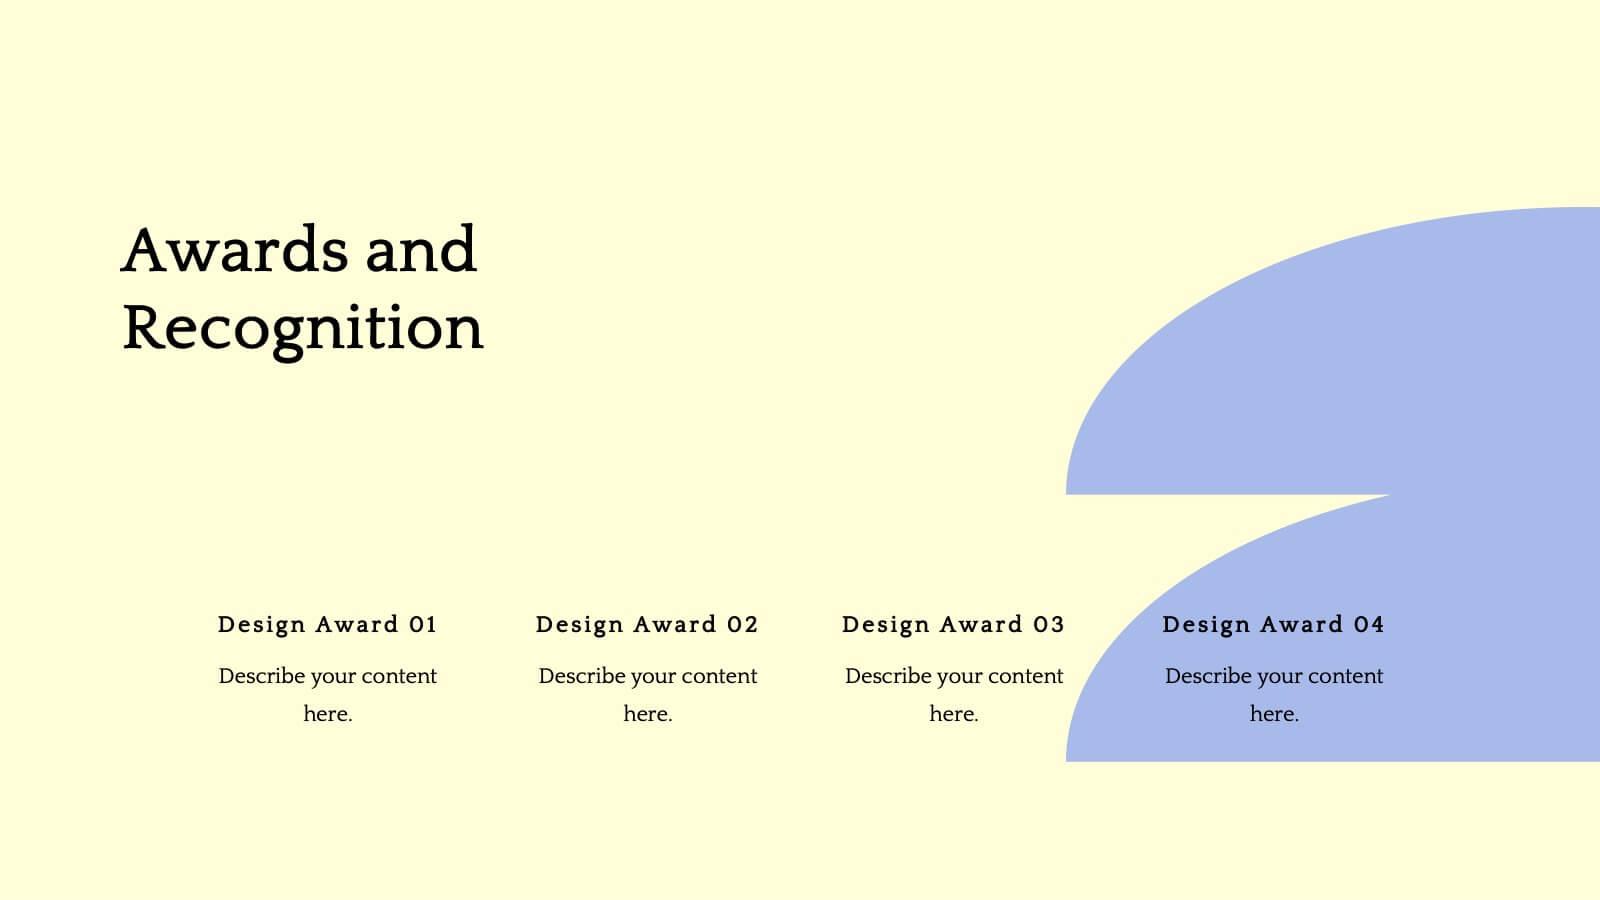
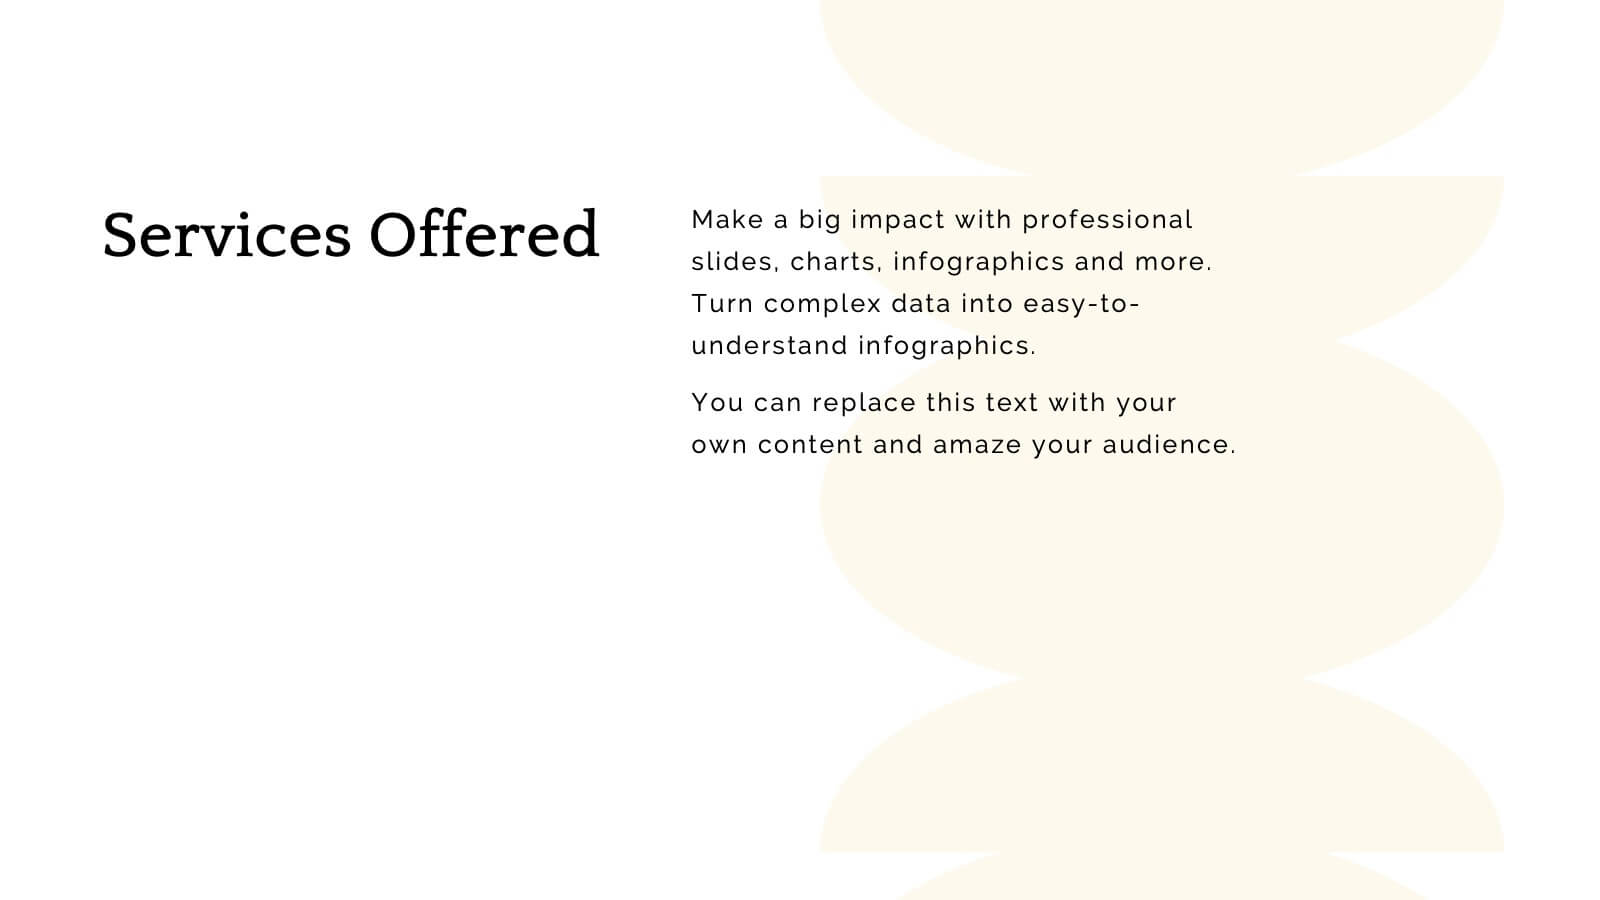
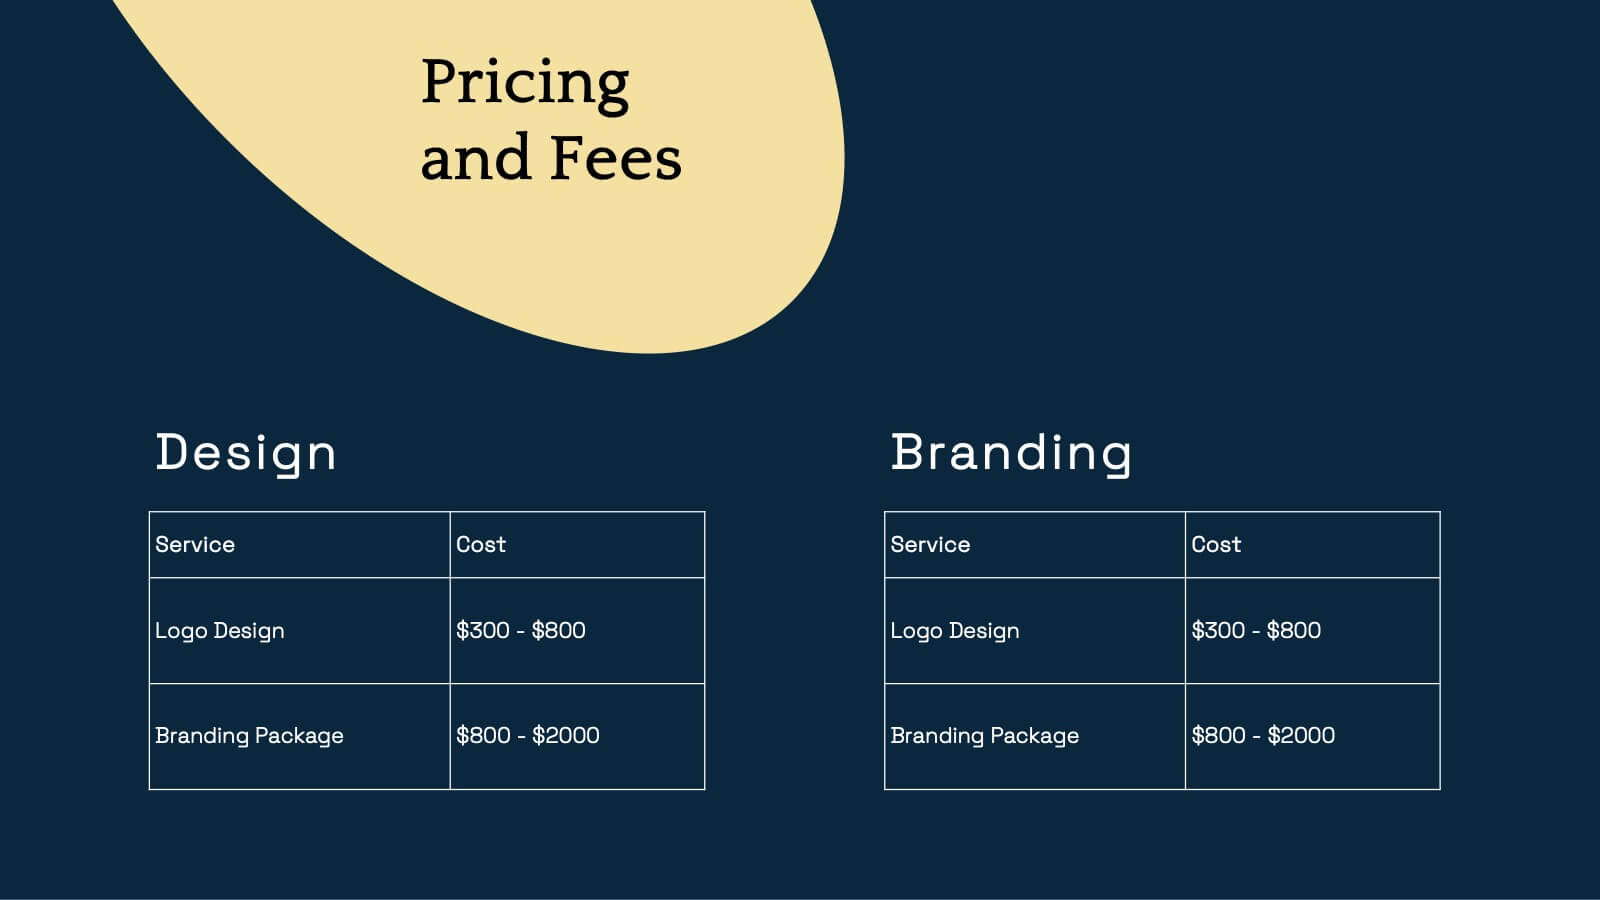
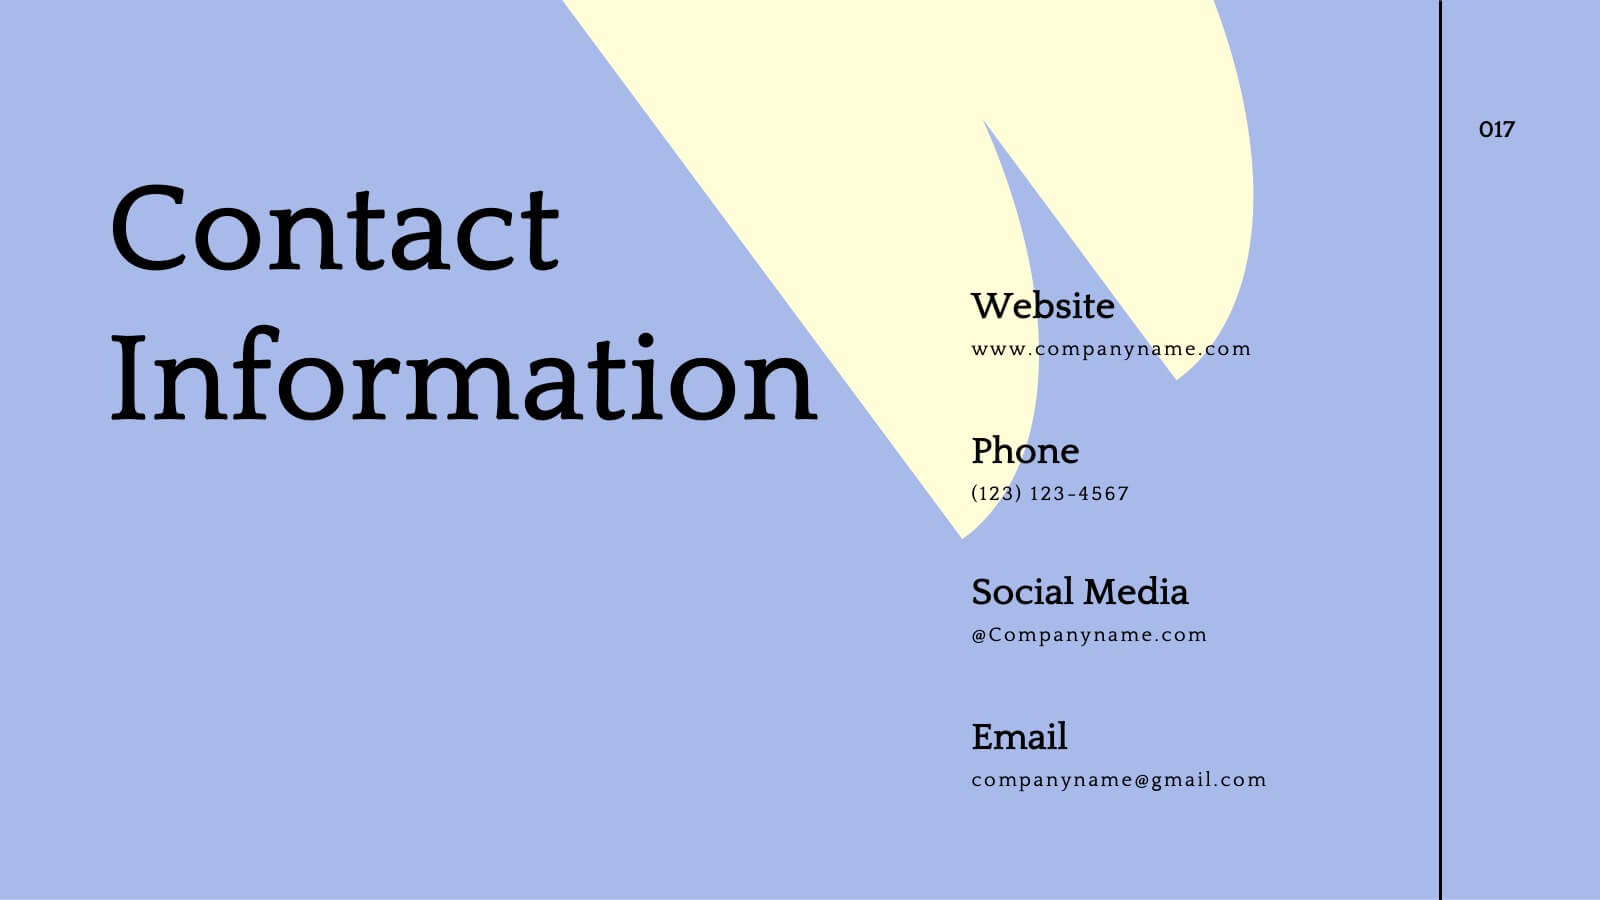
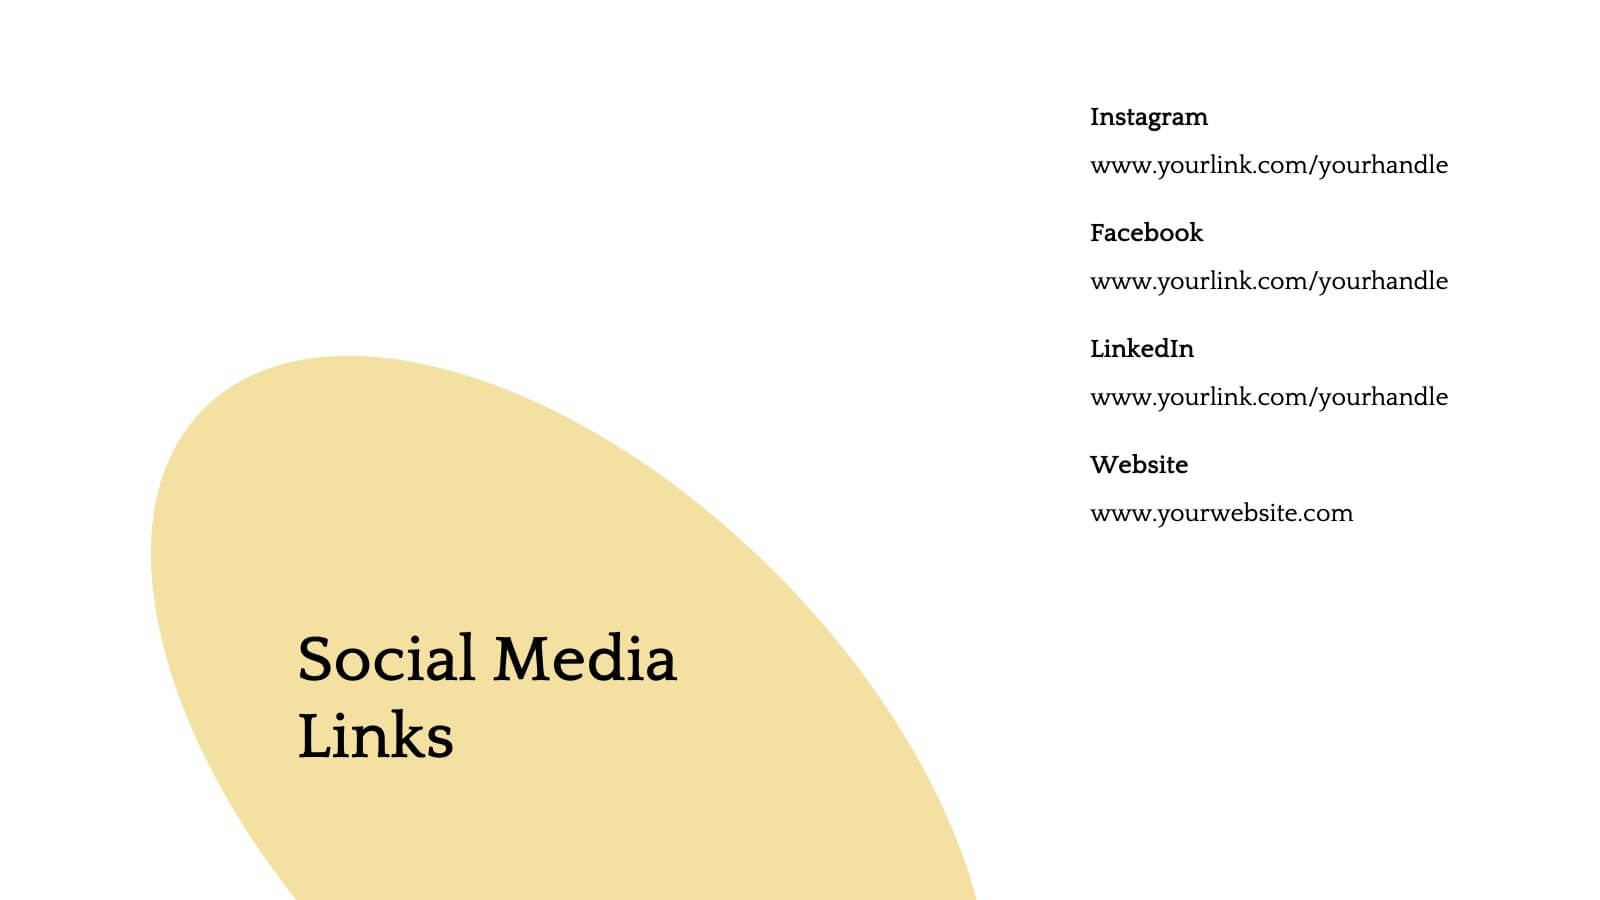
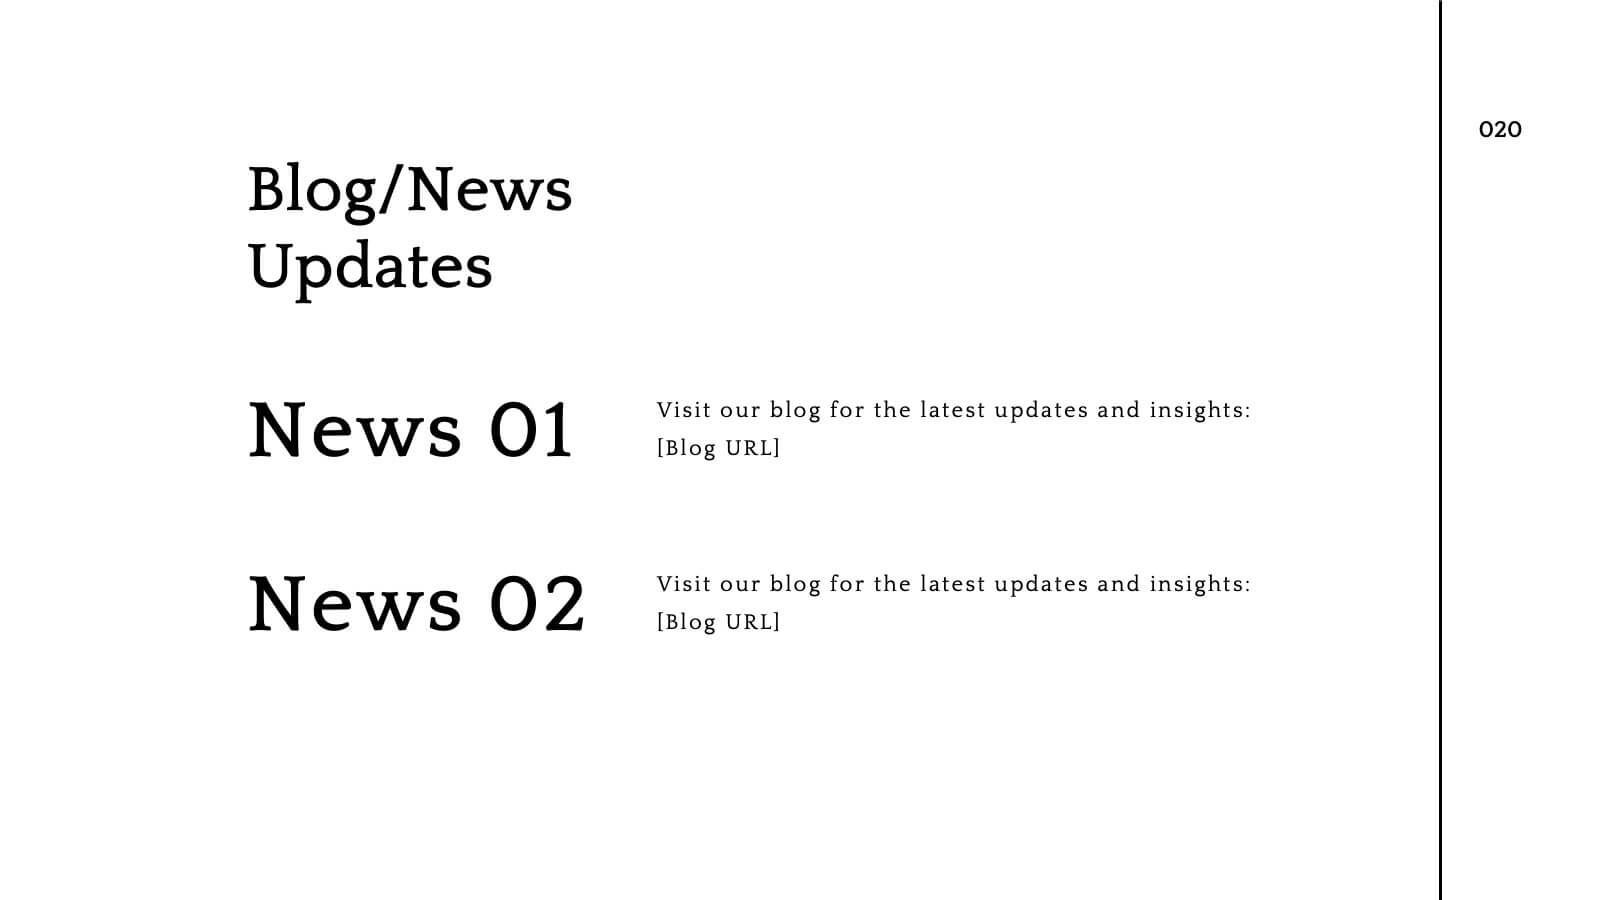
Seaspray Design Proposal Presentation
Present your design proposal with confidence and clarity using this sleek, professionally crafted template. Tailored for designers and creatives, this presentation includes slides for a company overview, project summary, and a clear articulation of the problem statement with a proposed solution. Walk your audience through your objectives and goals, detailed scope of work, and structured methodology for implementation. Highlight key aspects with a timeline and milestones, and deliver value with dedicated slides for budget breakdowns and pricing structures. Build trust and credibility through client testimonials and showcase expertise with a team introduction. End your presentation with actionable next steps and a well-crafted conclusion to leave a lasting impact. Fully customizable for PowerPoint, Google Slides, and Keynote, this template is perfect for creative professionals aiming to win clients and projects with precision and style.


8 slides
Beginner's Guide to Stock Market Presentation
Turn complex financial ideas into simple, engaging visuals with this sleek, data-driven design. Perfect for explaining market basics, investment growth, and trading concepts in a way that’s easy to follow and visually appealing. Fully compatible with PowerPoint, Keynote, and Google Slides for effortless editing and presentation customization.


10 slides
Body System Educational Overview Presentation
Dive into anatomy with a slide that makes learning the human body visual, clear, and interactive. This educational overview breaks down key body systems into simple, labeled sections—perfect for classroom teaching, medical training, or health awareness campaigns. Fully editable and compatible with PowerPoint, Keynote, and Google Slides for seamless customization.


4 slides
Sequential Roadmap Planning Timeline Presentation
Guide your audience through each milestone with the Sequential Roadmap Planning Timeline Presentation. This sleek layout is perfect for showing linear progress over time—ideal for strategic plans, product rollouts, or project phases. Each step is clearly marked with editable years and titles, ensuring clarity and easy customization. Fully compatible with PowerPoint, Google Slides, and Canva.


8 slides
Biological Structure and Function Presentation
Visualize biological processes with the Biological Structure and Function infographic. Featuring a hexagonal layout, this template allows you to categorize key concepts such as molecular functions, chemical reactions, and biological systems. Fully editable and available for PowerPoint, Keynote, and Google Slides.


21 slides
Phantomwood Product Roadmap Presentation
A comprehensive presentation template designed to outline product strategies and roadmaps. Covers key aspects like target market, competitive analysis, pricing, and technical specifications. Highlight marketing approaches, production processes, and support information effectively. Fully editable, this template is compatible with PowerPoint, Keynote, and Google Slides for seamless collaboration and professional delivery.


8 slides
Educational Learning and School Management Presentation
Enhance academic planning with the Educational Learning and School Management Diagram. This structured template visualizes key processes in education, ensuring a streamlined approach to school administration and curriculum development. Ideal for educators, administrators, and policymakers, it offers a clear, customizable layout to communicate strategies effectively. Fully compatible with PowerPoint, Keynote, and Google Slides.


6 slides
Concept Matching Puzzle Infographic
Visualize interconnected ideas with the Concept Matching Puzzle Infographic Presentation. Shaped like a head silhouette, this infographic uses five interlocking puzzle pieces to highlight the synergy of concepts—ideal for training, teamwork, decision-making, or idea development. Each segment is icon-tagged and paired with text for clarity. Fully editable in PowerPoint, Keynote, and Google Slides.


7 slides
Ecology Restoration Infographic
Dive into the world of eco-conscious solutions with our ecology restoration infographic. Adorned in soothing shades of white and fresh green, this template captures the essence of nature's rejuvenation. Compatible with Powerpoint, Keynote, and Google Slides, it boasts meticulously crafted graphics, intuitive icons, and user-friendly image placeholders, all tailored to emphasize the urgency and methods of restoring our planet's ecological balance. Ideal for environmentalists, educators, NGOs, or anyone aiming to spread awareness about our planet's well-being.


4 slides
Customers Journey Map Presentation
Take your audience on a smooth, visual adventure that clearly outlines each stage of the customer experience. This presentation helps you map behaviors, highlight key interactions, and explain decision points with clarity and style. Designed for easy customization and fully compatible with PowerPoint, Keynote, and Google Slides.


6 slides
Strategy Wheel Stocks Infographic
A strategy wheel, also known as a strategic wheel or strategy clock, is a visual tool used in strategic management and marketing to analyze and compare different business strategies based on their market positioning and competitive advantage. This Infographic template visually presents different investment strategies in the stock market, helping investors understand and choose the best approach based on their goals and risk tolerance. Use this template to present various strategic options on a circular diagram, allowing for easy comparison and analysis. In each strategy segment provide a brief description of the key features, goals, and risk level.


22 slides
Virtus Qualitative Research Findings Presentation
This qualitative research findings template features a modern design with geometric shapes and a professional palette of blue, gold, and black. It’s structured to showcase research details effectively, covering objectives, methodology, findings, limitations, and future directions. Compatible with PowerPoint, Keynote, and Google Slides for seamless presentations.


4 slides
Restaurant Menu Design Showcase Presentation
Showcase your food offerings with this stylish Restaurant Menu Design Template. Divided into clear sections—Menu, Drinks, and Desserts—it’s perfect for restaurants, cafés, or pop-up events. Fully editable in PowerPoint, Keynote, and Google Slides, this layout lets you present items cleanly with bold titles and organized structure for easy viewing.

21 slides
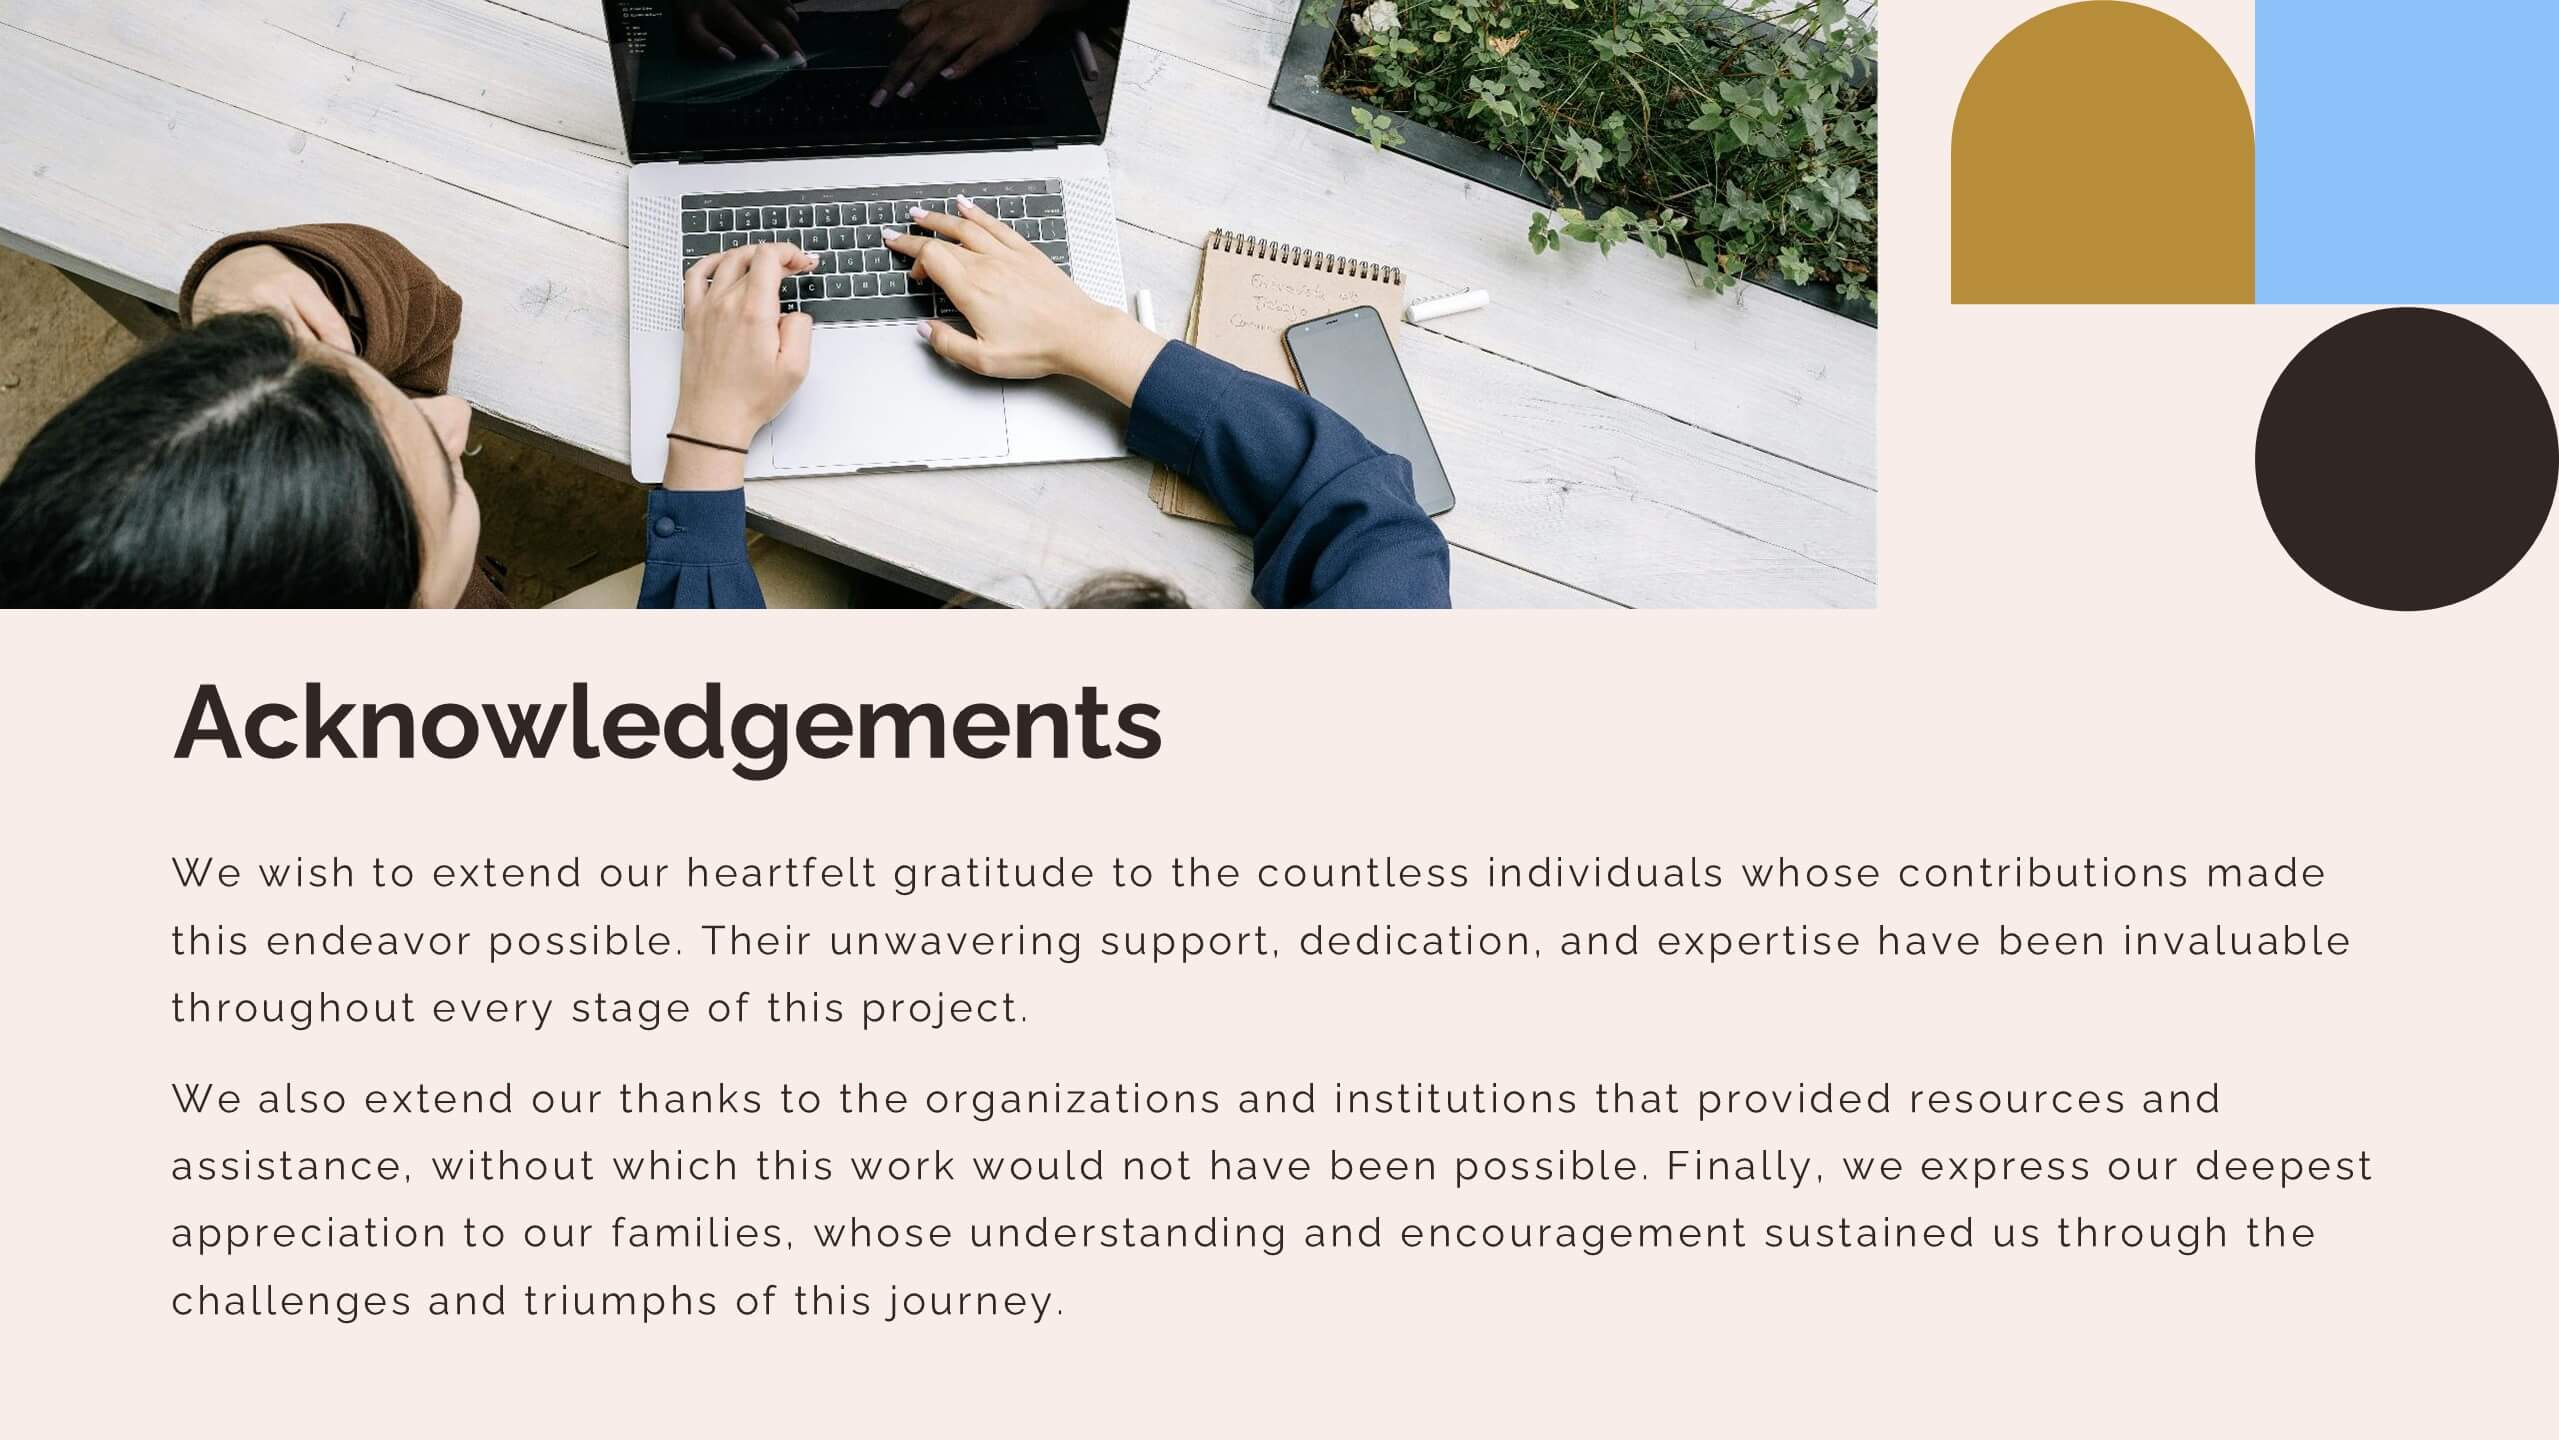
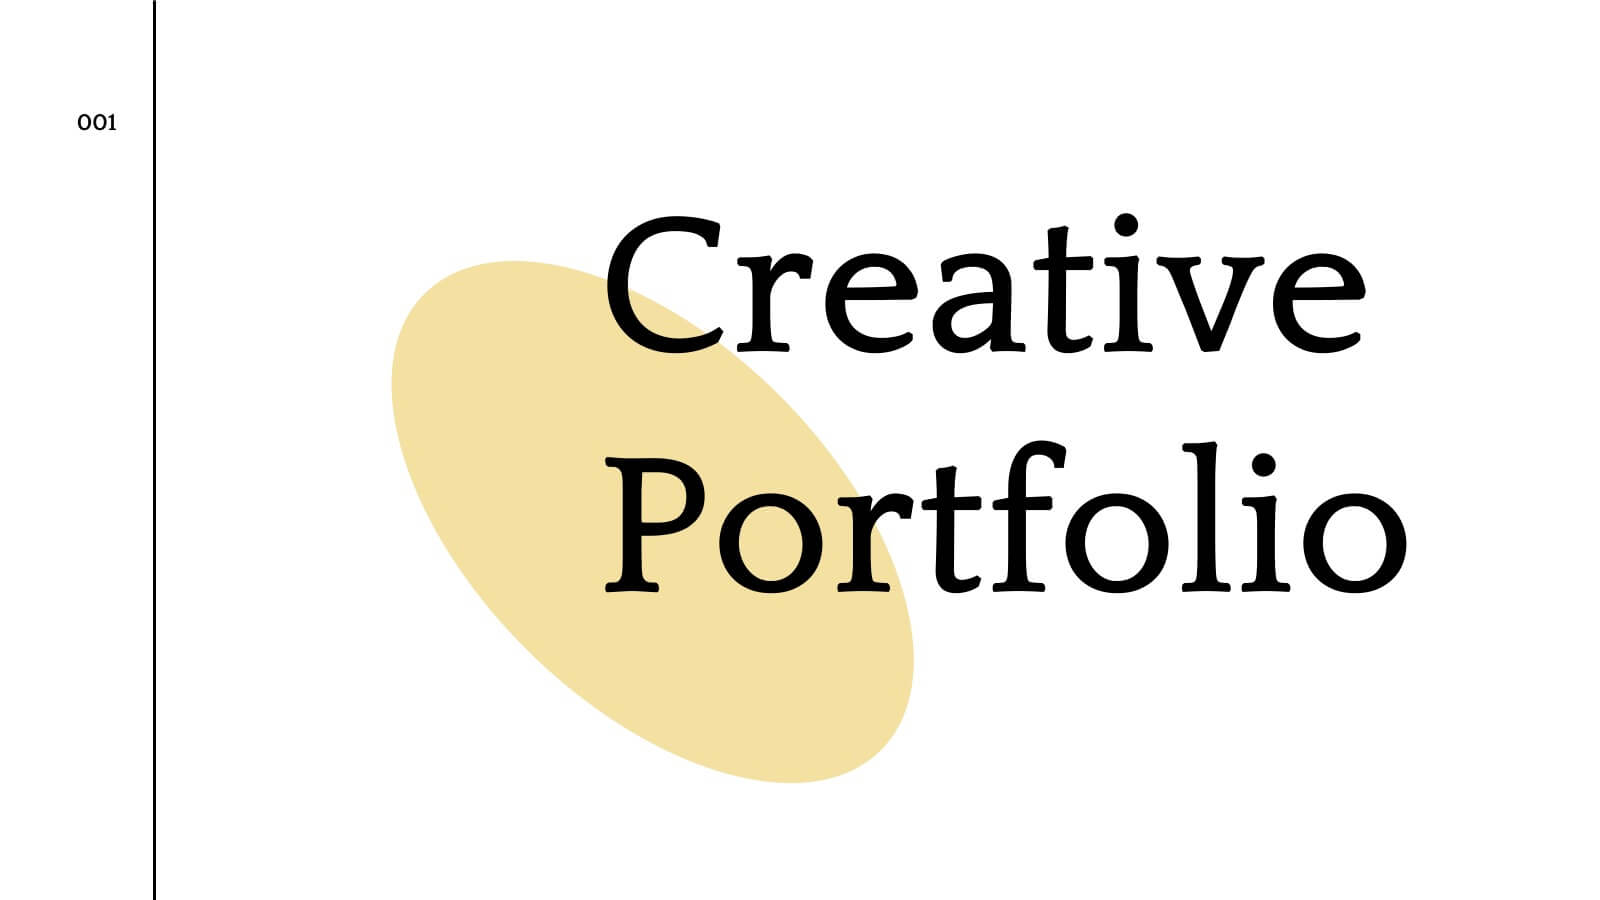
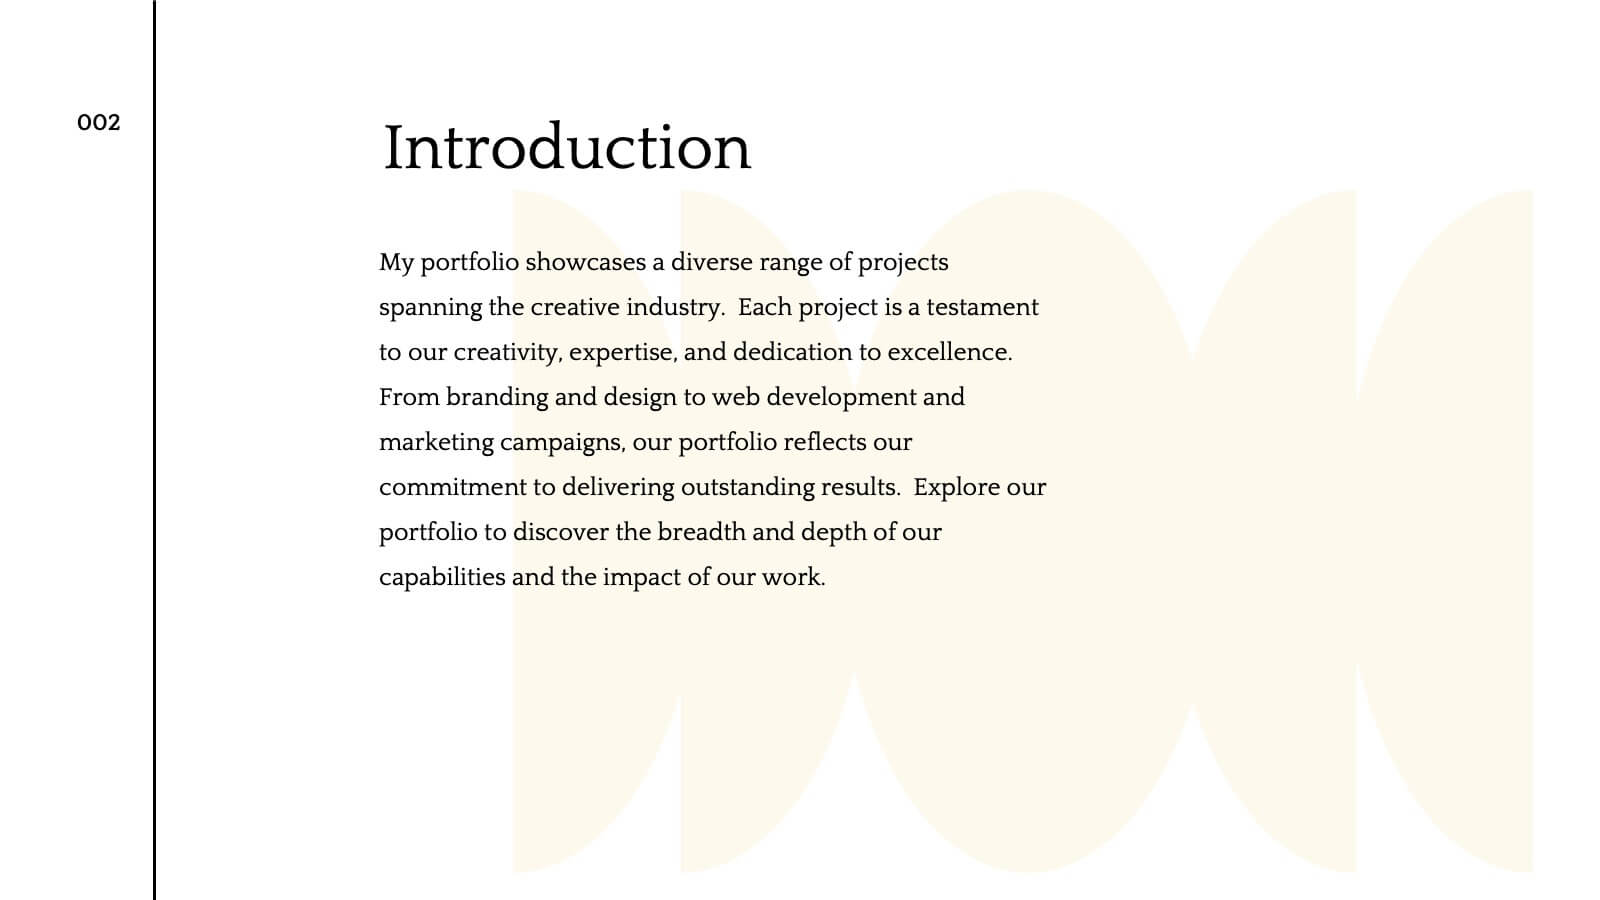
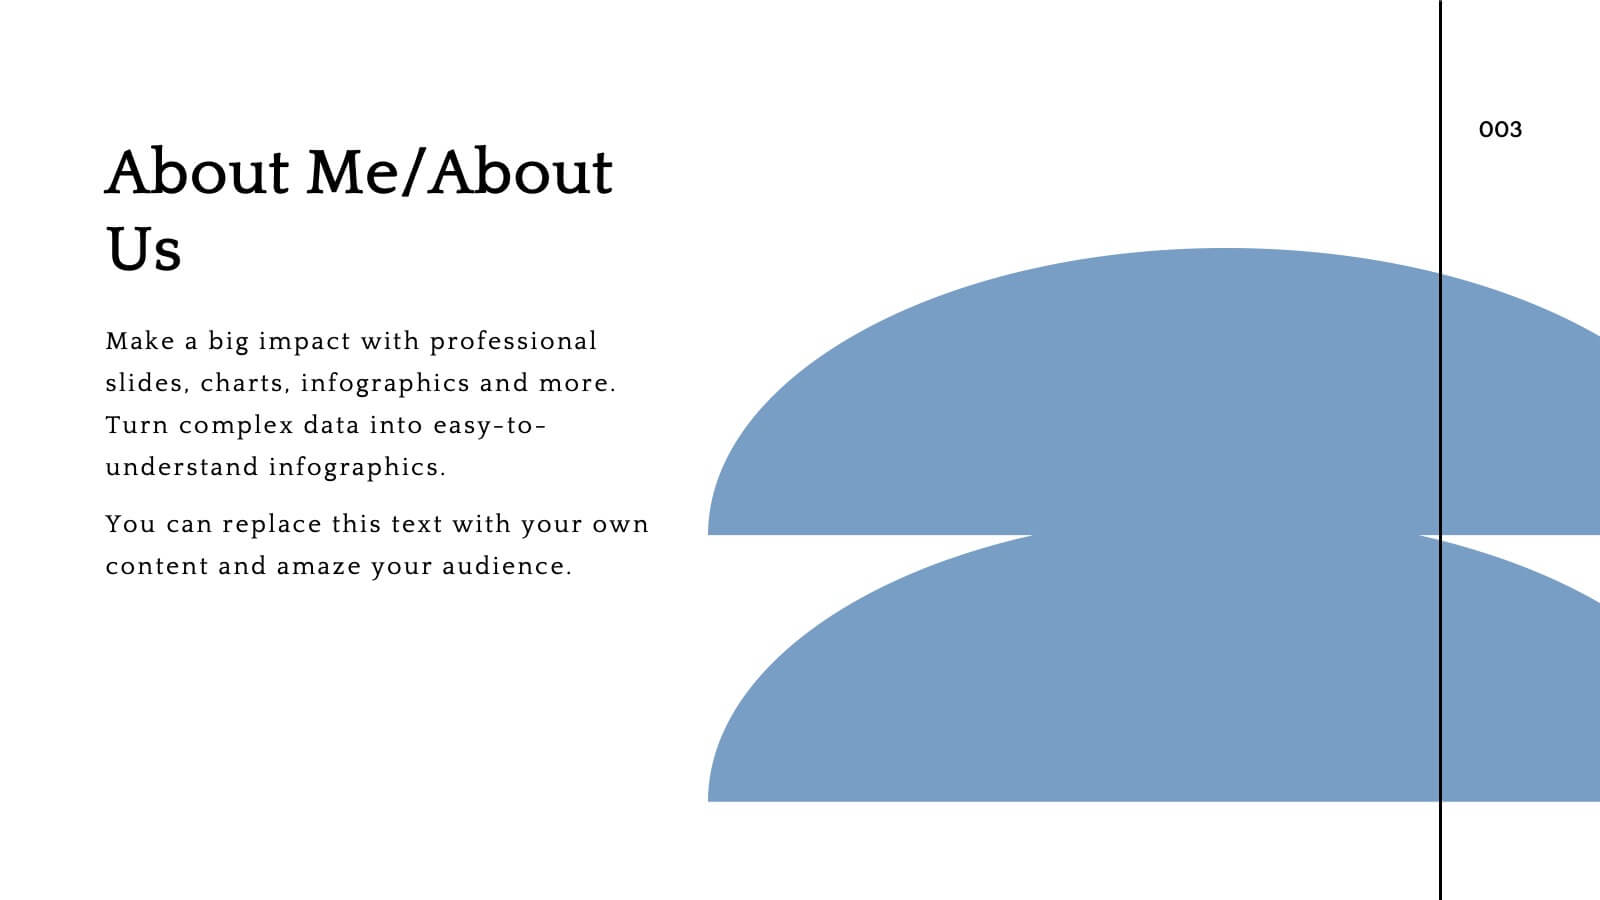
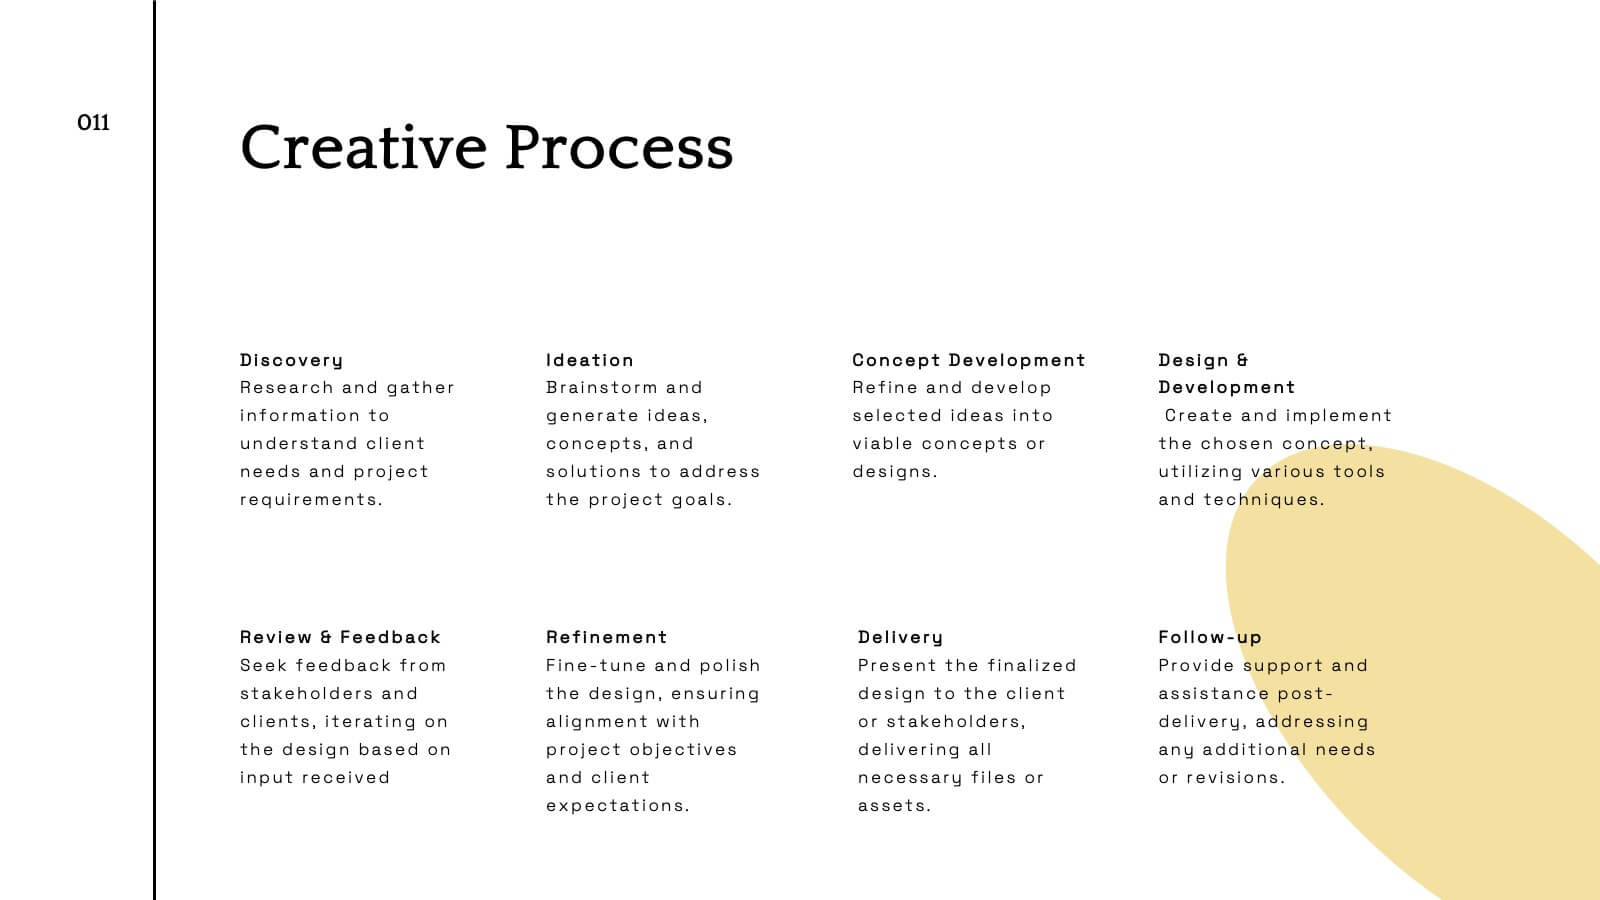
Flare Creative Portfolio Presentation
Showcase your creative work with this elegant portfolio template! Perfect for highlighting projects, client testimonials, and services offered. Ideal for artists, designers, and creatives aiming to impress clients and collaborators. Compatible with PowerPoint, Keynote, and Google Slides, this template ensures your portfolio is clear, professional, and visually stunning. Make your work shine!