


Features
- 6 Unique slides
- Fully editable and easy to edit in Microsoft Powerpoint, Keynote and Google Slides
- 16:9 widescreen layout
- Clean and professional designs
- Export to JPG, PDF or send by email


Do you have any questions?
Recommend


3 slides
Automation and AI Strategy Framework Presentation
Take your ideas for a high-tech spin with this bold and modern layout! This template visually breaks down strategic frameworks for automation and AI by using a clean, segmented circular flow. Ideal for showcasing processes, data integration, or tech-driven initiatives. Fully compatible with PowerPoint, Keynote, and Google Slides for seamless editing.
4 slides
Arrow Path Business Journey Presentation
Visualize growth, decisions, and direction with the Arrow Path Business Journey Presentation. This dynamic slide is designed to illustrate key stages, multiple outcomes, or strategic forks in the road. Great for showing parallel team tracks, phased development, or transformation journeys. Fully editable and works seamlessly in PowerPoint, Google Slides, and Canva.


7 slides
Porter's Five Forces Diagram
Porter's Five Forces is a strategic framework developed by Michael Porter that helps analyze the competitive environment of an industry. The five forces are represented in a diagram to understand the competitive dynamics and attractiveness of an industry or market. In this infographic template, the forces are represented as five segments of a circle or a graphical illustration with arrows and descriptions. Compatible with Powerpoint, Keynote, and Google Slides. This template is a powerful, bold, and insightful tool that dissects competitive forces, revealing strategic insights for businesses.
8 slides
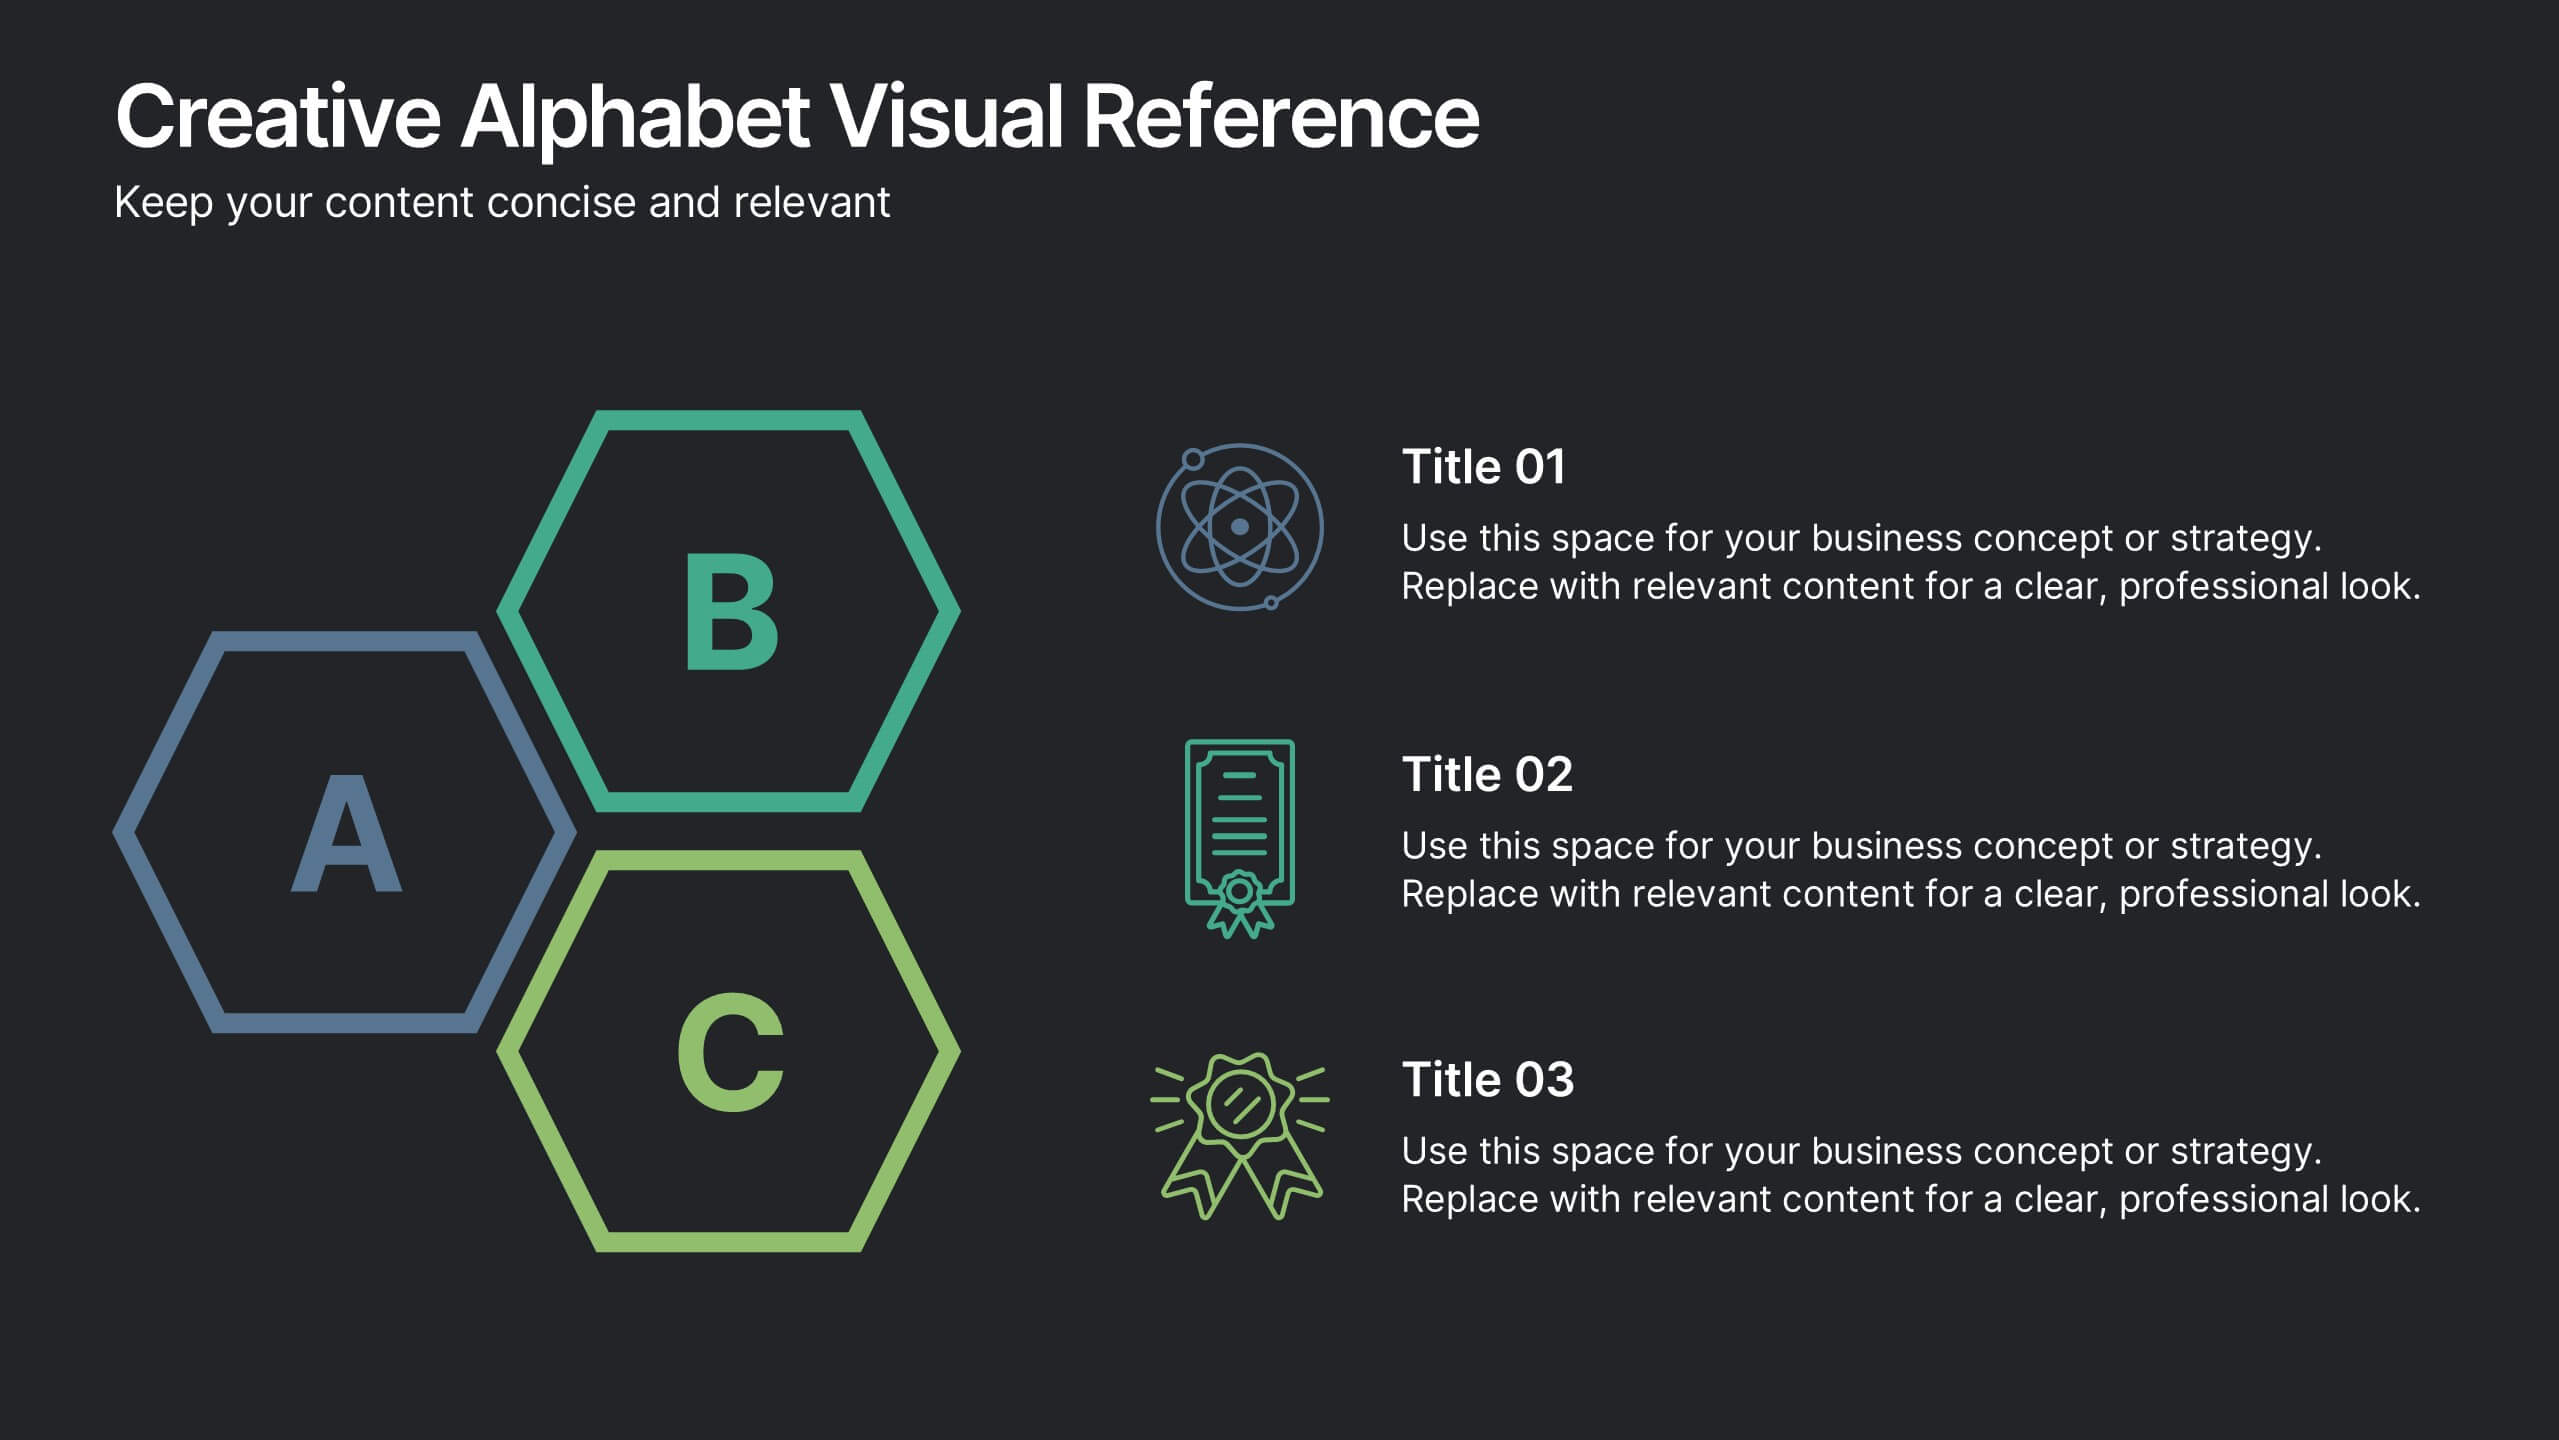
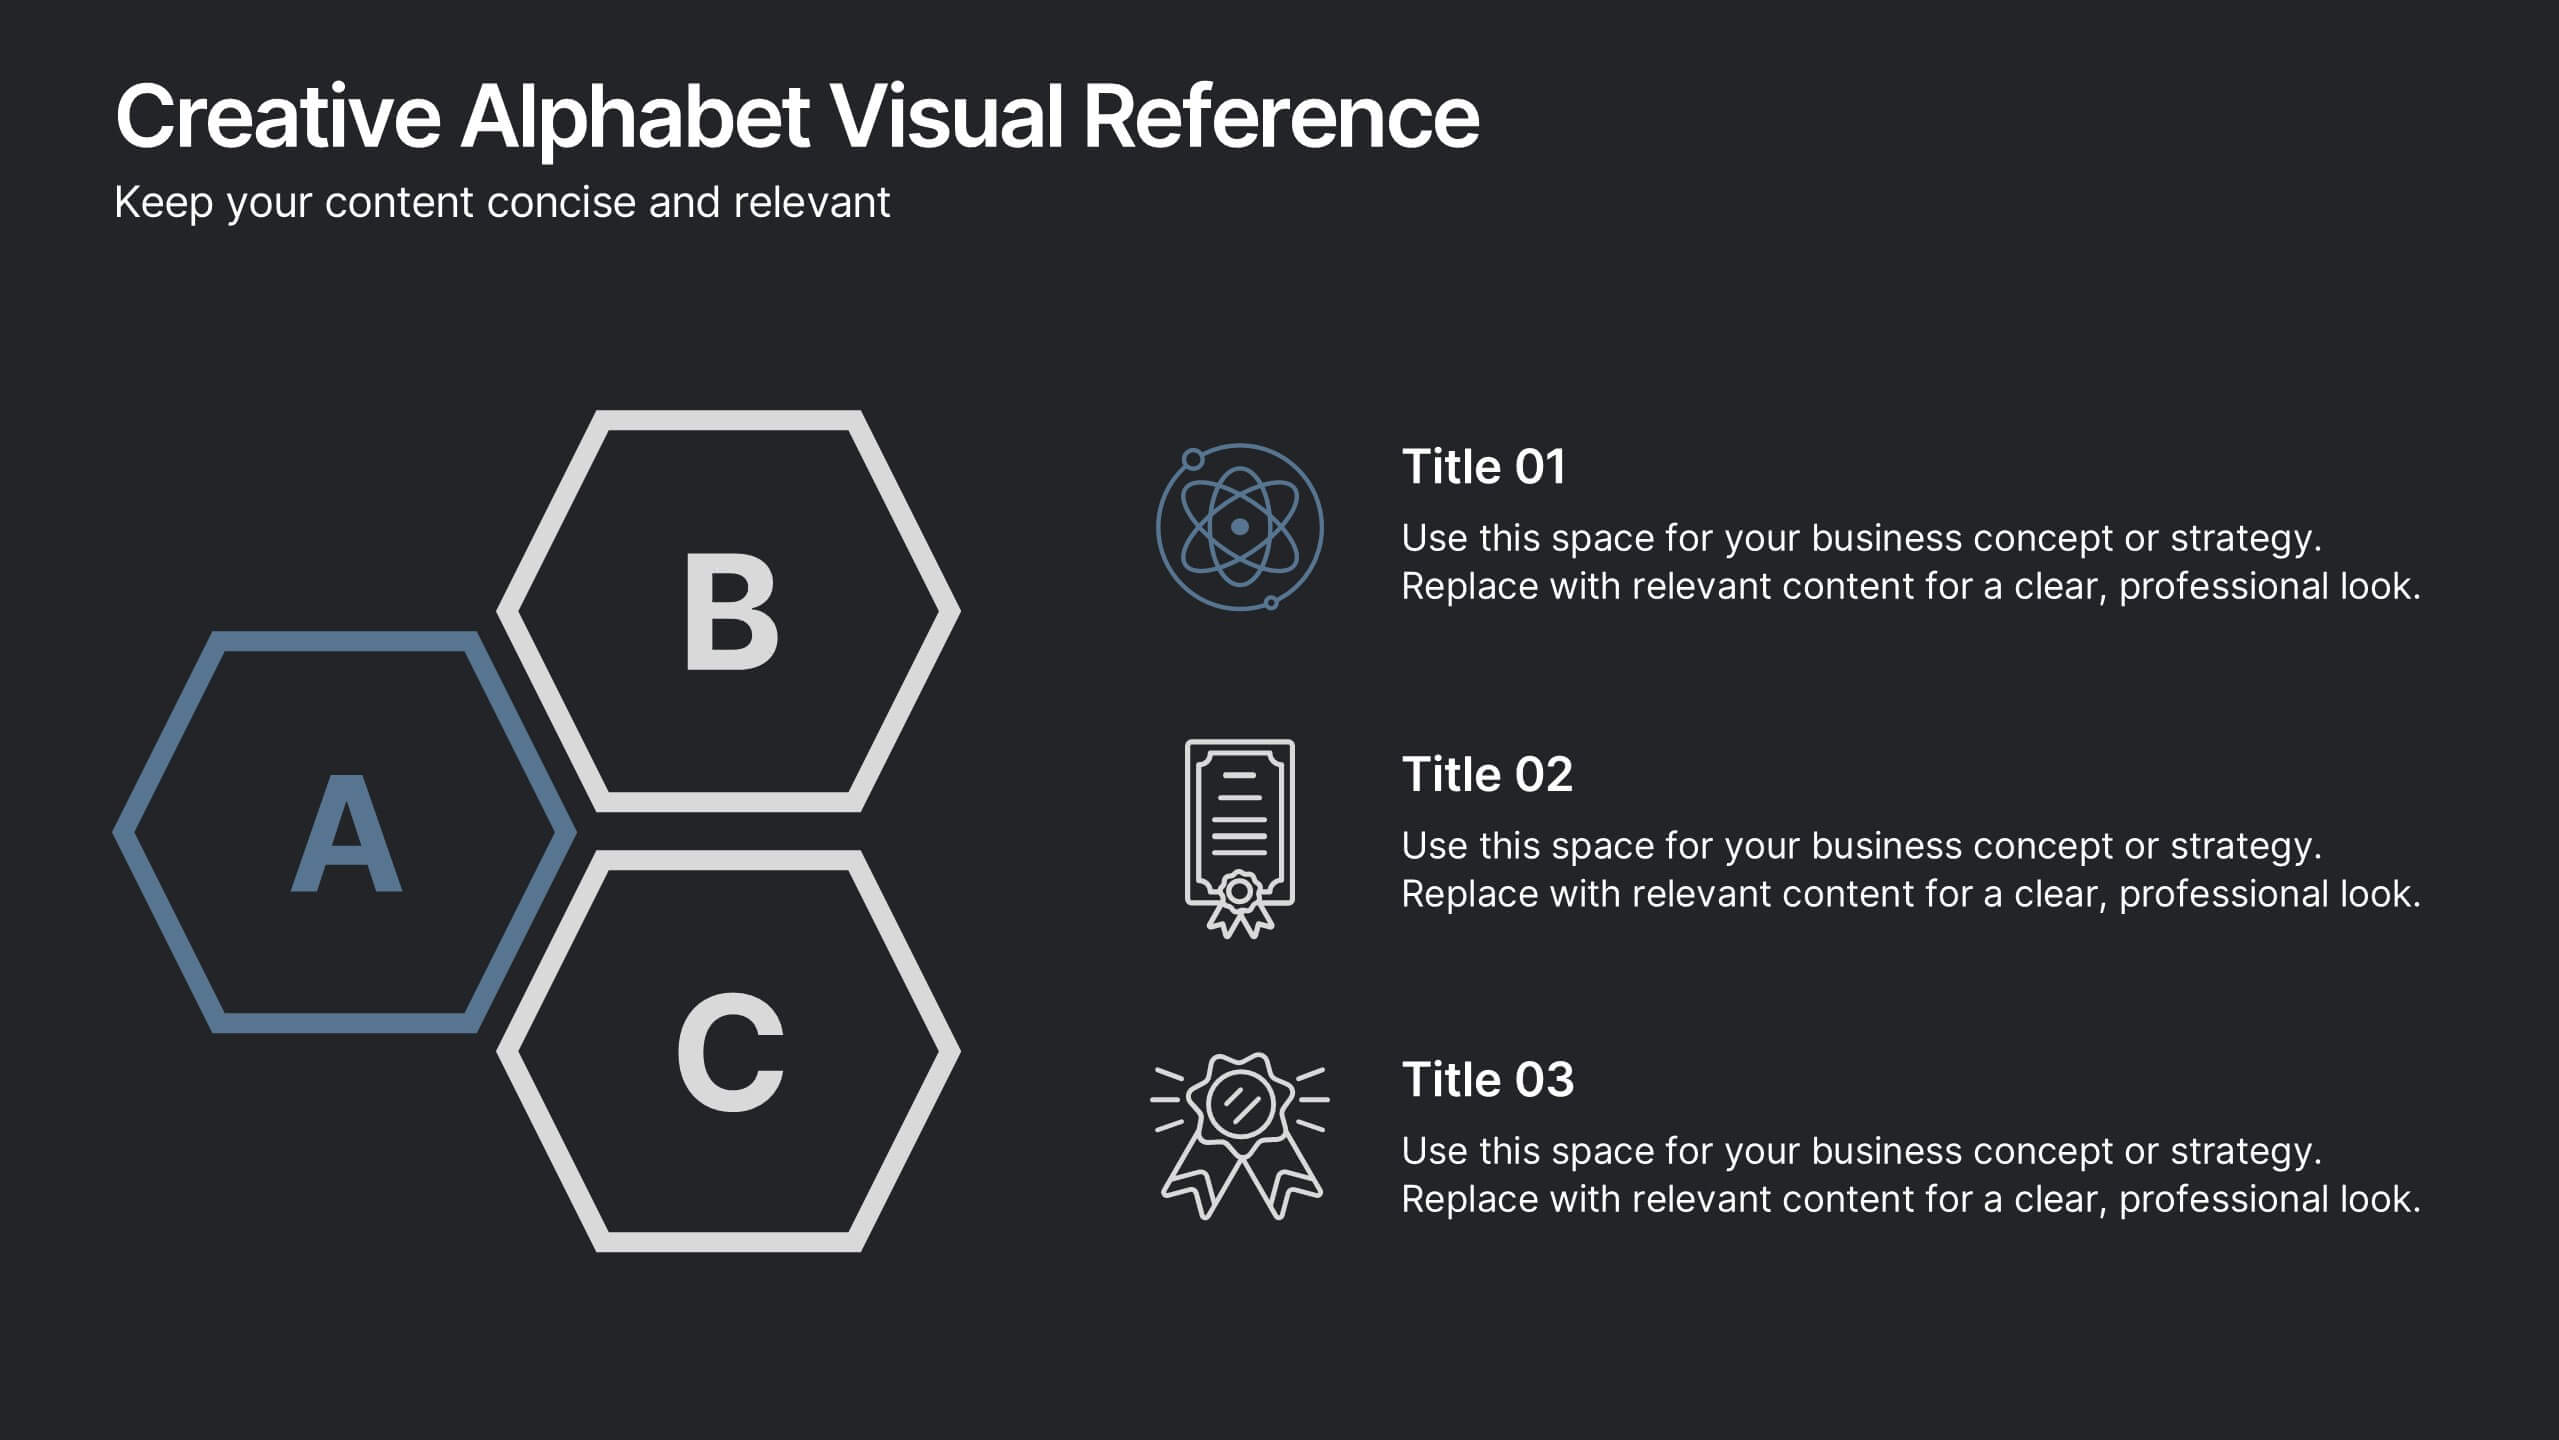
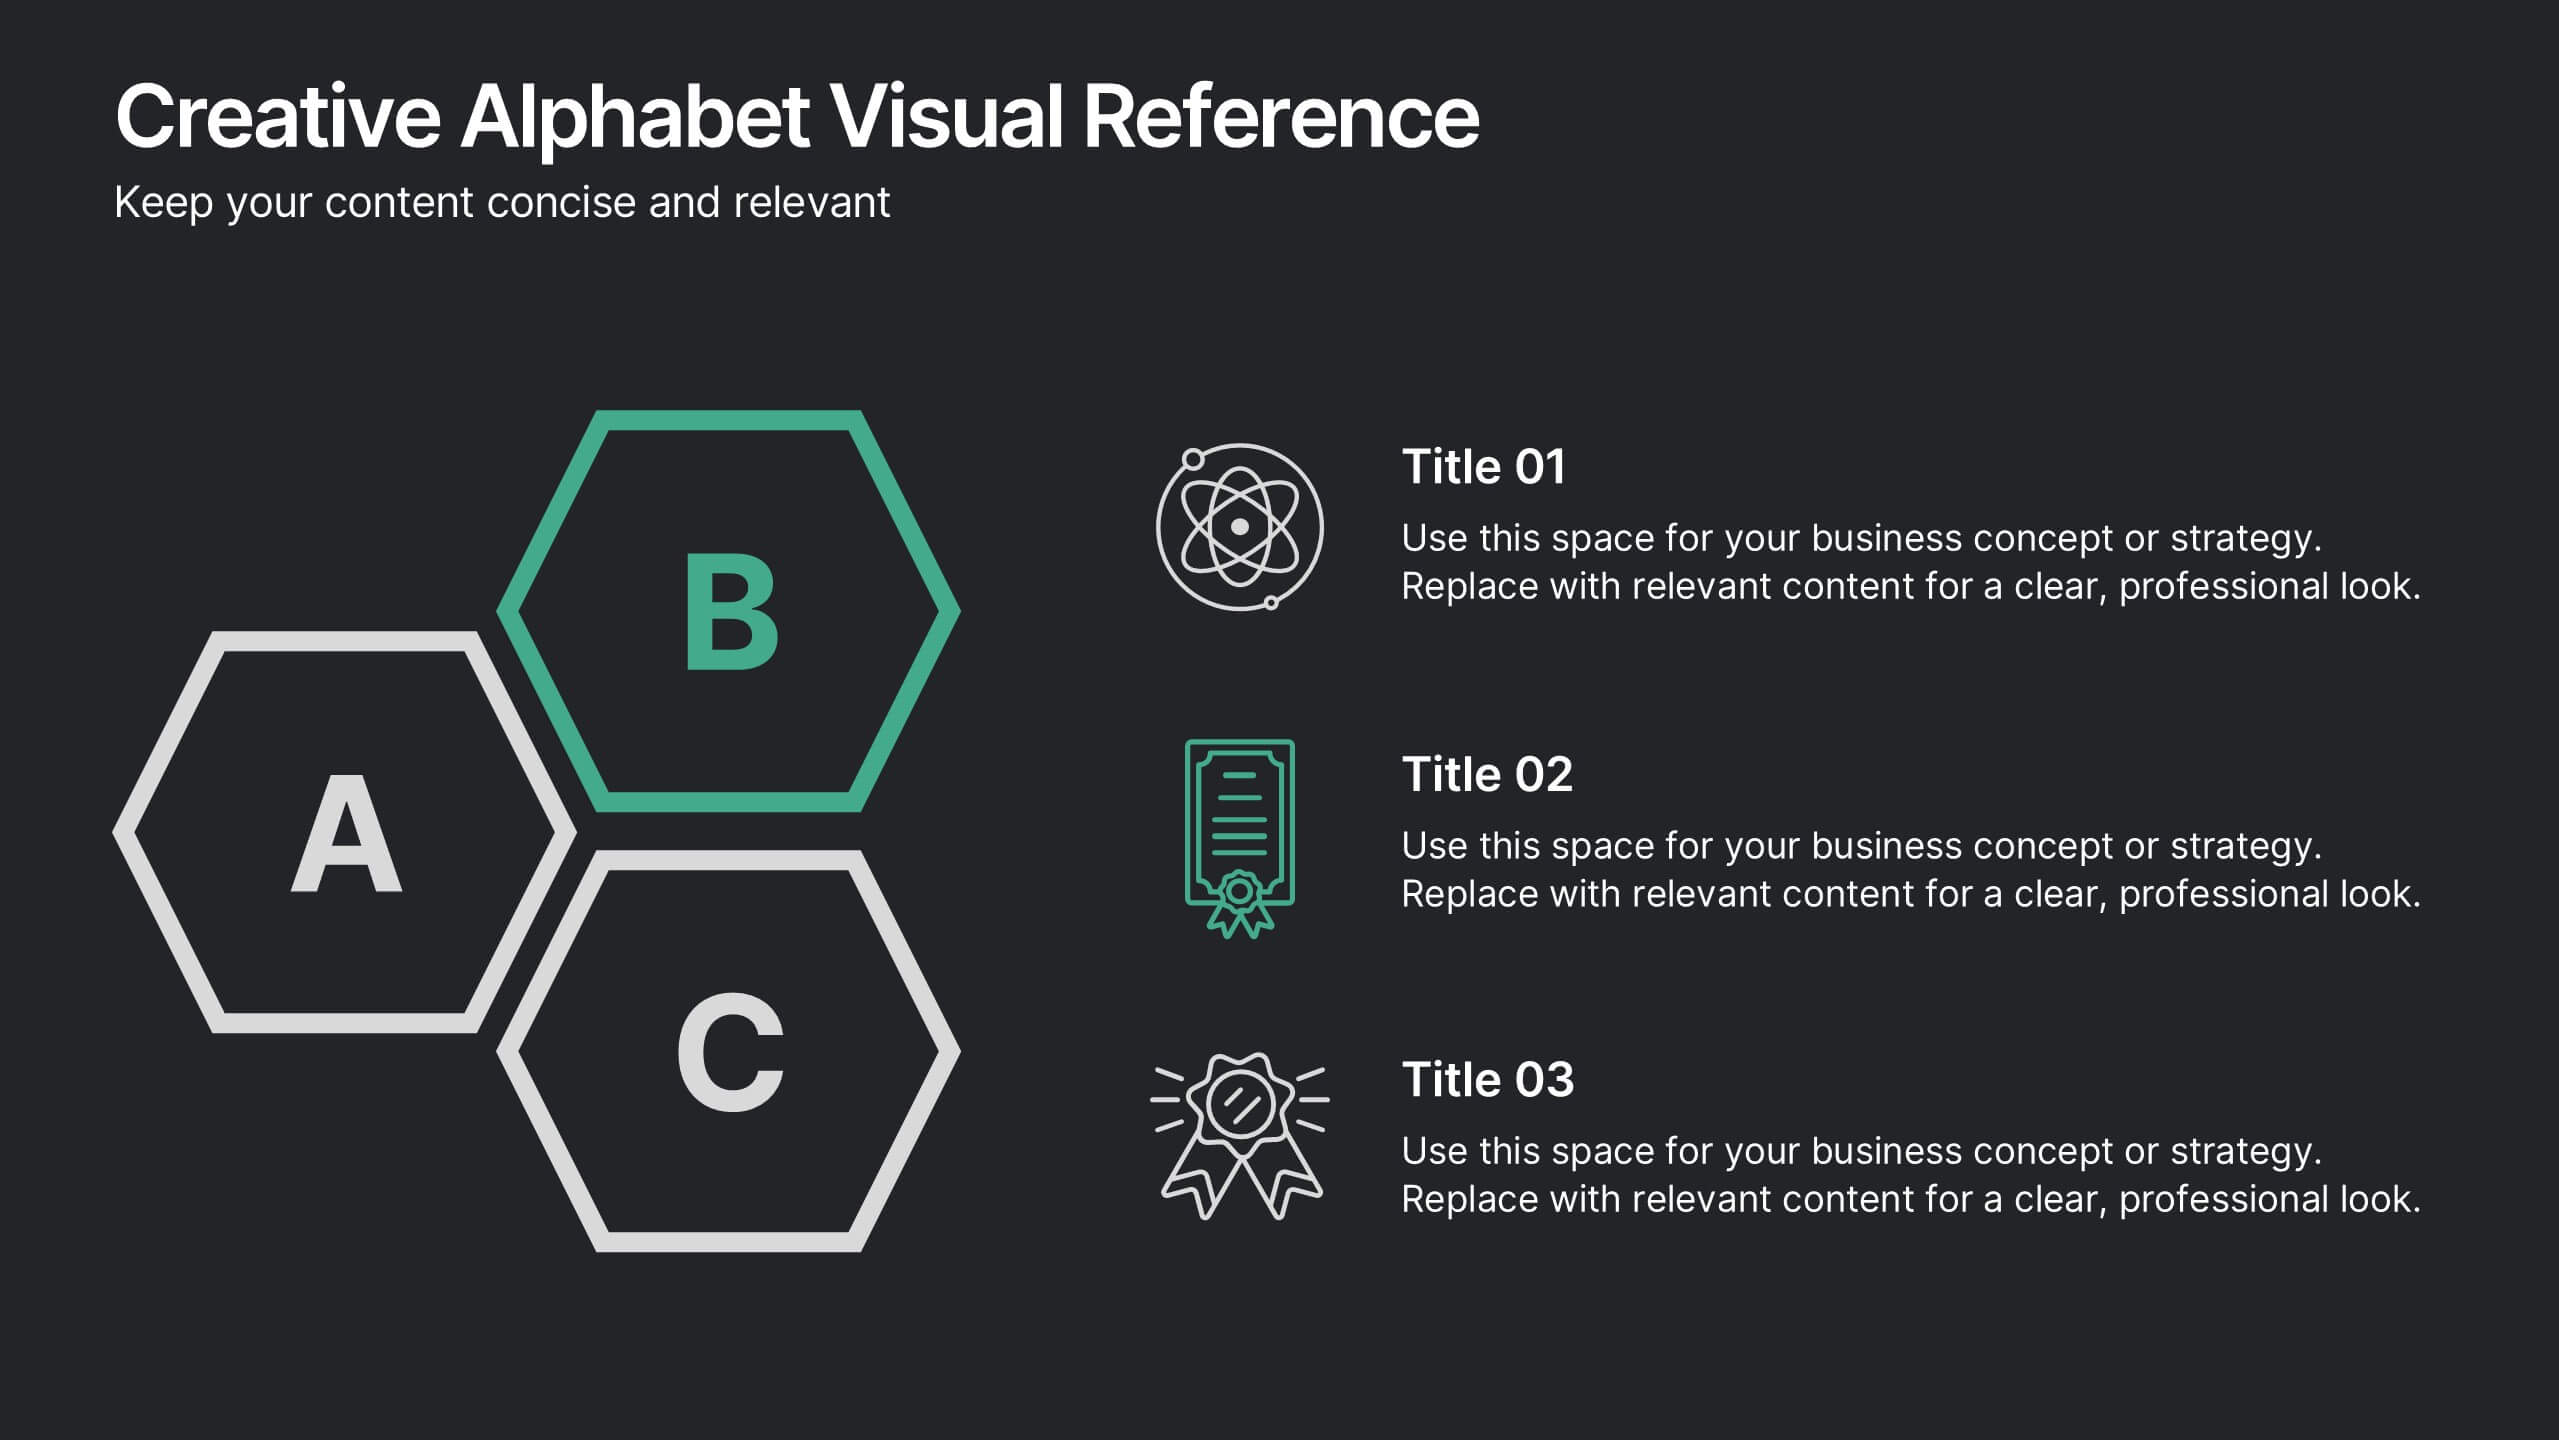
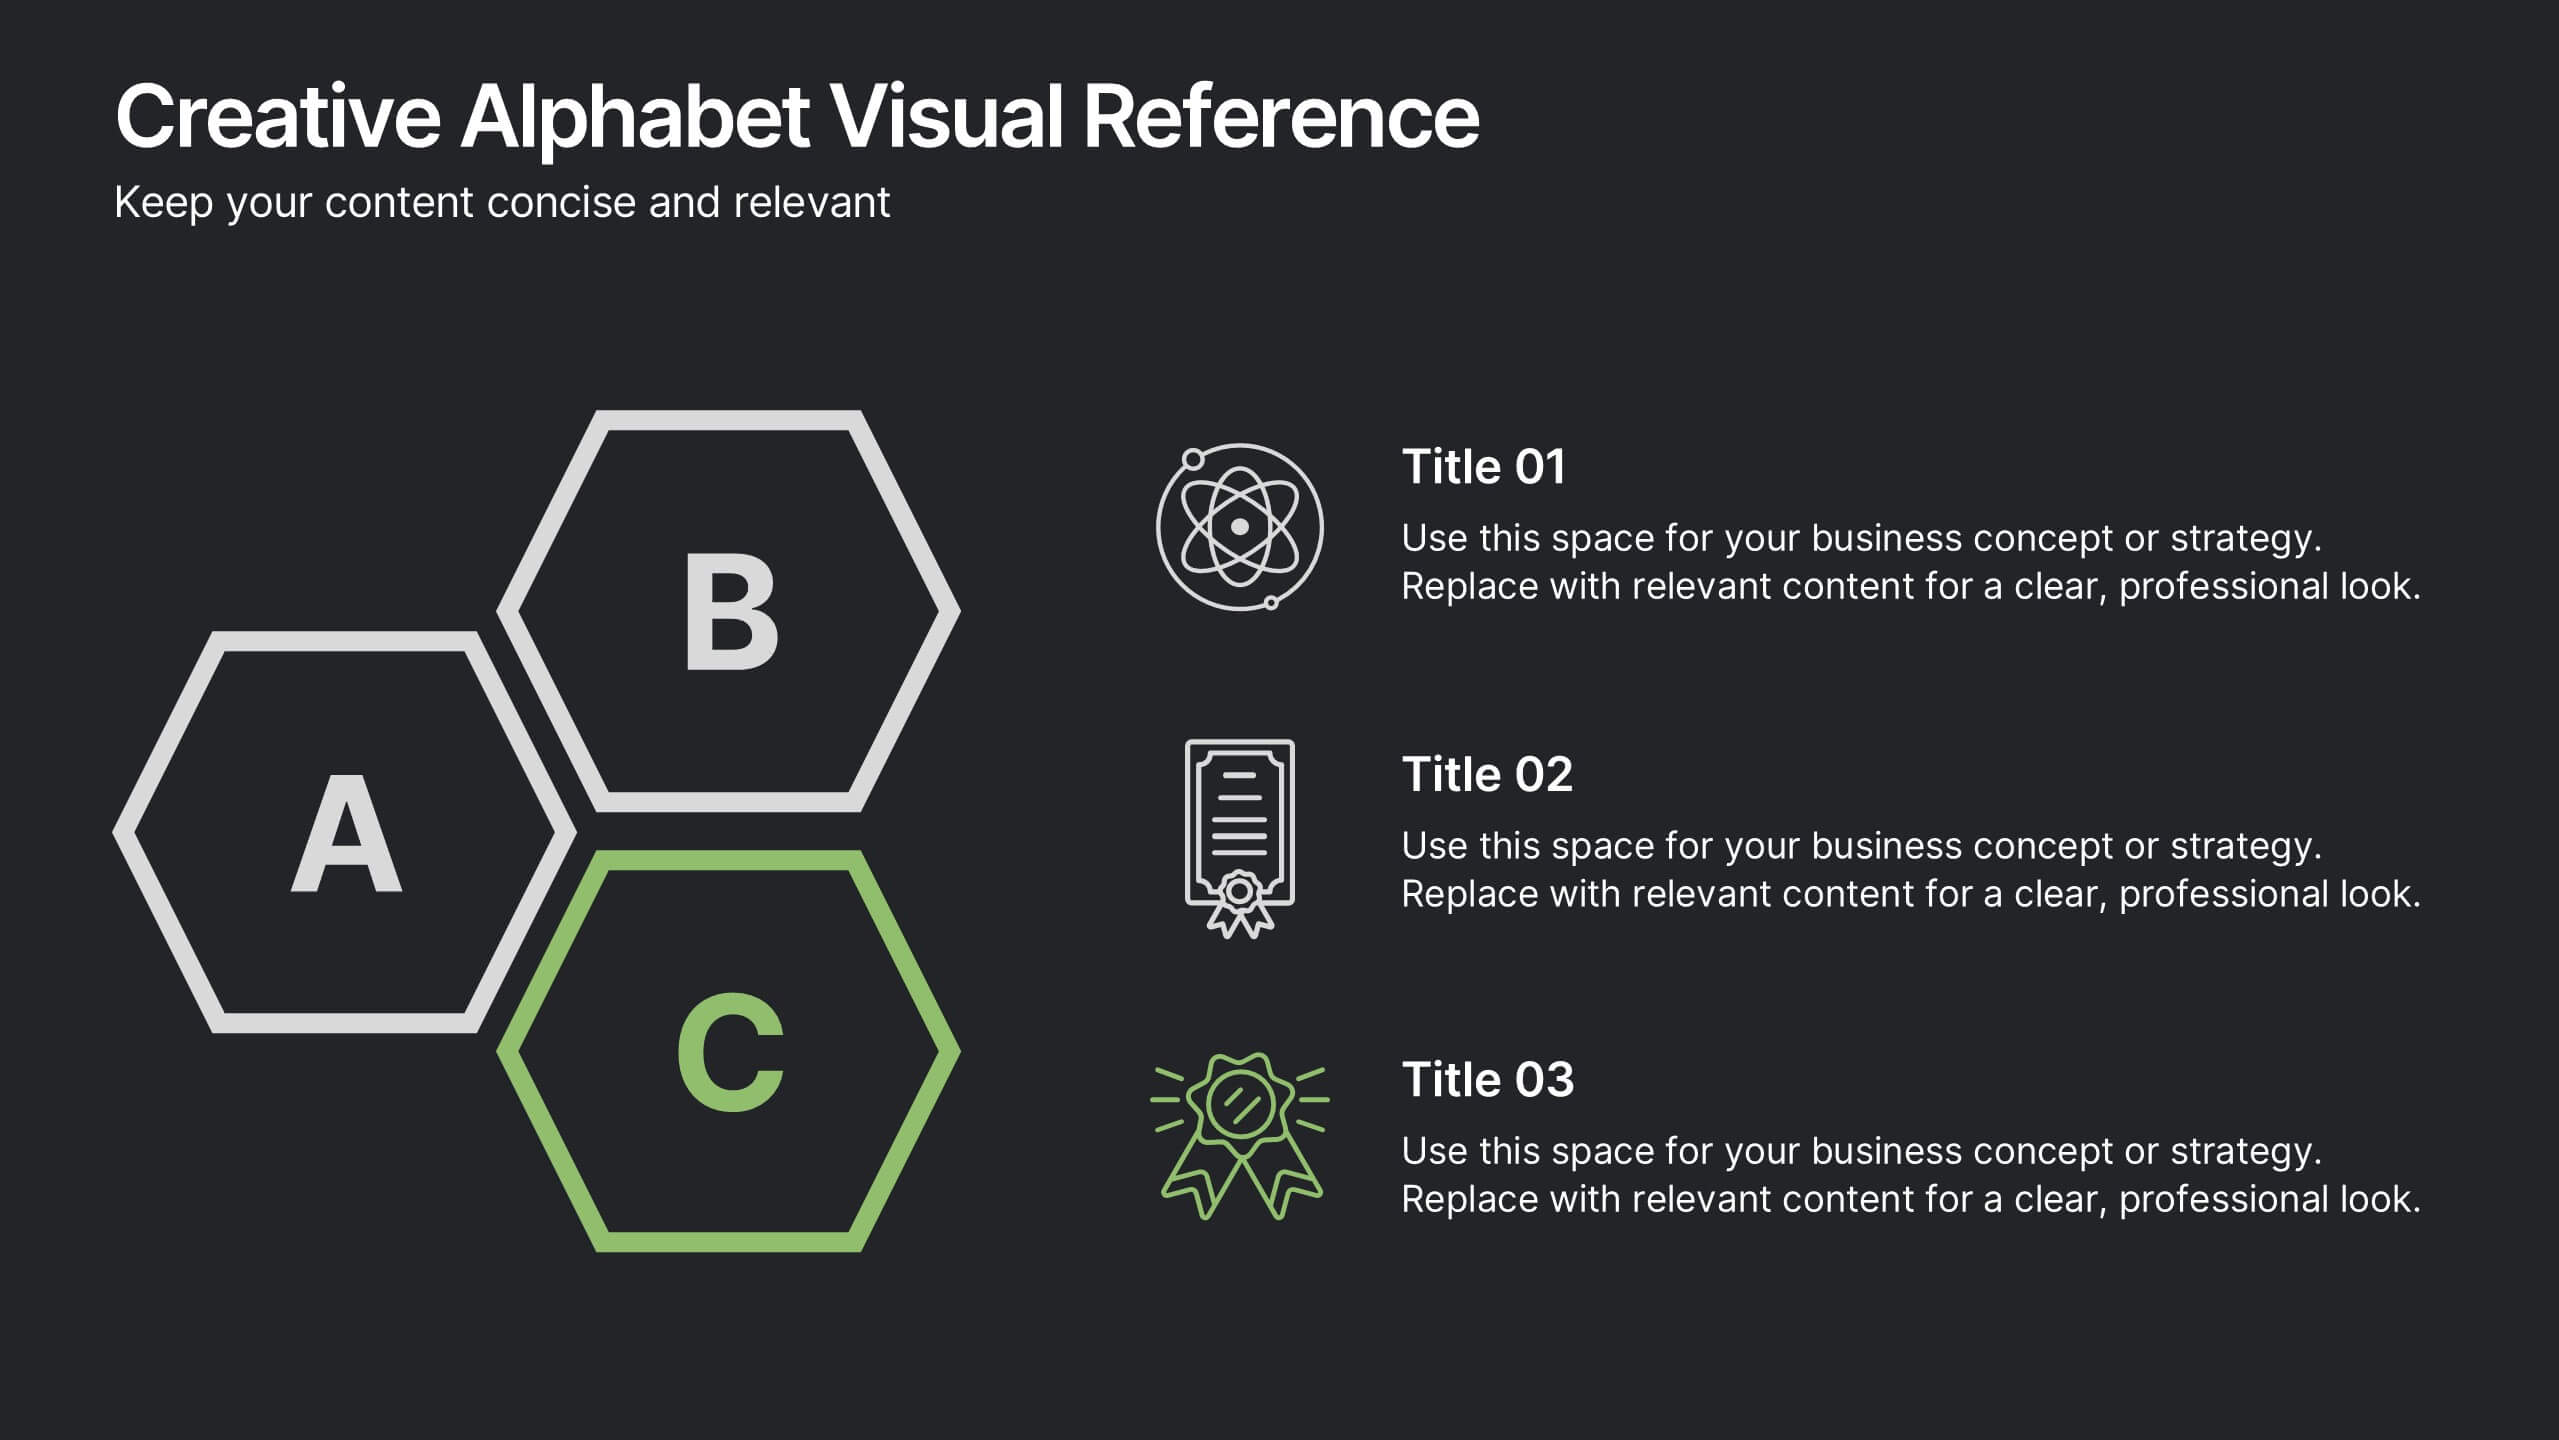
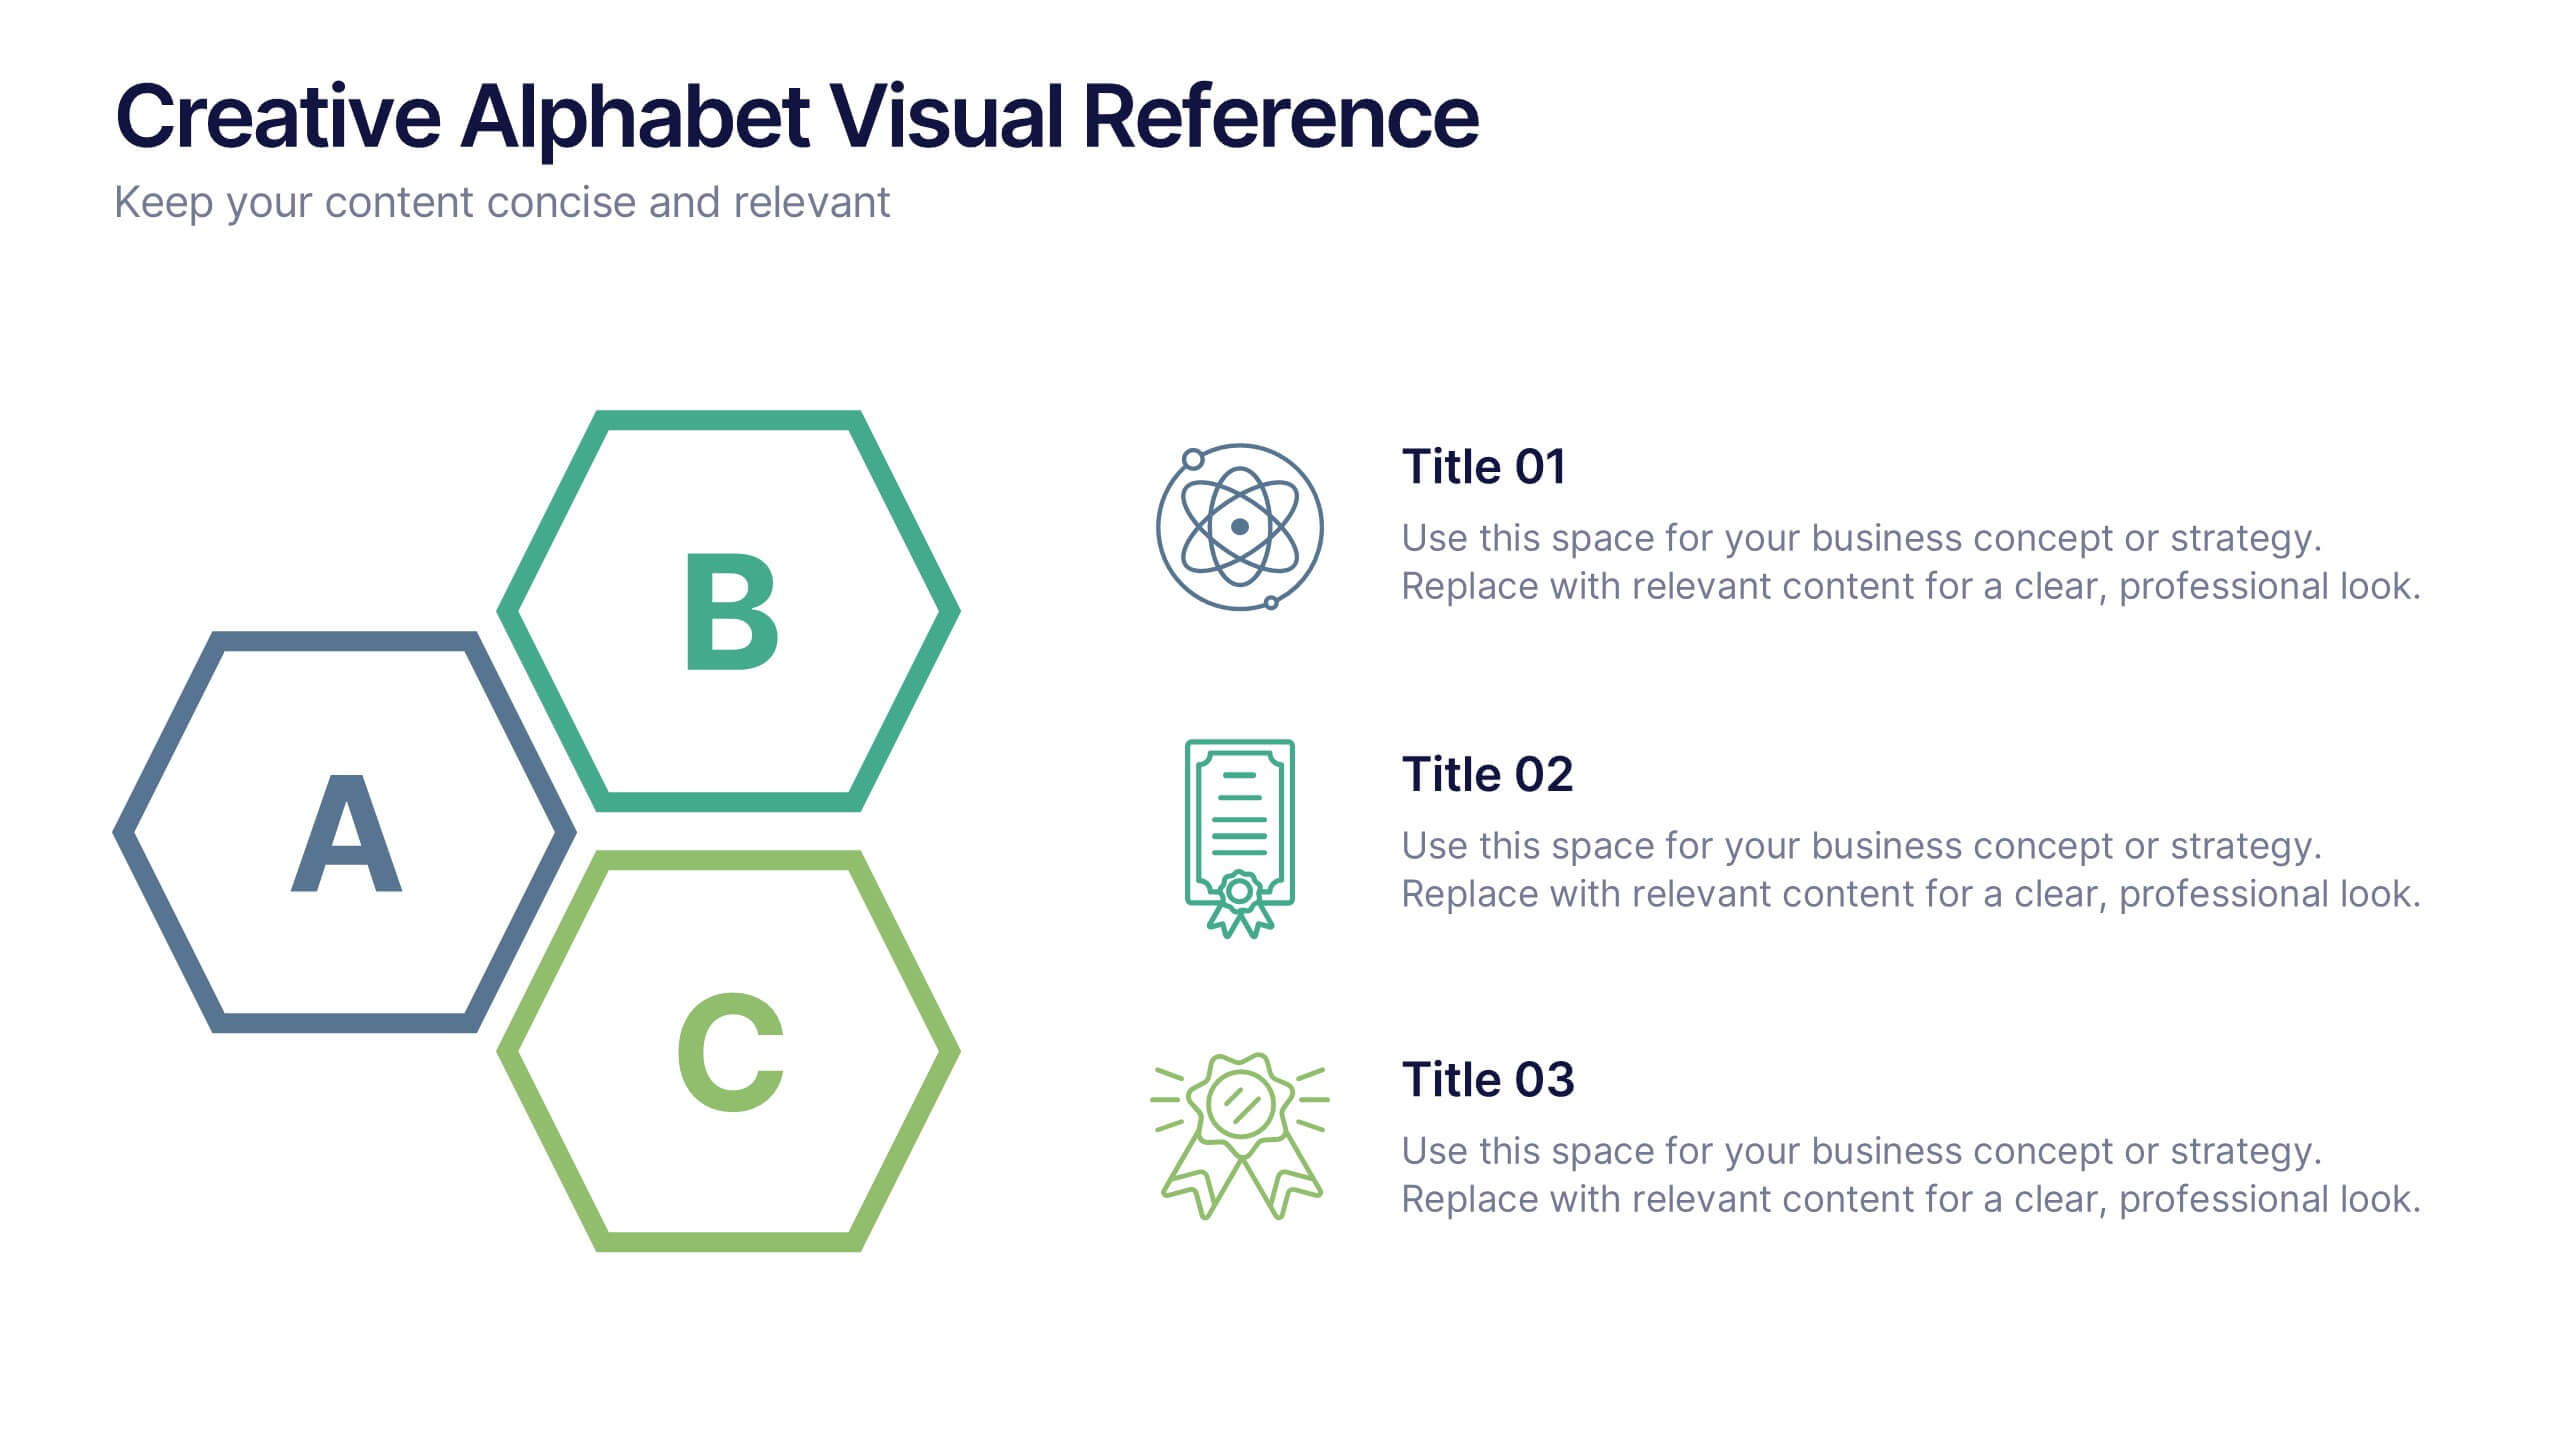
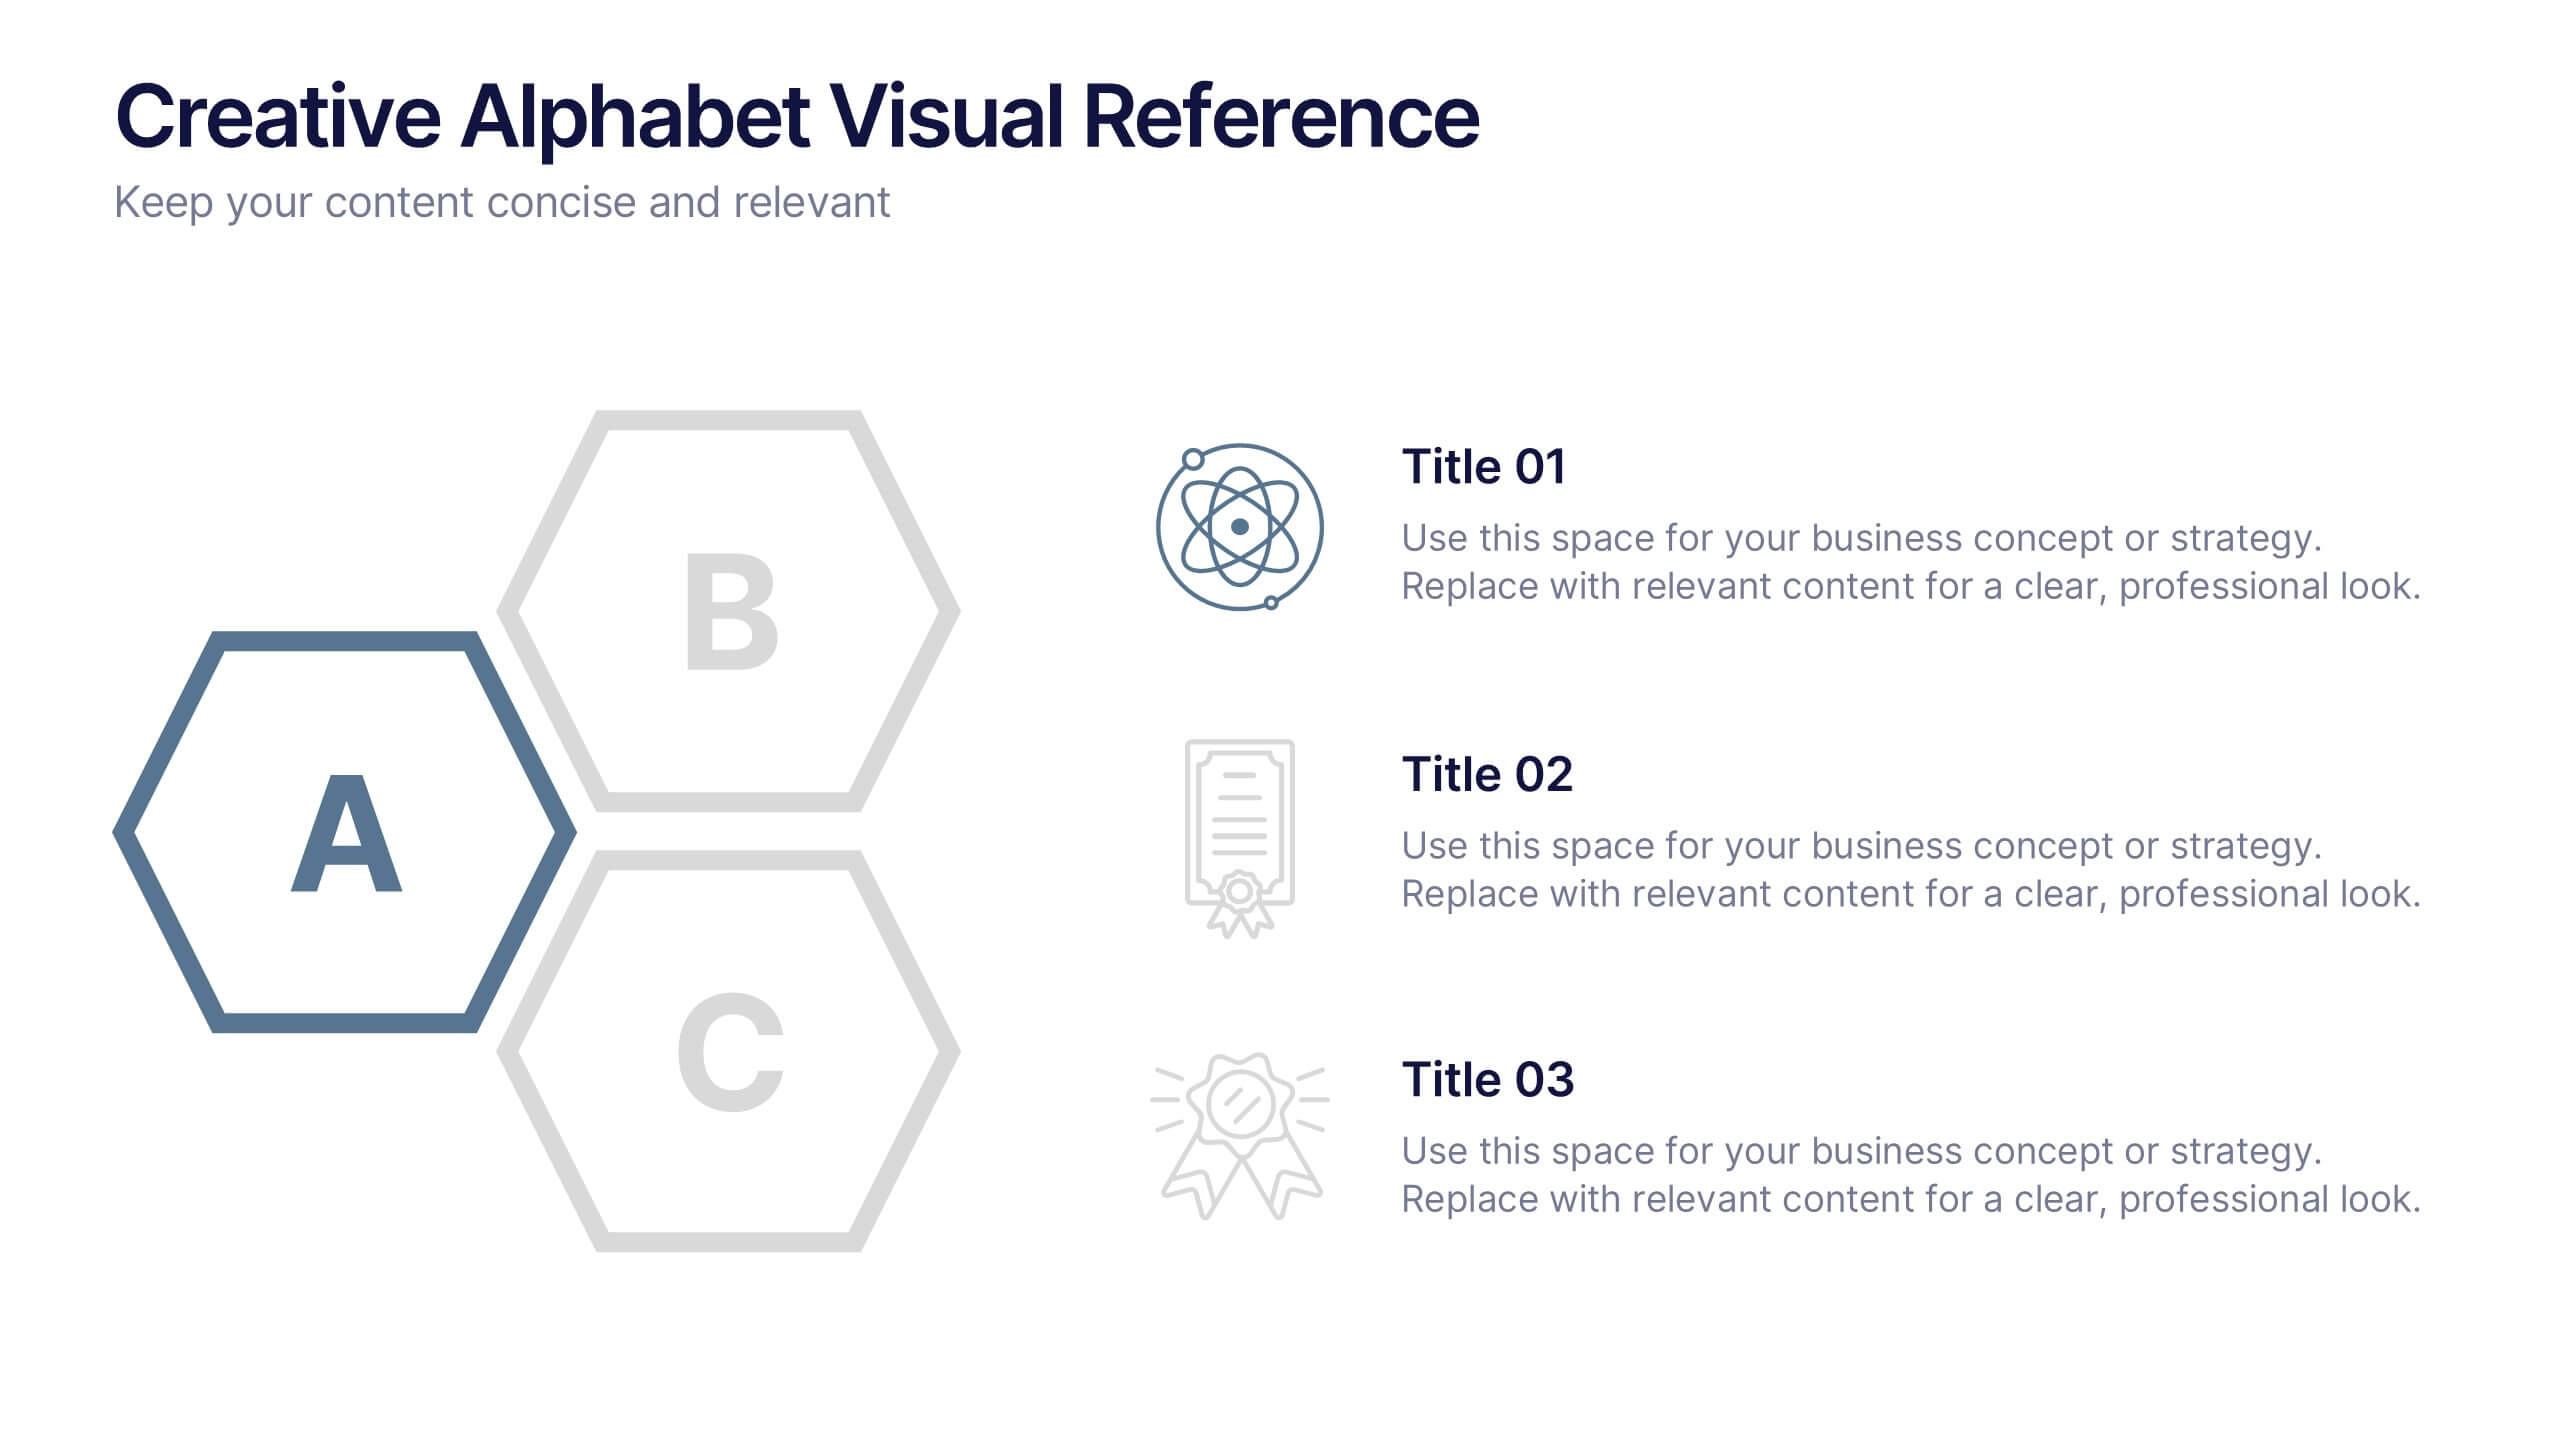
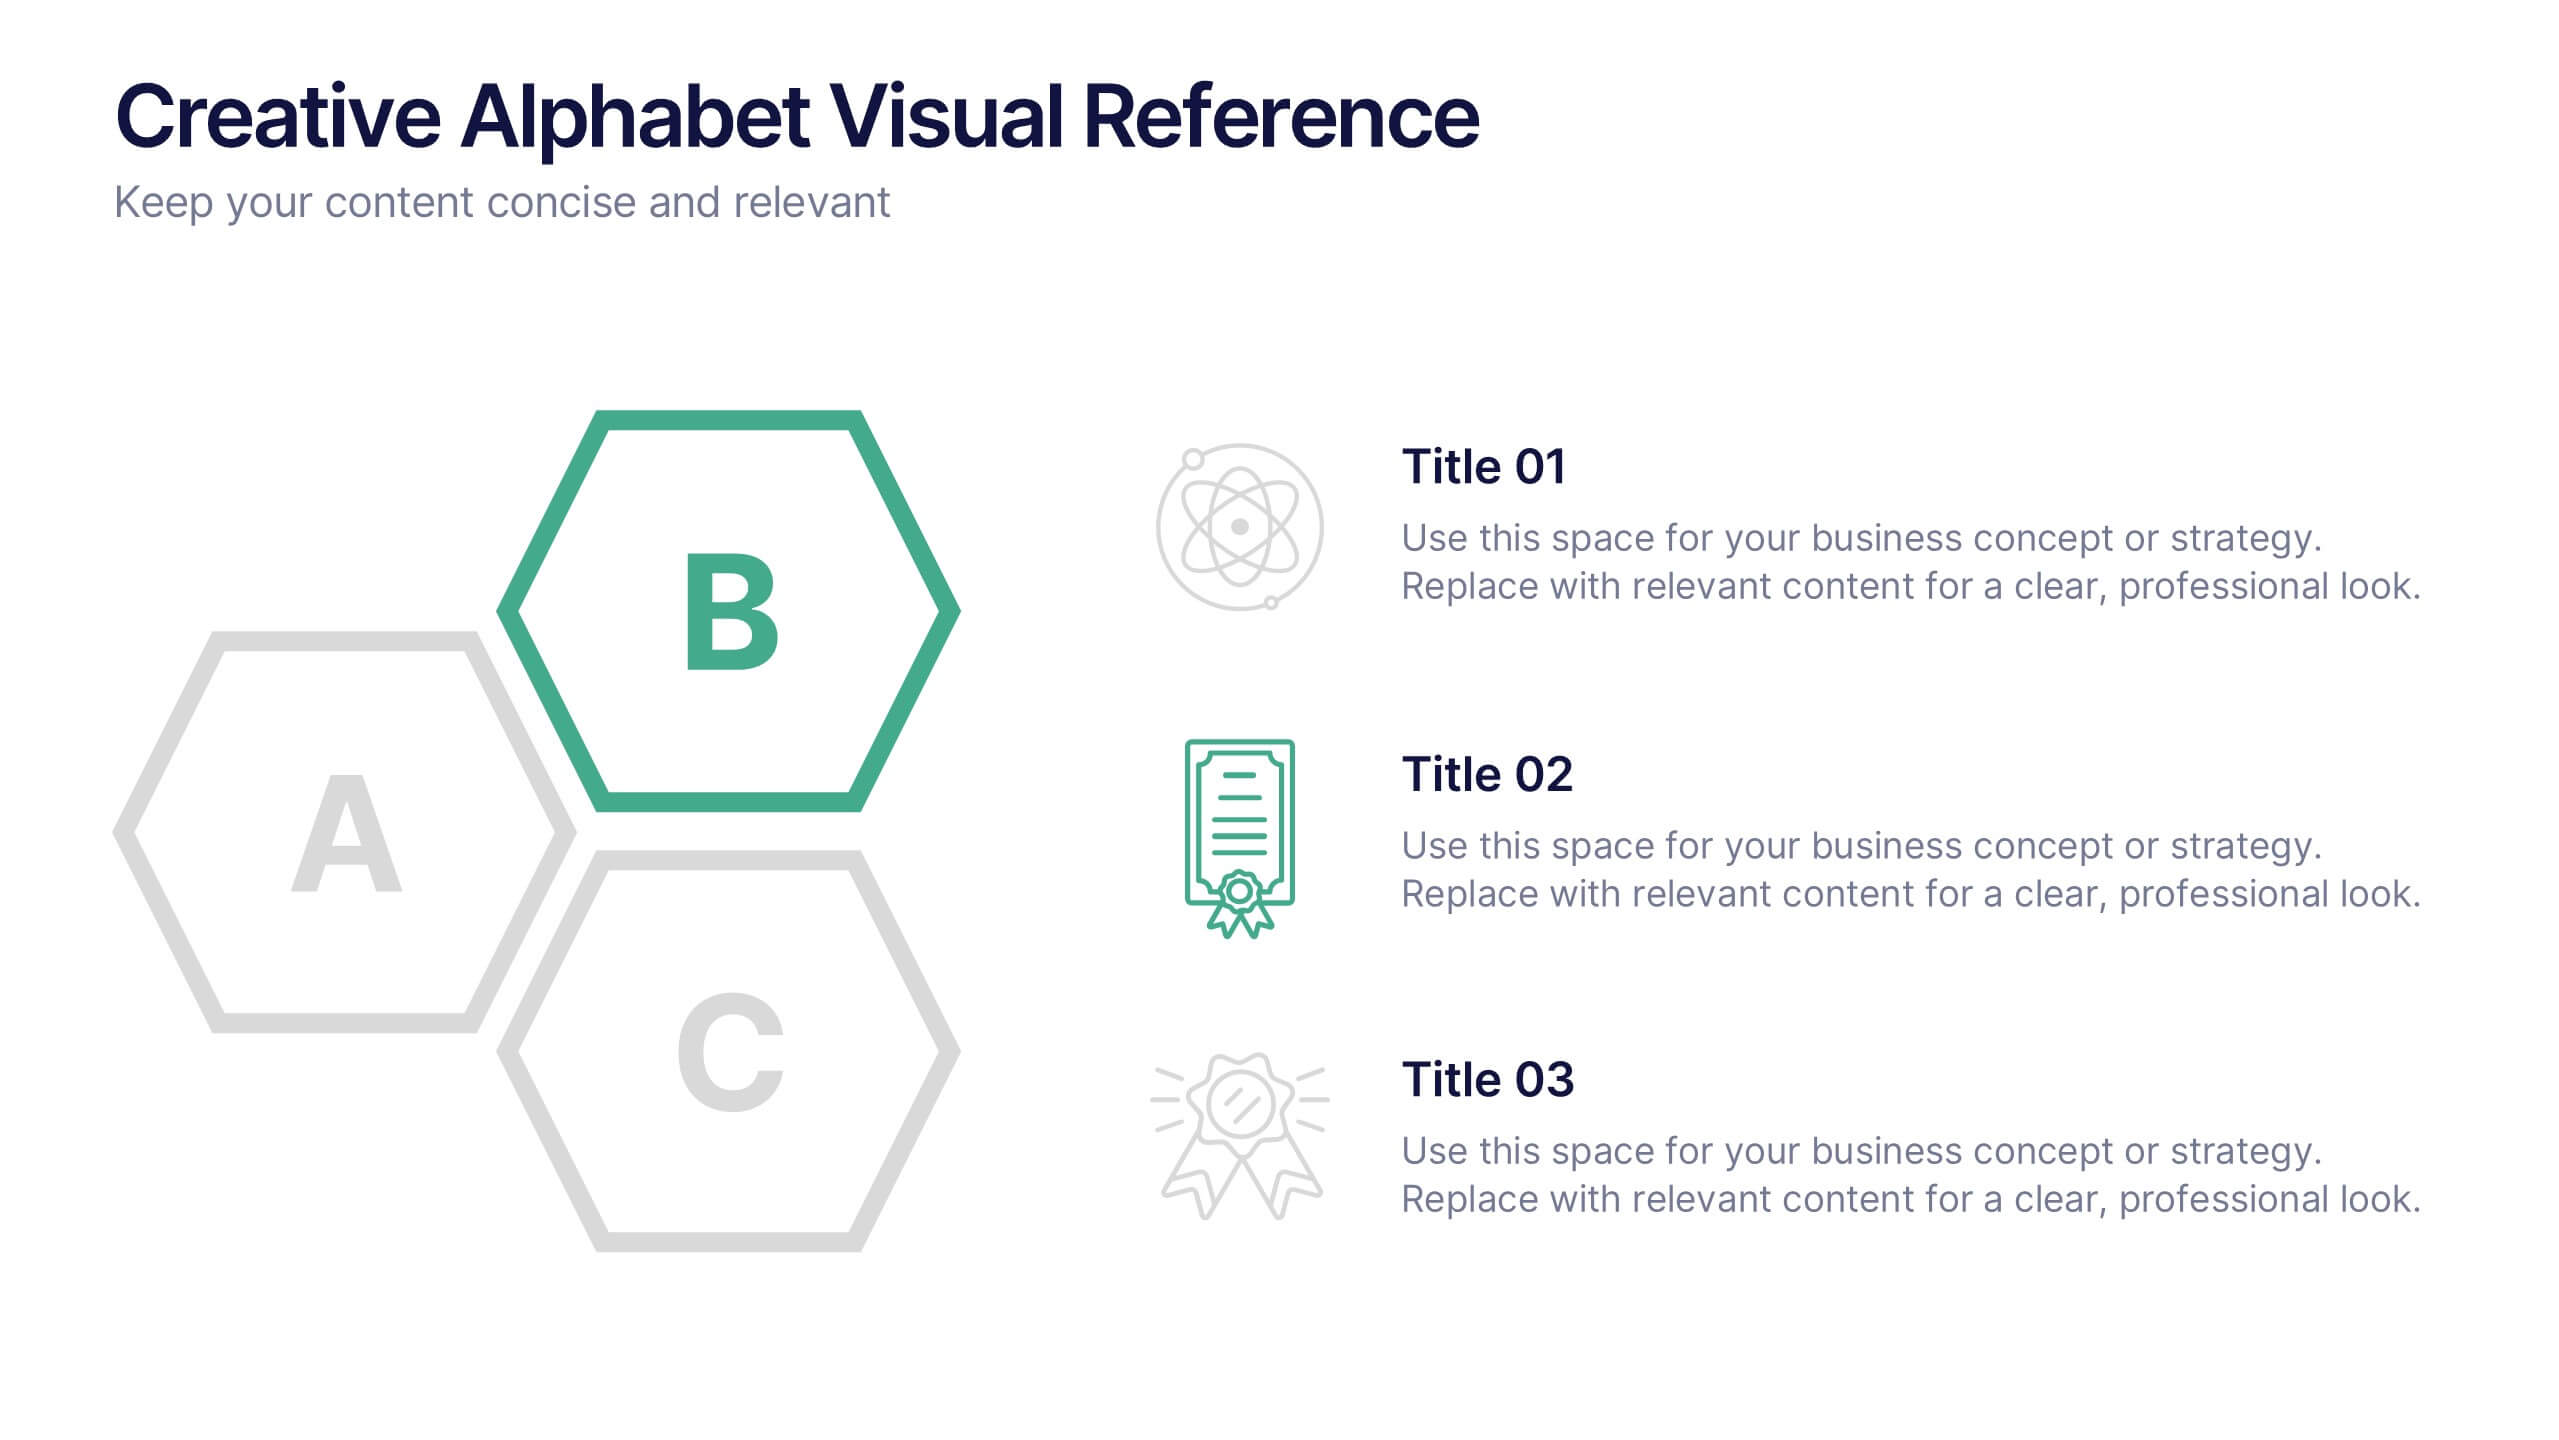
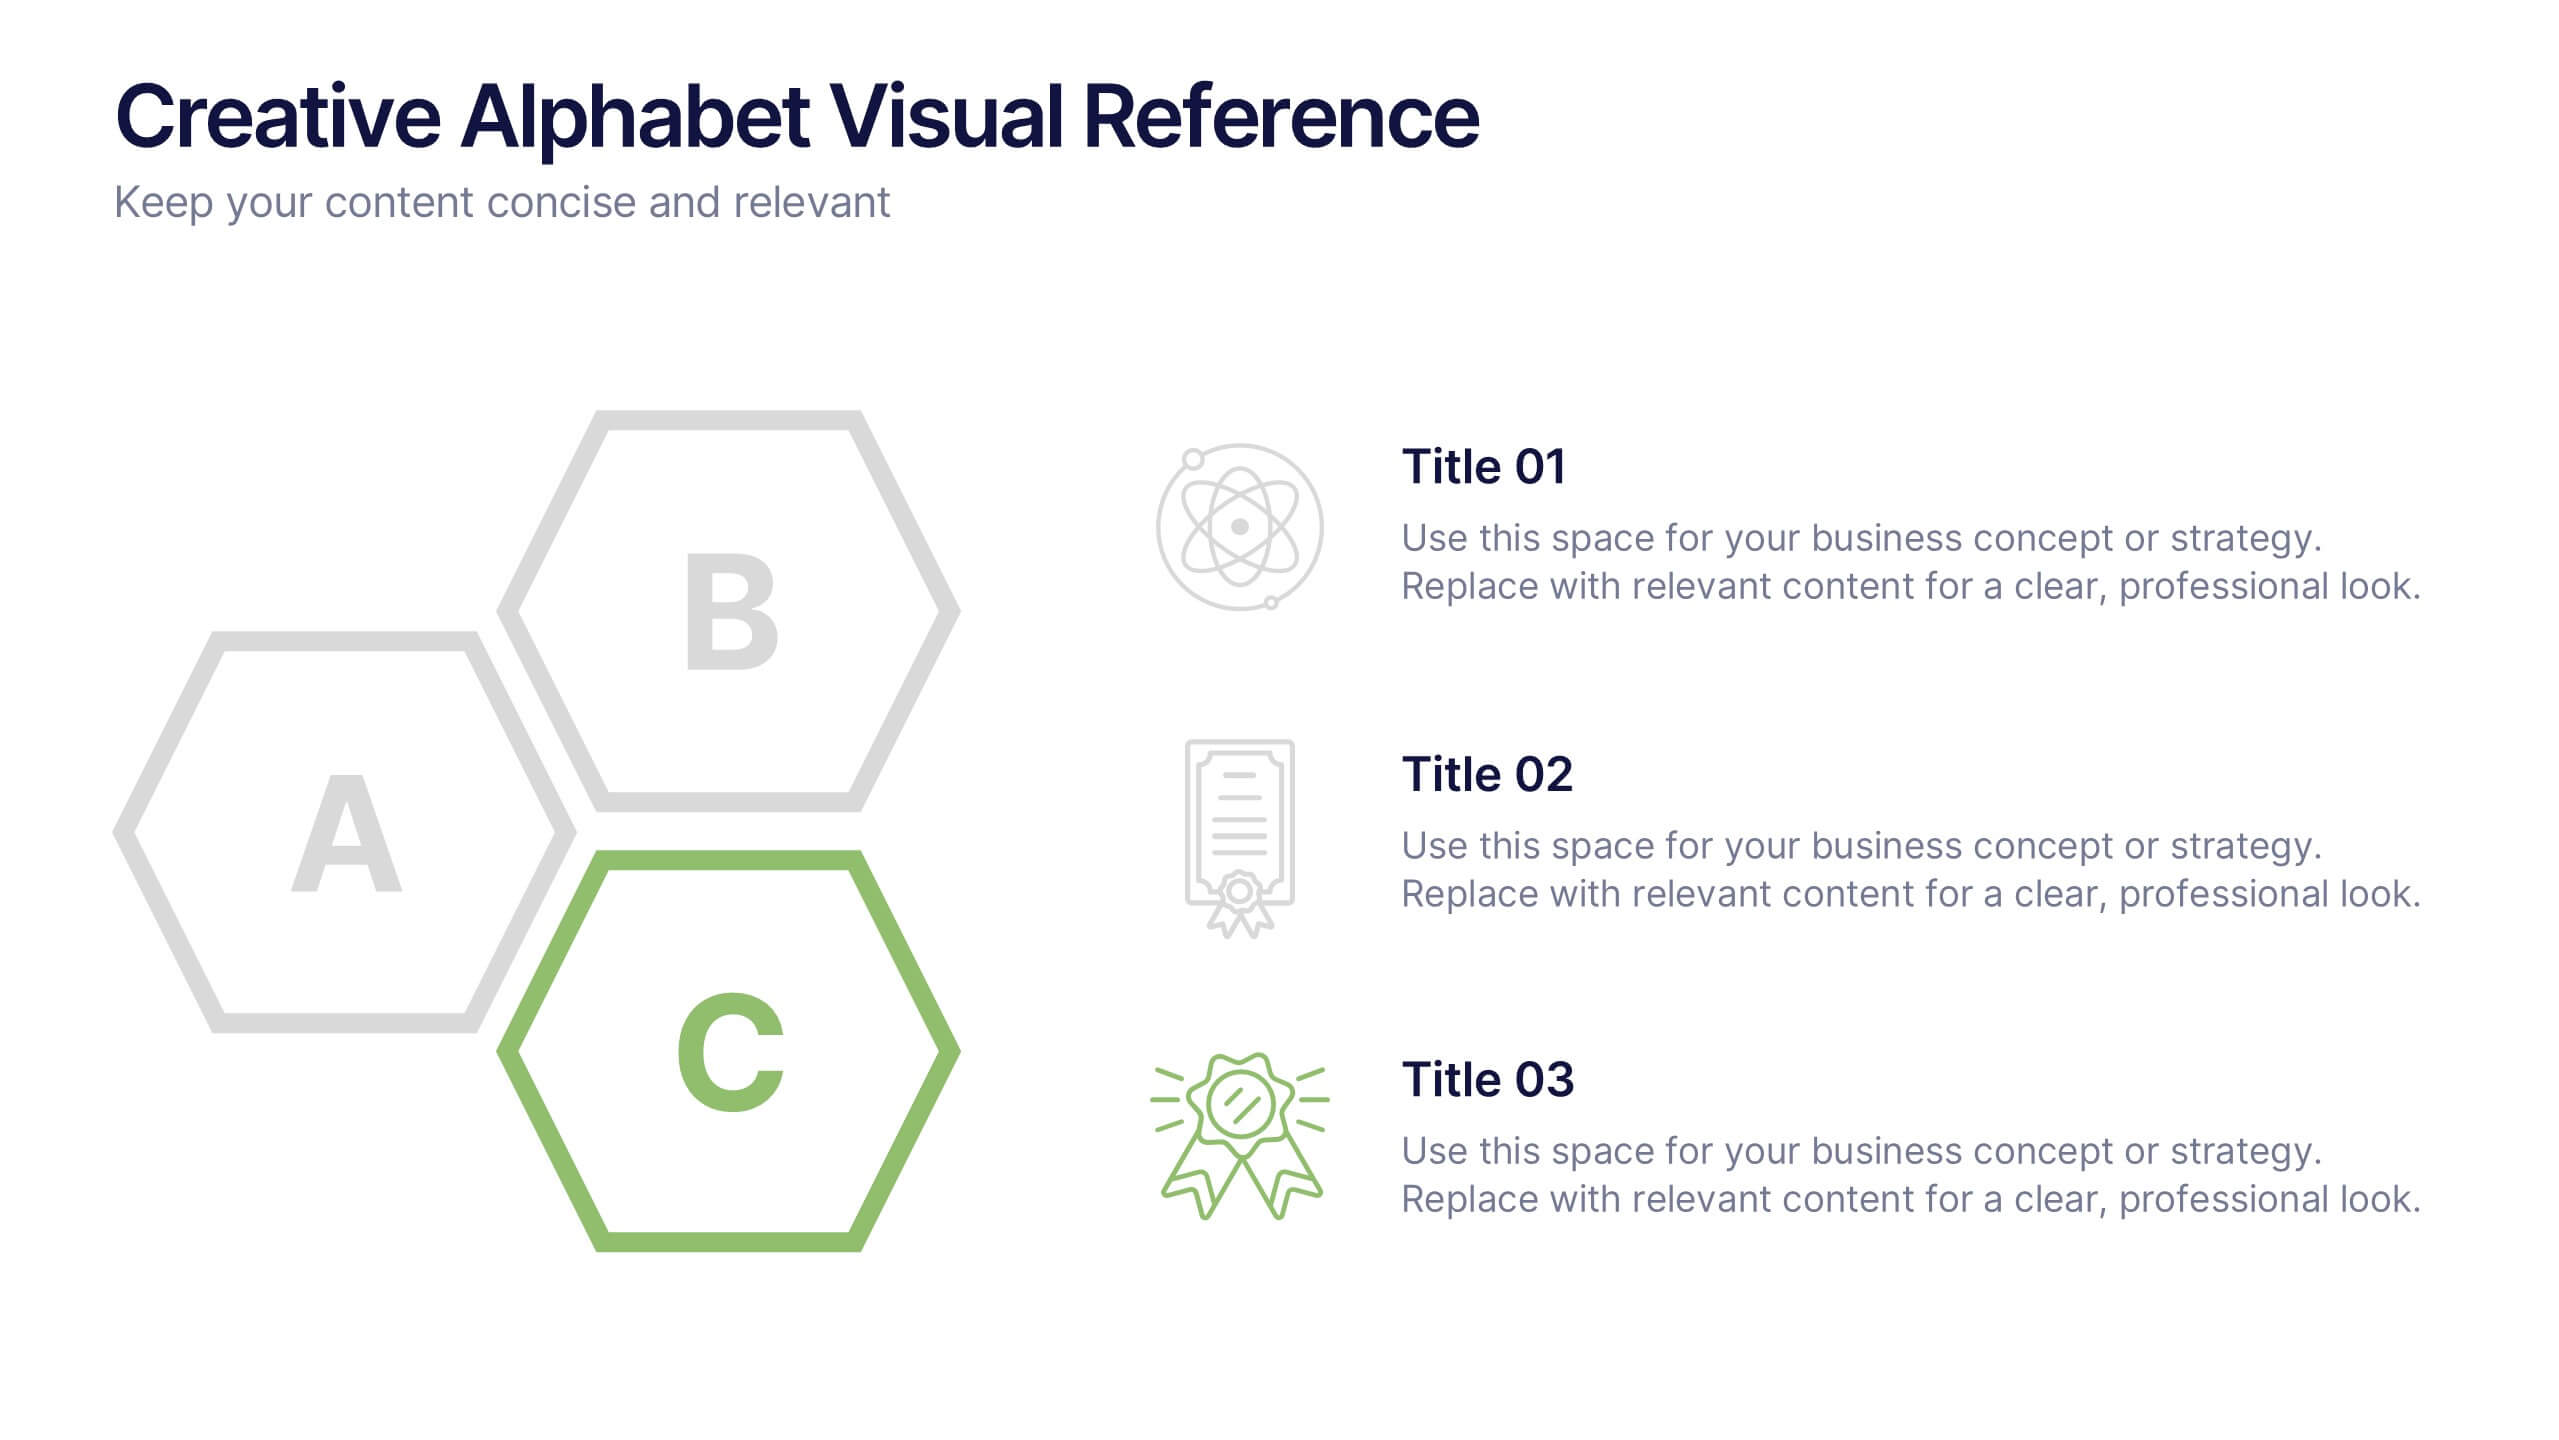
Creative Alphabet Visual Reference Presentation
This creative presentation uses a bold A–B–C visual structure to highlight key points in a clean, modern layout. Ideal for overviews, comparisons, or step-by-step frameworks. Fully customizable in Canva, it balances design and clarity—perfect for business strategies, education, or visual storytelling with strong alphabetical cues and icon integration.


5 slides
Editable World Map Infographic Presentation
Bring your global insights to life with this clean, modern presentation designed to explain international data in a clear, engaging way. Visual markers and simple layouts help you highlight key regions, trends, and comparisons with ease. Fully compatible with PowerPoint, Keynote, and Google Slides.


5 slides
Editable Asia Region Map Slide Presentation
Explore data across countries with a sleek regional map designed to visualize insights and connections in a clear, professional way. Perfect for presenting market trends, business reach, or project highlights across Asia, this editable layout is fully compatible with PowerPoint, Keynote, and Google Slides for easy customization.


4 slides
Medical Theme Slides for Healthcare Presentation
Bring clarity and care to your data storytelling with this modern healthcare-themed presentation. Designed for hospitals, clinics, or medical professionals, it helps you present health data, research findings, and patient care insights with professionalism and trust. Fully customizable and compatible with PowerPoint, Keynote, and Google Slides for seamless editing.


4 slides
Customer Feedback Report Presentation
Transform audience insights into actionable strategies with this clean, data-focused presentation. Designed to highlight customer satisfaction trends, improvement areas, and feedback analysis, it helps visualize complex information with clarity and flow. Fully customizable and compatible with PowerPoint, Keynote, and Google Slides for a polished, professional, and presentation-ready report.


26 slides
Denice Presentation Template
Denice is a creative template with a bold and professional look. This template has a chic, modern aesthetic that grabs attention and makes an impact on your audience. The colors are soft nudes which help keep the look clean and easy to read. The soft nudes are sure to catch your readers' attention without being overwhelming. The graphs, timelines and charts make this template perfect for promotional campaigns. In addition to its professional look, Denice also comes loaded with features and tools to help you reach your audience. Save time and effort by choosing the Denice template.


5 slides
Pricing Strategy and Comparison Table Presentation
Present your pricing plans with clarity and impact using the Pricing Strategy and Comparison Table Presentation. This slide offers a structured layout to compare features, pricing tiers, and plan benefits side-by-side. Perfect for SaaS, services, or product pitches. Fully editable in Canva, PowerPoint, Google Slides, and Keynote.


7 slides
Veterinary Hospital Infographic
A veterinary hospital, is a medical facility that provides healthcare services to animals, primarily focusing on the diagnosis, treatment, and prevention of illnesses and injuries in pets and other animals. This vibrant and heartwarming infographic template brings to life the journey of our beloved pets through the lens of a caring veterinary hospital. Compatible with Powerpoint, Keynote, and Google Slides. This template celebrates the love, care, and healing that happens every day at veterinary hospitals. This infographic is a haven where wagging tails and purring hearts find comfort and a reason to smile.


8 slides
Machine Learning Overview Presentation
The "Machine Learning Overview" presentation template features a central circular design that effectively illustrates the interconnectedness of various components in machine learning processes. Each segment of the circle is dedicated to a key area such as data acquisition, algorithm development, model training, validation, and deployment, which are critical to understanding and executing machine learning projects. This visual arrangement makes it easy to follow and is ideal for educational environments or professional settings where clarity and concise information delivery are essential.


10 slides
Effective Team Communication Presentation
Streamline your Effective Team Communication with this modern infographic template. Designed to enhance collaboration and workflow clarity, this slide helps visualize key communication strategies for better team efficiency. Fully customizable in PowerPoint, Keynote, and Google Slides, making it perfect for corporate training, leadership meetings, and project planning.


24 slides
Minerva UX Design Presentation
Elevate your UX design presentations with this comprehensive template, featuring sections for project overview, user research, wireframes, prototyping, and usability testing. Showcase design systems, branding guidelines, and accessibility considerations with ease. Perfect for demonstrating a user-centered approach. Compatible with PowerPoint, Keynote, and Google Slides for seamless customization.


4 slides
Remote Team Management Slides Presentation
Bring virtual teamwork into focus with a clean, collaborative design that makes managing distributed teams feel effortless. This presentation breaks down communication, coordination, and workflow strategies to help leaders guide remote groups with clarity and structure. Fully customizable and compatible with PowerPoint, Keynote, and Google Slides.


12 slides
Corporate Growth Strategy Steps Presentation
Showcase your expansion roadmap with this Corporate Growth Strategy Steps Presentation. Designed as a five-step vertical ladder, this layout is perfect for illustrating progressive stages like market entry, development, scaling, innovation, and leadership. Each level includes editable icons and text placeholders for clarity and customization. Fully compatible with PowerPoint, Keynote, and Google Slides.


7 slides
Aviation Infographic Presentation Template
Featuring our light, vibrant and eye-catching aviation infographic template compatible with PowerPoint. The theme is designed to show you the key facts and figures about your topic, so you can easily produce a stunning presentation. This infographic is a visual representation of information related to aviation, presented in a clear and visually appealing way. With this template cover topics such as aviation history or the economic impact of the aviation industry. The information in the template can be in the form of statistics, data visualizations, timelines, maps, or other graphical elements.