


Features
- 6 Unique slides
- Fully editable and easy to edit in Microsoft Powerpoint, Keynote and Google Slides
- 16:9 widescreen layout
- Clean and professional designs
- Export to JPG, PDF or send by email


Do you have any questions?
Recommend


6 slides
Responsibility Assignment Matrix Level Infographic
A Responsibility Assignment Matrix (RAM), is a useful tool in project management to define and clarify roles and responsibilities for various tasks and activities. This infographic template is a tool used in project management and organizational structure to define and communicate the roles and responsibilities of team members in tasks. This template will ensure that everyone involved in the project or process understands their roles and tasks, reducing confusion and improving accountability. This infographic will summarize the key points of your Responsibility Assignment Matrix. Compatible with Powerpoint, Keynote, and Google Slides.


7 slides
30 60 90 Day Plan Infographic Presentation Template
A 30-60-90 day plan is a strategy that outlines an individual's goals and action plans for the first 30, 60, and 90 days of their new role or job. It is often used to demonstrate someone's understanding of their role, and showcase their plans to contribute to their company's success. The 30-60-90 day plan is typically broken down into three stages: the first 30 days, the next 60 days, and the final 90 days. This template is made to be a useful tool for you, use it to demonstrate your commitment and value to your company. Present your business plan and ideas with this easy to follow template.


6 slides
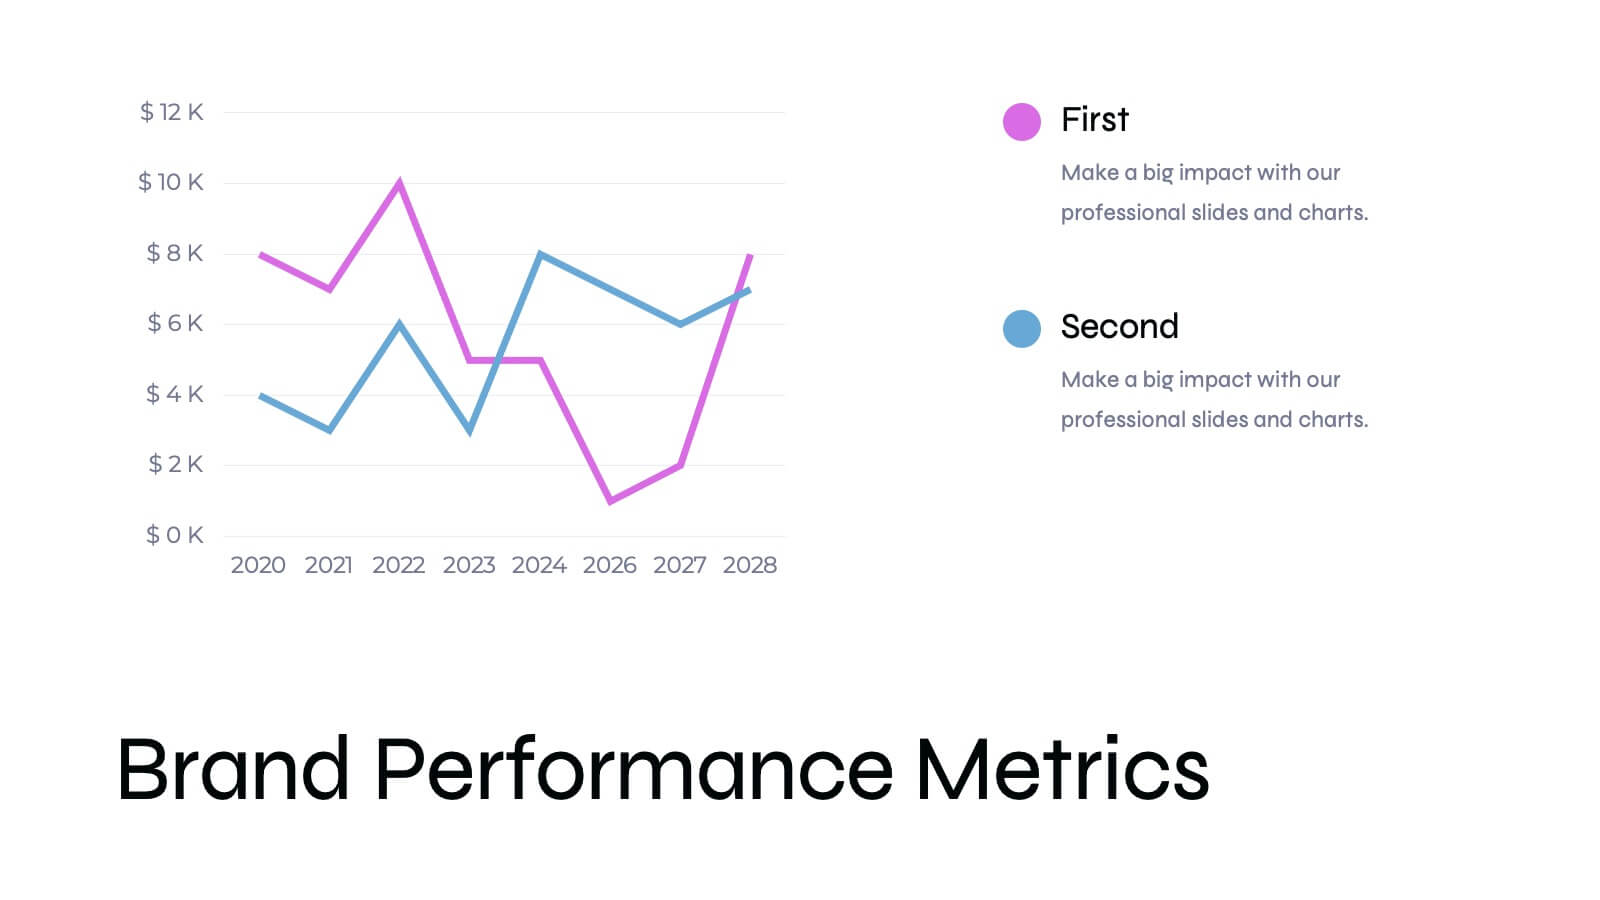
Financial Health Overview Dashboard Presentation
Simplify financial reporting with this Financial Health Overview Dashboard. Designed for analysts, executives, and consultants, it features a visual summary of key metrics and performance insights. Fully editable with icon placeholders and balanced layout. Ideal for PowerPoint, Keynote, and Google Slides presentations that demand clarity in financial storytelling.


20 slides
Spartan Content Marketing Pitch Deck Presentation
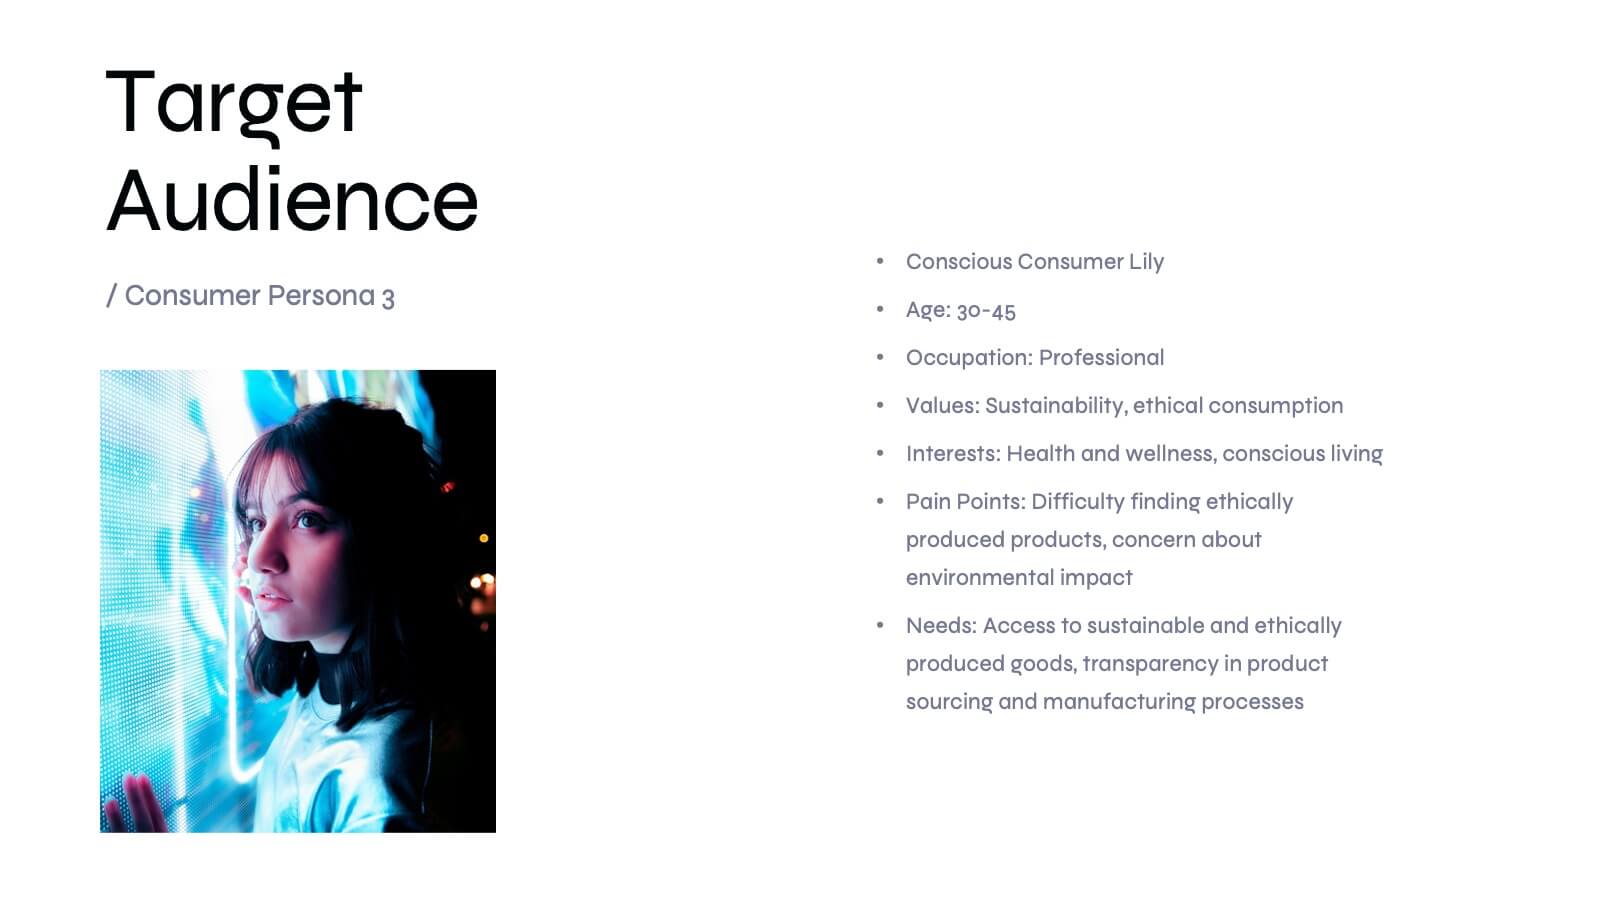
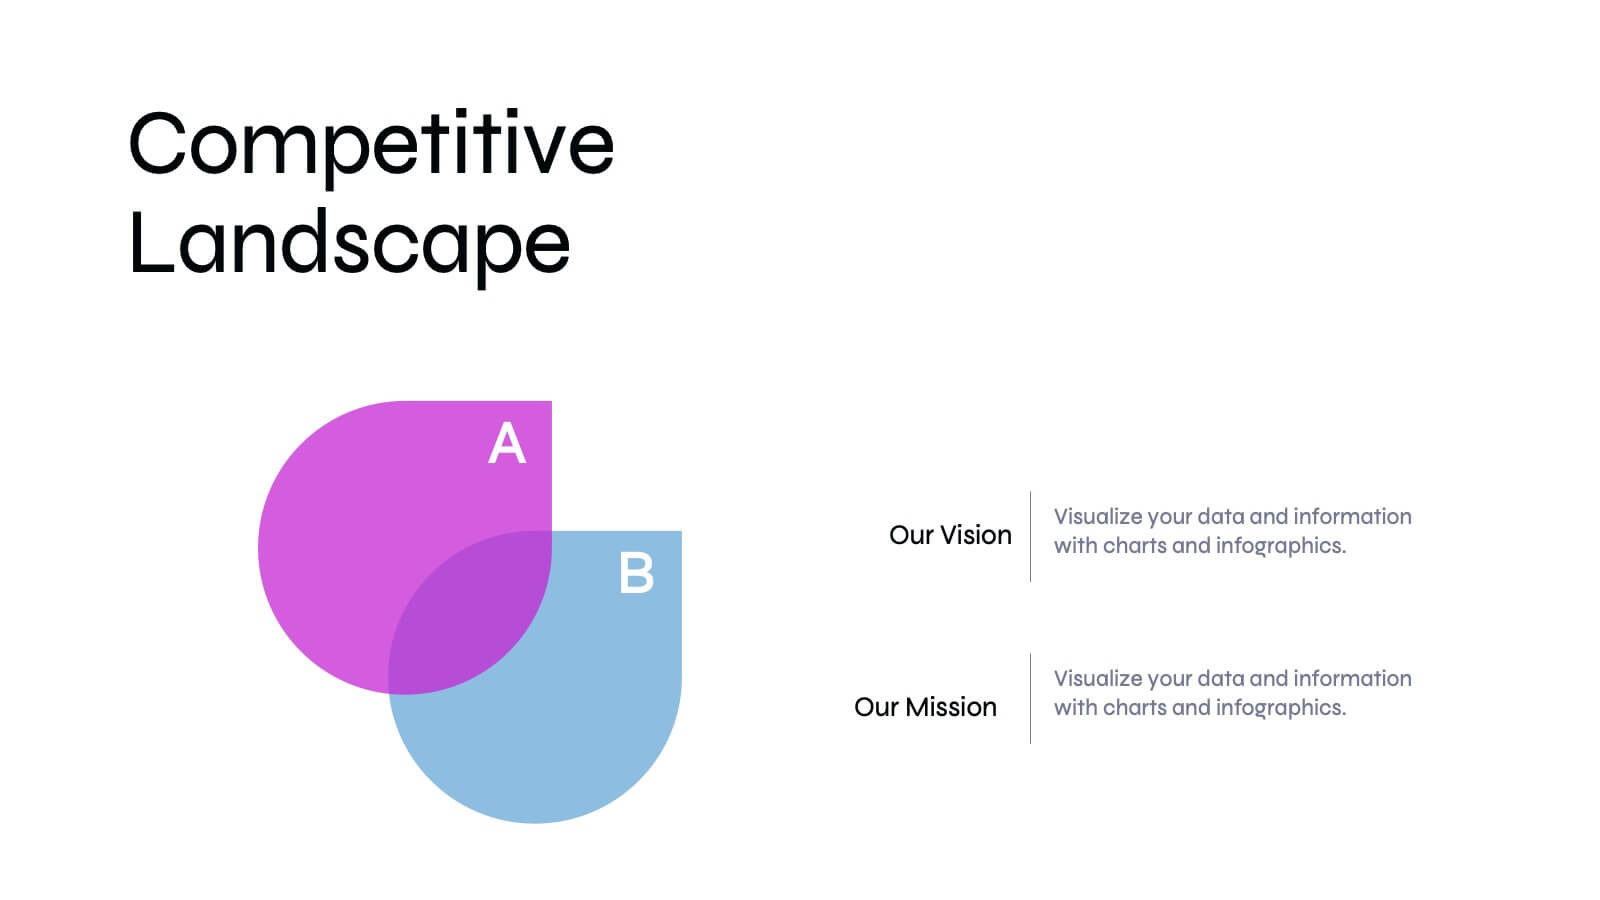
The Spartan Marketing Pitch Deck is designed to captivate and impress with its bold, modern layout and striking black-and-white color scheme. Perfect for delivering powerful marketing strategies, this template covers all essential aspects from industry overview to consumer behavior analysis. It seamlessly guides you through emerging technologies, content marketing trends, and mobile marketing insights. The deck emphasizes personalization trends, influencer marketing, and the latest eCommerce developments, ensuring your pitch resonates with cutting-edge strategies. Whether discussing SEO and SEM trends or diving into customer experience and brand storytelling, this template delivers your message with clarity and impact. Conclude with a strong call to action, ensuring your audience is engaged and ready to take the next step. Fully compatible with PowerPoint, Keynote, and Google Slides, the Spartan Marketing Pitch Deck is an excellent choice for professionals aiming to deliver a memorable and persuasive presentation.


27 slides
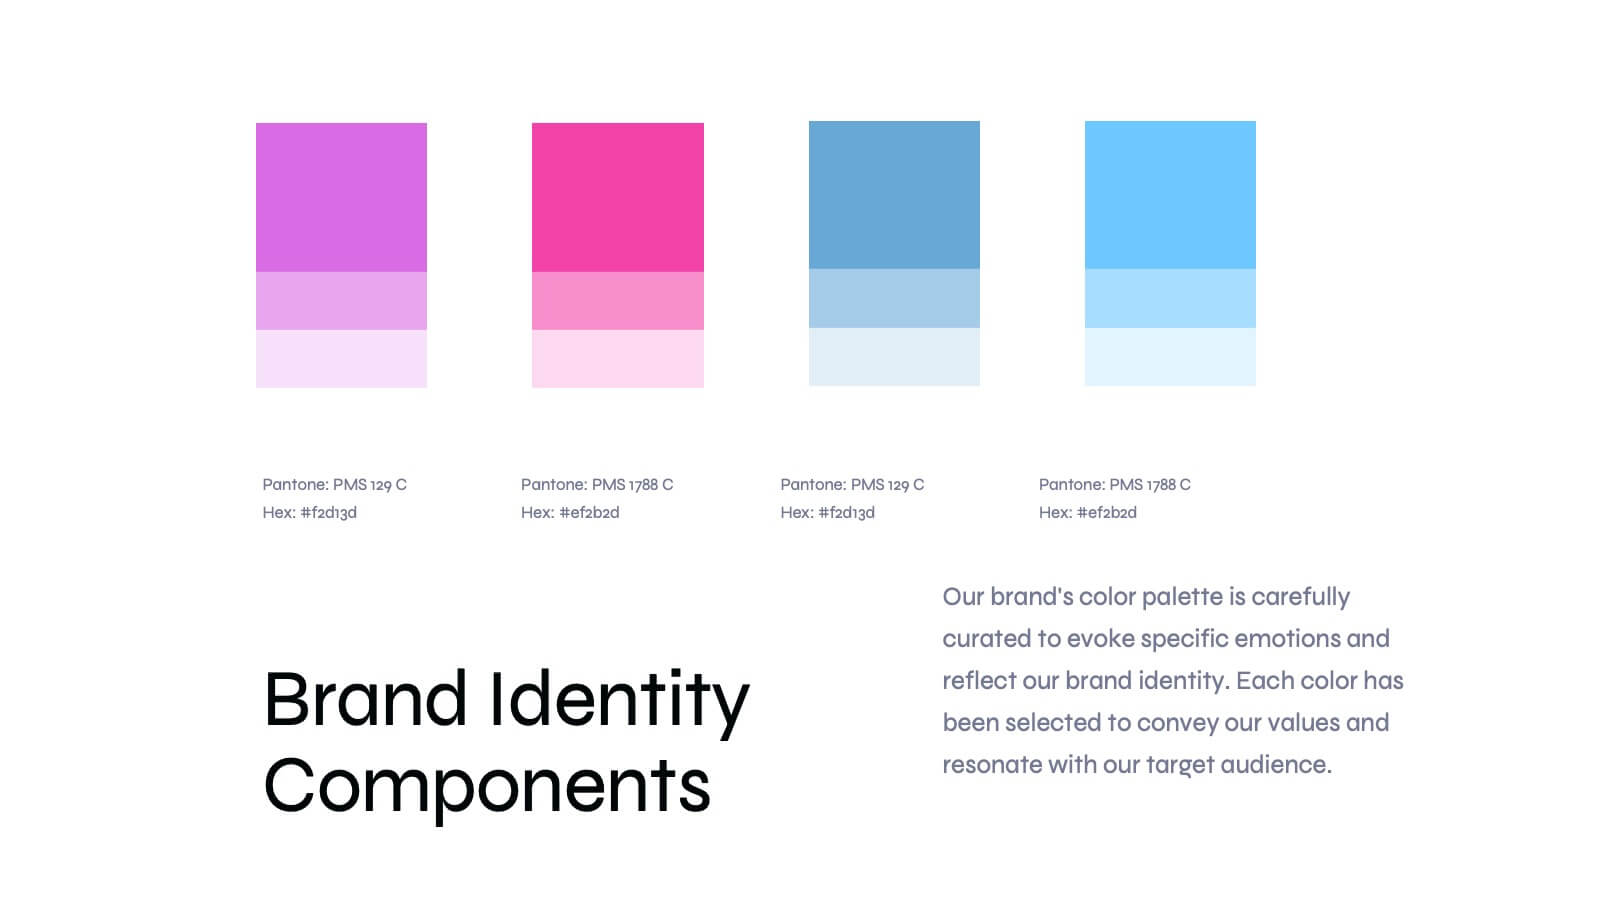
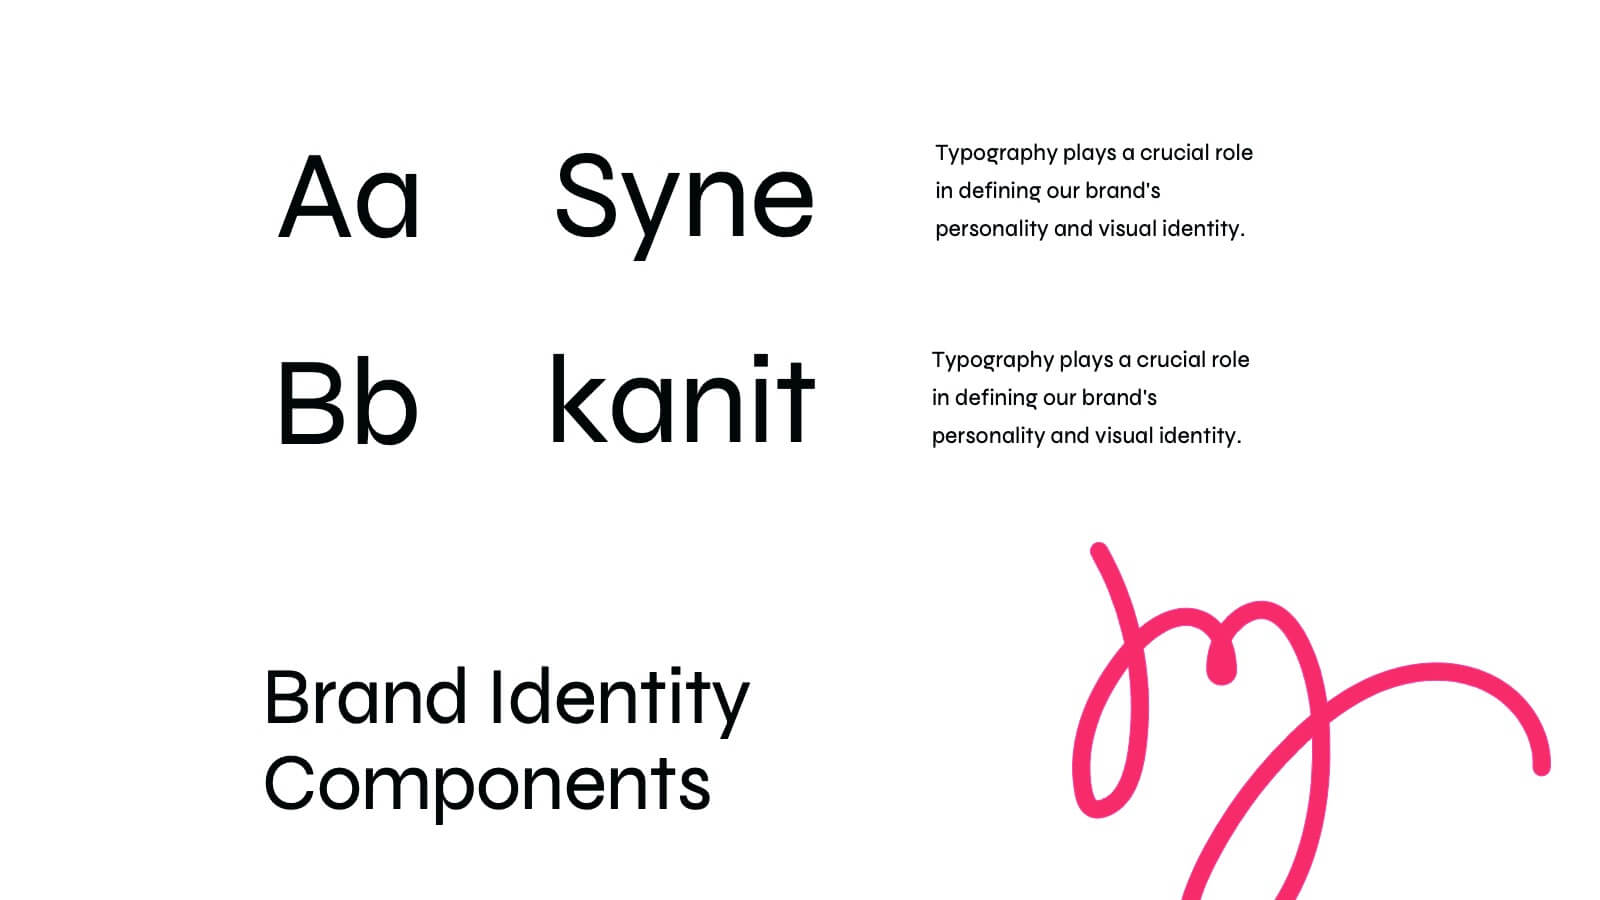
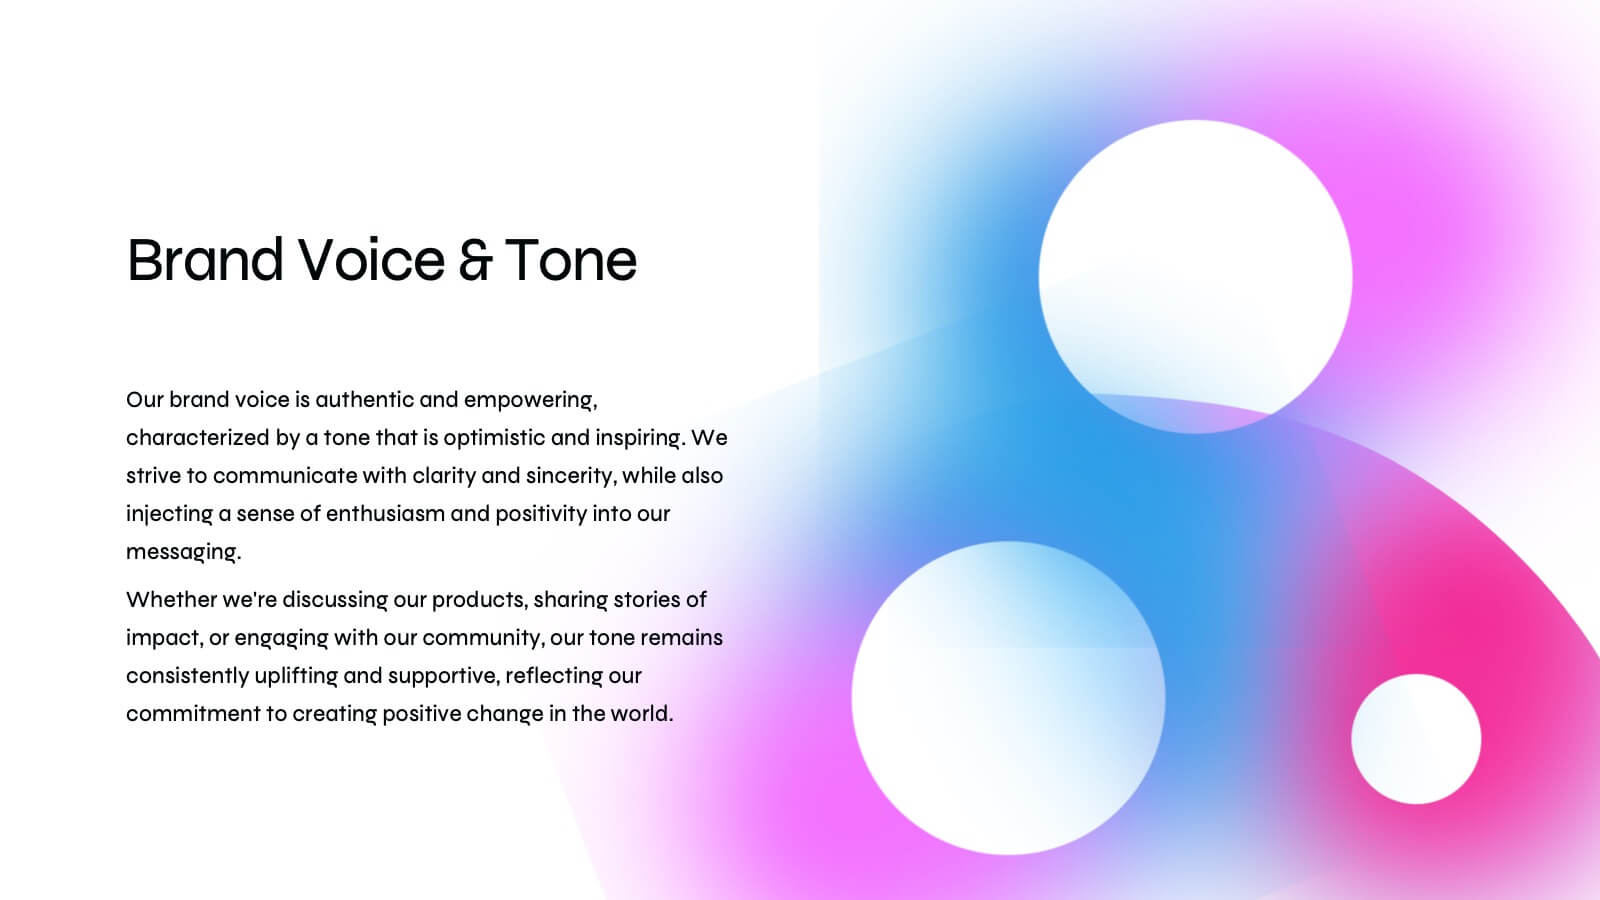
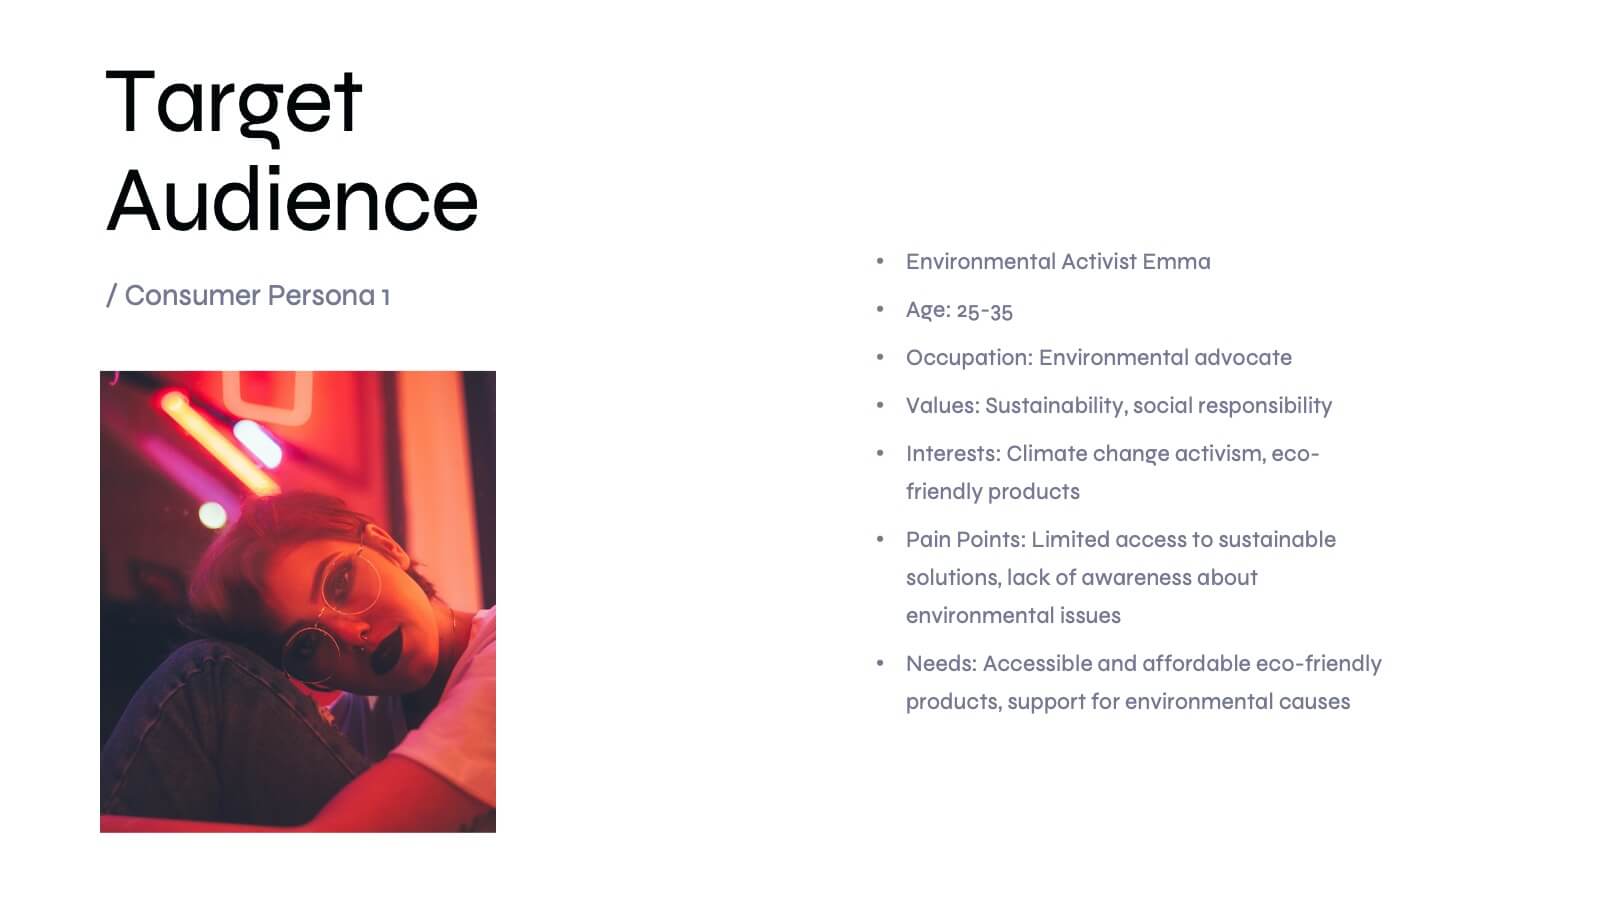
Basilisk Brand Guidelines Proposal Presentation
Present your brand strategy effectively with this modern brand guidelines proposal template! It includes sections for brand vision, values, identity, and market analysis. Fully customizable and compatible with PowerPoint, Keynote, and Google Slides, it’s perfect for showcasing your brand's identity and ensuring consistency across all platforms.


26 slides
Sophia Presentation Template
Sophia is a feminine template with a colorful presentation that is simple, clean and organized to make any information stand out. Sophia is suitable for personal projects as well as anyone looking for a presentation for their business. It's equipped to keep your content and layout consistent. The theme is eye catching with the colors, images and font. Anyone who has a bakery would love this template. Editing features make it easy to customize for your own needs by adding company logos, product information and other relevant details on your template. It is lightweight, fast and easy to use.


6 slides
Medical School Infographics
The "Medical School" infographic template is a meticulously curated and visually sophisticated tool, expertly tailored for PowerPoint, Keynote, and Google Slides. This template is an indispensable asset for medical educators, students, and healthcare professionals, aiming to illustrate the rigorous and multi-faceted journey of medical education. This template masterfully outlines key components of medical school, including curriculum structure, clinical rotations, research opportunities, and key milestones like exams and residencies. Its organized and detailed layout is perfect for guiding prospective students, orienting new enrollees, or showcasing medical programs during educational fairs and open houses. The design is as professional as it is educational, with a color scheme that is both serene and scholarly. This not only ensures your presentation is visually appealing but also aligns with the serious and life-changing nature of medical education. Whether it's used for orientation, academic presentations, or informational seminars, this template ensures that the journey through "Medical School" is presented in a manner that's both comprehensive and visually compelling.


4 slides
Regional Economic Evolution in Asia Map Presentation
Track economic progress across Asia with this regional growth map. Each country is paired with a progress bar for visual comparison of growth indicators. Ideal for data-driven insights, economic reviews, or development updates. Editable in PowerPoint, Keynote, and Google Slides for seamless customization and professional, geography-based presentations.


4 slides
Modern Geometric Shapes
Present your ideas with clean, minimal, and visually striking 3D shapes. This layout uses a sequence of geometric figures—cube, cone, and sphere—to represent step-by-step flows or abstract concepts. Ideal for design, architecture, education, or tech topics. Fully editable in PowerPoint, Keynote, and Google Slides.


7 slides
Network Infographics Presentation Template
Networking is a great way to meet people in your same field and gain valuable information. It's a great way to meet and connect with other professionals, find out about job opportunities, and keep up with what's new in your field. This template is perfect for becoming informed on the benefits of networking. Networking is a powerful way to expand your circle of contacts and get in touch with people who can help you advance in your career. This template includes a helpful infographic that explains the standard process, visualizations and diagrams, providing you with a great starting point.


4 slides
Business Goals and Objectives Presentation
Build a strong foundation for success with this business goals and objectives template! Designed to help organizations define clear targets and align strategies, this visual layout simplifies goal-setting and planning. Perfect for corporate teams, startups, and strategists. Fully customizable and compatible with PowerPoint, Keynote, and Google Slides for effortless editing.


6 slides
Virtual Collaboration for Remote Teams
Make teamwork flow from anywhere with this streamlined roadmap-style layout built for remote collaboration. Designed to visualize communication stages, key roles, or workflow steps, this template helps virtual teams stay aligned and productive—no matter where they are. Fully compatible with PowerPoint, Keynote, and Google Slides.


5 slides
Construction Projects Infographics
Construction projects refer to the process of planning, designing, and building structures, infrastructure, or facilities. These vertical infographics are visually appealing and informative resources designed to showcase various aspects of construction projects. It provides a comprehensive overview of the construction industry, highlighting key statistics, trends, and best practices. The template showcases different types of construction projects. It includes visuals and brief descriptions to illustrate the unique characteristics and requirements of each type. Compatible with Powerpoint, Keynote, and Google Slides.


5 slides
Supply Chain Management Plan Presentation
Streamline your presentation with a sleek and organized design built to illustrate process flow and logistics. Perfect for explaining production stages, delivery systems, or business operations, this visual layout brings clarity and structure to your message. Compatible with PowerPoint, Keynote, and Google Slides for effortless customization and use.


4 slides
Regional Analytics for North America Map Presentation
Visualize key performance metrics by region with the Regional Analytics for North America Map Presentation. This slide layout combines stacked bar visuals with a detailed map, allowing you to compare data points across multiple regions. Ideal for reporting trends, KPIs, or market analysis. Fully editable in Canva, PowerPoint, and Google Slides.


8 slides
Africa Development & Market Potential Presentation
Showcase regional opportunities with the Africa Development & Market Potential Presentation. This professional slide highlights four key countries across the continent using vibrant map markers and icons, ideal for data comparison, investment potential, or development tracking. Cleanly structured and easy to edit in PowerPoint, Keynote, Google Slides, and Canva.


5 slides
Climate Change Awareness Presentation
Deliver impactful environmental messages with this thermometer-style infographic layout. Ideal for visualizing temperature rise, emissions levels, or awareness metrics, each slide segment represents a stage of climate impact. Perfect for educators, NGOs, sustainability experts, or policy presentations. Fully customizable in PowerPoint, Keynote, and Google Slides.